. 2022 Mar 27;14(4):695.
doi: 10.3390/v14040695.

Emergence of Two Distinct SARS-CoV-2 Gamma Variants and the Rapid Spread of P.1-like-II SARS-CoV-2 during the Second Wave of COVID-19 in Santa Catarina, Southern Brazil

Affiliations

Emergence of Two Distinct SARS-CoV-2 Gamma Variants and the Rapid Spread of P.1-like-II SARS-CoV-2 during the Second Wave of COVID-19 in Santa Catarina, Southern Brazil

Dayane Azevedo Padilha et al. Viruses. .

Abstract

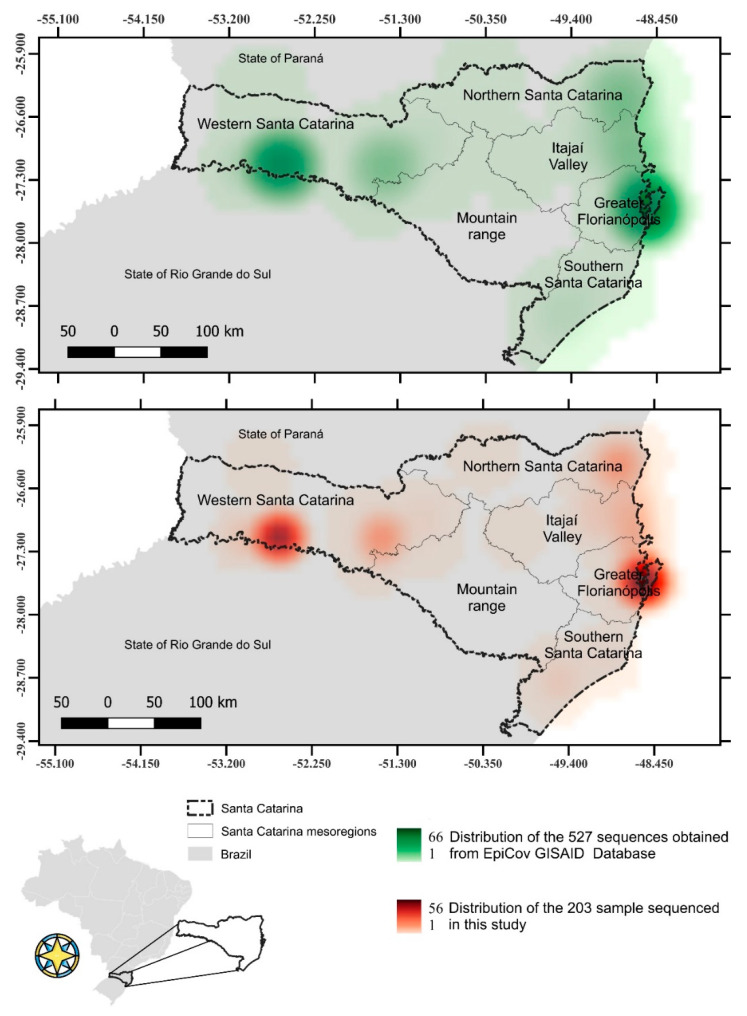
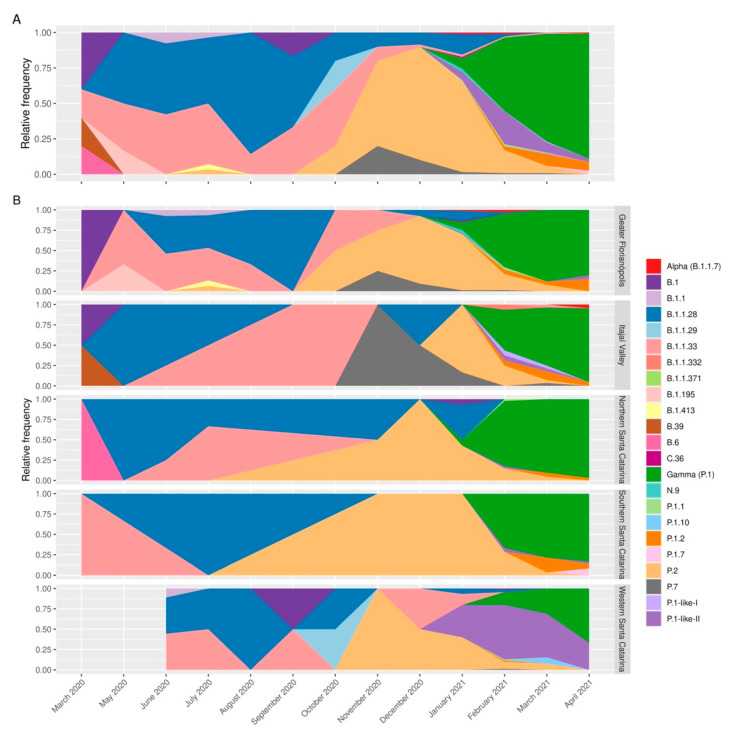
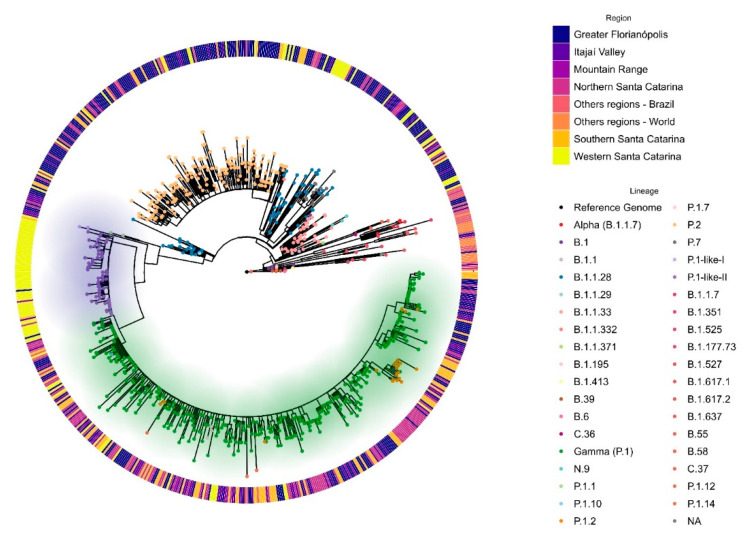
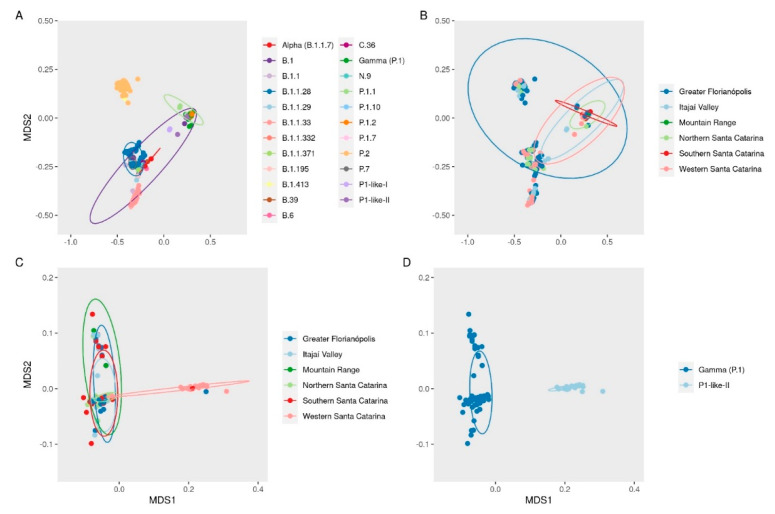
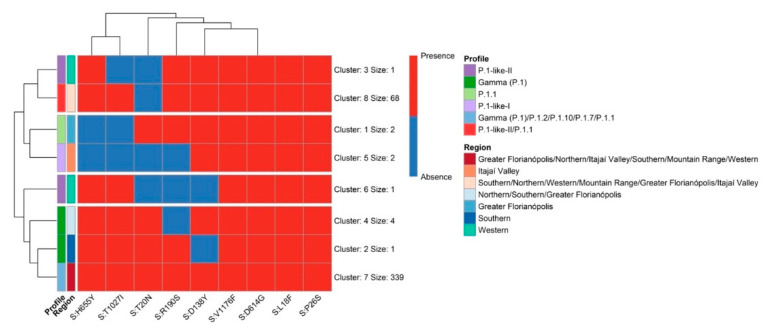
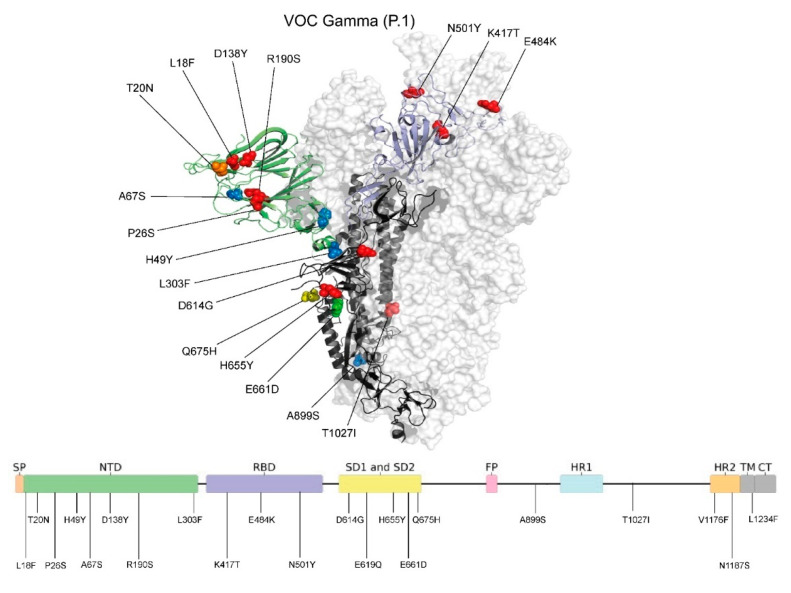
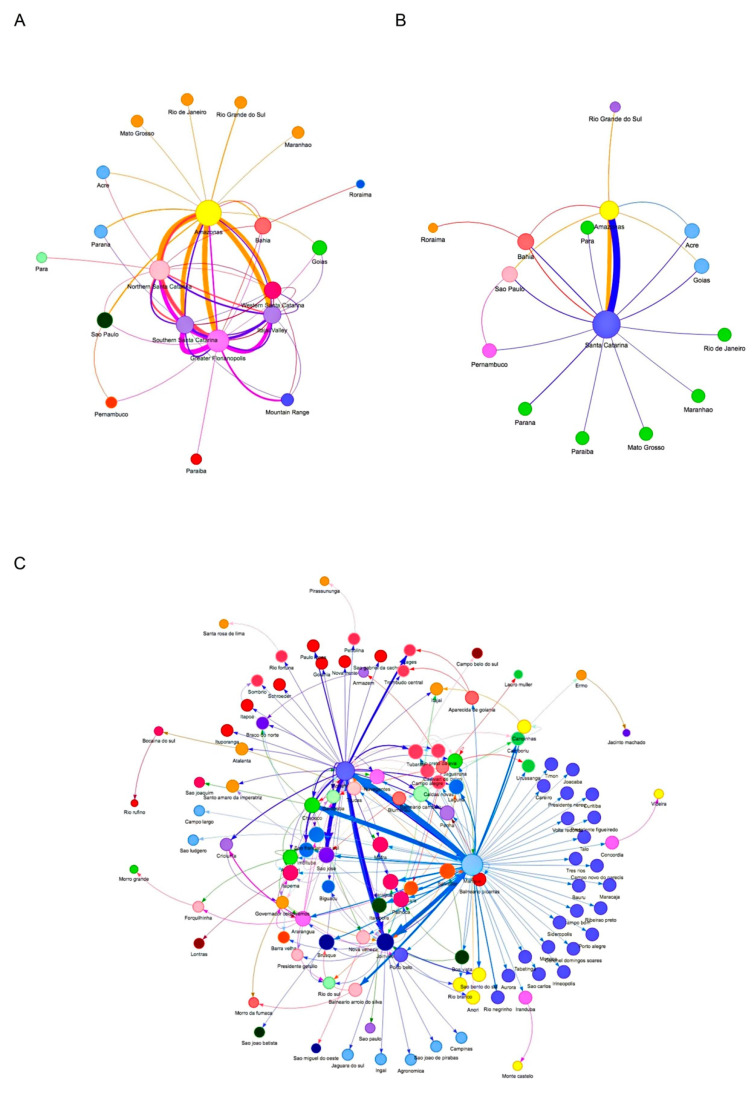
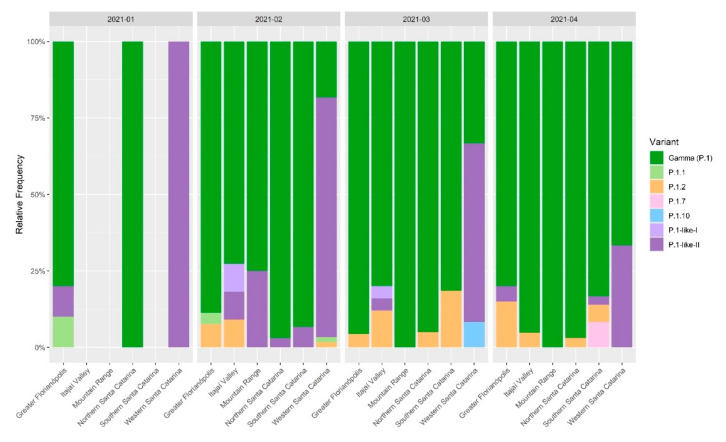
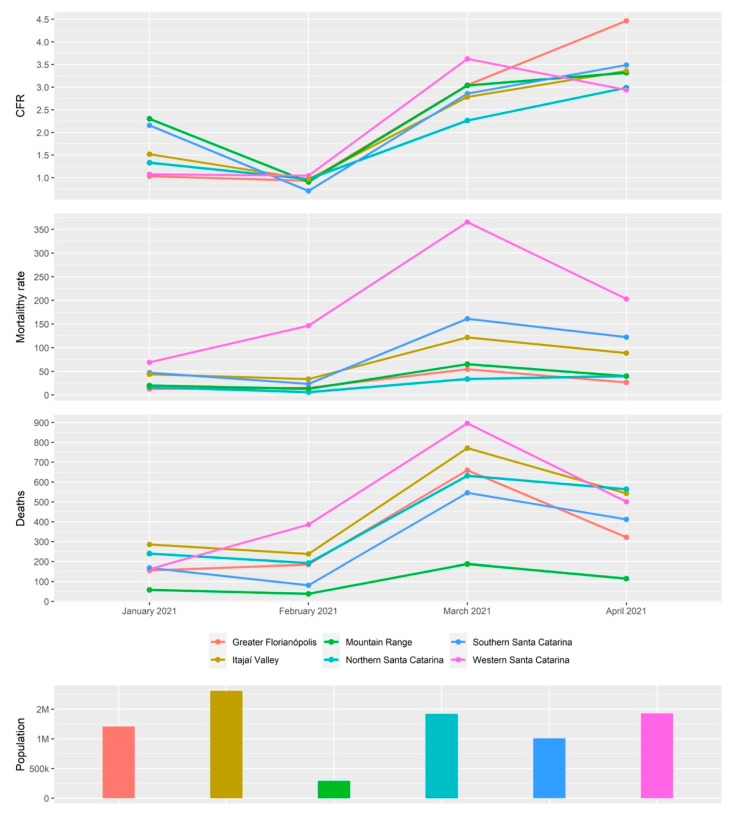
The western mesoregion of the state of Santa Catarina (SC), Southern Brazil, was heavily affected as a whole by the COVID-19 pandemic in early 2021. This study aimed to evaluate the dynamics of the SARS-CoV-2 virus spreading patterns in the SC state from March 2020 to April 2021 using genomic surveillance. During this period, there were 23 distinct variants, including Beta and Gamma, among which the Gamma and related lineages were predominant in the second pandemic wave within SC. A regionalization of P.1-like-II in the Western SC region was observed, concomitant to the increase in cases, mortality, and the case fatality rate (CFR) index. This is the first evidence of the regionalization of the SARS-CoV-2 transmission in SC and it highlights the importance of tracking the variants, dispersion, and impact of SARS-CoV-2 on the public health systems.

Keywords: SARS-CoV-2; SARS-CoV-2 P.1 variant; genome; surveillance.


Conflict of interest statement

The authors declare no conflict of interest.

Figures

Figure 1
Figure 1
Distribution of sequenced SARS-CoV-2 genomes in Santa Catarina from 1st March 2020 to 30th April 2021. Map showing the Santa Catarina SARS-CoV-2 sequences obtained from GISAD EpiCov Database (upper map) and samples sequenced in this study (lower map).
Figure 2
Figure 2
SARS-CoV-2 variant profiles in the state of Santa Catarina from March 2020 to April 2021. (A) Analysis of the variant profile considering the whole state of Santa Catarina. (B) The variant profile by Santa Catarina mesoregion. From March to September 2020, the variants identified were in the highest proportion of B.1.1.28 (blue) and B.1.1.33 (light red). From September 2020 to January 2021, the highest proportion was of P.2 variant, followed by VOC Gamma and related lineages from February to April 2021.
Figure 3
Figure 3
Phylogenomic reconstruction analysis of Santa Catarina SARS-CoV-2 sequences from 1st March 2020 to 30th April 2021. Maximum likelihood (ML) phylogenetic tree was reconstructed using GTR + F + I substitution model, with 1000 iterations in Ultra-Fast Bootstrap mode with SH-like approximate likelihood ratio test (SH-aLRT). All 779 sequences were aligned with 49 reference sequences of distinct SARS-CoV-2 variants available in GISAID. Dots represent the variants or lineages indicated on the right-bottom legend. According to the right-top legend, the outside bars indicate the sample mesoregion of Santa Catarina or others. The green shadow indicates the VOC Gamma and related lineages (P.1.1, P1.2, P.1.10, and P.1.7) clade. Lilac shadow indicates the P.1-like-II clade.
Figure 4
Figure 4
Multidimensional scale (MDS) plot of Jaccard dissimilarity matrix between genomes based on the presence and absence of mutations, deletions, and insertions labeled by (A) variants and (B) region. MDS analysis of only VOC Gamma and related lineages labeled by (C) region and (D) variant or lineages.
Figure 5
Figure 5
The non-synonymous amino acid substitution profile of the VOC Gamma and related lineages genomes in the state of Santa Catarina from 3 January 2020 to 30 April 2021.
Figure 6
Figure 6
Overlay of VOC Gamma spike protein mutations identified in the state of Santa Catarina during the COVID-19 pandemic. Residues involved in mutations are presented as spheres, colored from blue to red (low to high mutation frequency). The mutation sites are also indicated in the two-dimensional representation of the spike protein, which is colored according to protein regions. The NTD domain is colored in green and the RBD domain is colored in purple. From the total 778 analyzed sequences of the VOC Gamma variant (5′–3′), red represents a frequency of 93.6–100%, orange a frequency of 88.8%, yellow a frequency of 3.98%, green a frequency of 1.79%, and blue a frequency of less than 1%. Image generated using PyMOL version 2.3.3 [35].
Figure 7
Figure 7
Network analysis of VOC Gamma and related lineages sequenced in the state of Santa Catarina, Brazil, from 3rd January 2020 to 30th April 2021 with the other Brazilian states. The ML analysis was performed on 13,018 Brazilian VOC Gamma-related genomes obtained from GISAID until 30th April 2021 and submitted to StrainHub [34] analysis considering the closeness parameter. The sizes of the nodes are scaled by the closeness metric and the arrows reflect the directionality of possible transmissions among the Brazilian states (A), Santa Catarina mesoregions (B), and Santa Catarina cities (C). The thickness of the lines and arrows represents the frequency of putative transmissions.
Figure 8
Figure 8
Relative frequencies of the SARS-CoV-2 VOC Gamma and related lineages by mesoregions of the state of Santa Catarina during the second wave of the COVID-19 pandemic, January to April 2021. A representative alignment of spike proteins from these sequences is available in Supplementary Figure S2.
Figure 9
Figure 9
Epidemiological data from each mesoregion of the state of Santa Catarina during the second COVID-19 pandemic wave (January 2020 to April 2021). Case fatality rate (CFR), mortality rate, number of deaths, and population size. Data source: Santa Catarina Epidemiological Surveillance Directorate [15].

References

    1. World Health Organization WHO Coronavirus (COVID-19) [(accessed on 12 December 2021)]. Available online: https://www.who.int.
    1. National Council of Health Secretaries-Covid-19 CONASS Panel. [(accessed on 4 December 2021)]. Available online: https://www.conass.org.br/painelconasscovid19/
    1. Singh J., Pandit P., McArthur A.G., Banerjee A., Mossman K. Evolutionary trajectory of SARS-CoV-2 and emerging variants. Virol. J. 2021;18:166. doi: 10.1186/s12985-021-01633-w. - DOI - PMC - PubMed
    1. Meredith L.W., Hamilton W.L., Warne B., Houldcroft C.J., Hosmillo M., Jahun A.S. Rapid implementation of SARS-CoV-2 sequencing to investigate cases of healthcare associated COVID-19: A prospective genomic surveillance study. Lancet Infect. Dis. 2021;21:e36. Corrected and republished from Lancet Infect Dis. 2020, 20, 1263–1272. - PMC - PubMed
    1. Global Initiative on Sharing Avian Influenza Data. 2008. [(accessed on 27 November 2021)]. Available online: https://www.gisaid.org.

Publication types

Substances

Supplementary concepts