. 2022 Apr 15;22(8):3045.
doi: 10.3390/s22083045.

Qualitative Analysis of Glass Microfragments Using the Combination of Laser-Induced Breakdown Spectroscopy and Refractive Index Data

Affiliations

Qualitative Analysis of Glass Microfragments Using the Combination of Laser-Induced Breakdown Spectroscopy and Refractive Index Data

Dávid Jenő Palásti et al. Sensors (Basel). .

Abstract

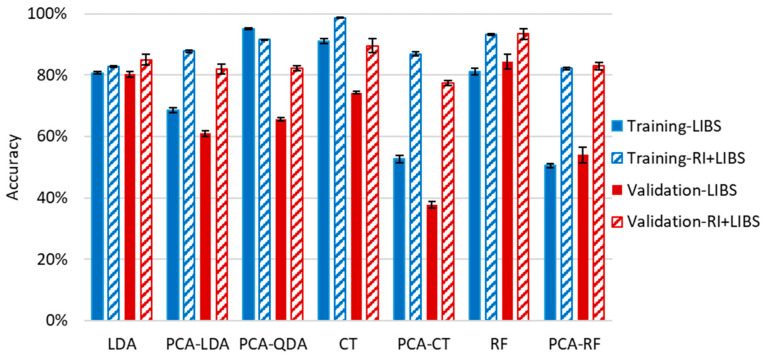
We have successfully demonstrated that although there are significant analytical challenges involved in the qualitative discrimination analysis of sub-mm sized (microfragment) glass samples, the task can be solved with very good accuracy and reliability with the multivariate chemometric evaluation of laser-induced breakdown spectroscopy (LIBS) data or in combination with pre-screening based on refractive index (RI) data. In total, 127 glass samples of four types (fused silica, flint, borosilicate and soda-lime) were involved in the tests. Four multivariate chemometric data evaluation methods (linear discrimination analysis, quadratic discrimination analysis, classification tree and random forest) for LIBS data were evaluated with and without data compression (principal component analysis). Classification tree and random forest methods were found to give the most consistent and most accurate results, with classifications/identifications correct in 92 to 99% of the cases for soda-lime glasses. The developed methods can be used in forensic analysis.

Keywords: chemometrics; forensic analysis; glass samples; laser-induced breakdown spectroscopy (LIBS); multielemental sensing; sample discrimination.


Conflict of interest statement

The authors declare no conflict of interest.

Figures

Figure 1
Figure 1
Contact profilometric data of the laser ablation craters on some selected glass types and sub-types. Ten laser pulses of 266 nm, with 40 µm spot size and 10 mJ pulse energy were delivered to the sample surface. The graph in the top left corner illustrates the large variation of the observed crater volume data for all glass types (the blue column represents the range and the red dot the mean value). The curvature of the profilometric maps is due to the actual curvature of the surface of glass fragments.
Figure 2
Figure 2
Intra-fragment lateral compositional variations for different glass types: (A) flint; (B) borosilicate; (C) fused silica; (D) soda–lime as assessed by comparing LIBS spectra taken at various locations by the linear correlation function. The average spectrum across the depth was taken as reference during the comparisons. The plots show the correlation coefficient on their radial axes.
Figure 3
Figure 3
Depth-related compositional variations for float glass fragments, as assessed by plotting the net LIBS intensity of spectral lines of two selected elements as a function of the number of laser shots delivered. Error bars indicate scatter across intra-fragment locations at the same depth.
Figure 4
Figure 4
Representative LIBS spectra of borosilicate, soda–lime, fused silica and flint glass samples. The intensity scale of each spectrum is normalized to the highest peak intensity.
Figure 5
Figure 5
Classification of glass types according to the pairwise aggregated concentration of some indicator elements (Pb + Ba, B + Al, Ca + K). Quantitative analysis was based on calibration using the NIST 61X glass standard series. Markers of different glass types have different colors, while sub-type markers differ in shape.
Figure 6
Figure 6
The spread (min, mean, max) of refractive index data of the studied glass types [41].
Figure 7
Figure 7
The experimental spread (min, mean, max) of refractive index data of the studied glass sub-types.
Figure 8
Figure 8
Cumulative (weighted mean) classification accuracy of various data evaluation methods for the assessment of the four sub-types of soda–lime glass samples by using LIBS data. Error bars are based on three replicate analyses using randomized separation of sample spectra to training and validation sets.
Figure 9
Figure 9
Cumulative (weighted mean) classification accuracy of various data evaluation methods for the identification of 100 individual soda–lime glass samples by using only the LIBS data and combining it with RI pre-screeing. Error bars are based on three replicate analyses using randomized separation of sample spectra to training and validation sets.
Figure 10
Figure 10
Flowchart of the process of identification (classification) of individual glass samples using the combined RI and LIBS approach.

References

    1. Caddy B. Forensic Examination of Glass and Paint: Analysis and Interpretation. Taylor & Francis; Oxfordshire, UK: 2001.
    1. Katz E., Halámek J. Forensic Science: A Multidisciplinary Approach. Wiley & Sons; New York, NY, USA: 2016.
    1. Siegel J., Saukko P. Encyclopedia of Forensic Sciences. Academic Press; Cambridge, MA, USA: 2013.
    1. Ramos D., Zadora G. Information-theoretical feature selection using data obtained by scanning electron microscopy coupled with energy dispersive X-ray spectrometer for the classification of glass traces. Anal. Chim. Acta. 2011;705:207–217. doi: 10.1016/j.aca.2011.05.029. - DOI - PubMed
    1. Montoriol R., Guilbeau-Frugier C., Chantalat E., Roumiguié M., Delisle M.-B., Payré B., Telmon N., Savall F. Detection of glass particles on bone lesions using SEM-EDS. Int. J. Legal Med. 2017;131:1347–1354. doi: 10.1007/s00414-017-1608-4. - DOI - PubMed