. 2022 Apr 22;13(4):398.
doi: 10.1038/s41419-022-04741-9.

Cisplatin resistance can be curtailed by blunting Bnip3-mediated mitochondrial autophagy

Affiliations

Cisplatin resistance can be curtailed by blunting Bnip3-mediated mitochondrial autophagy

Caterina Vianello et al. Cell Death Dis. .

Erratum in

Abstract

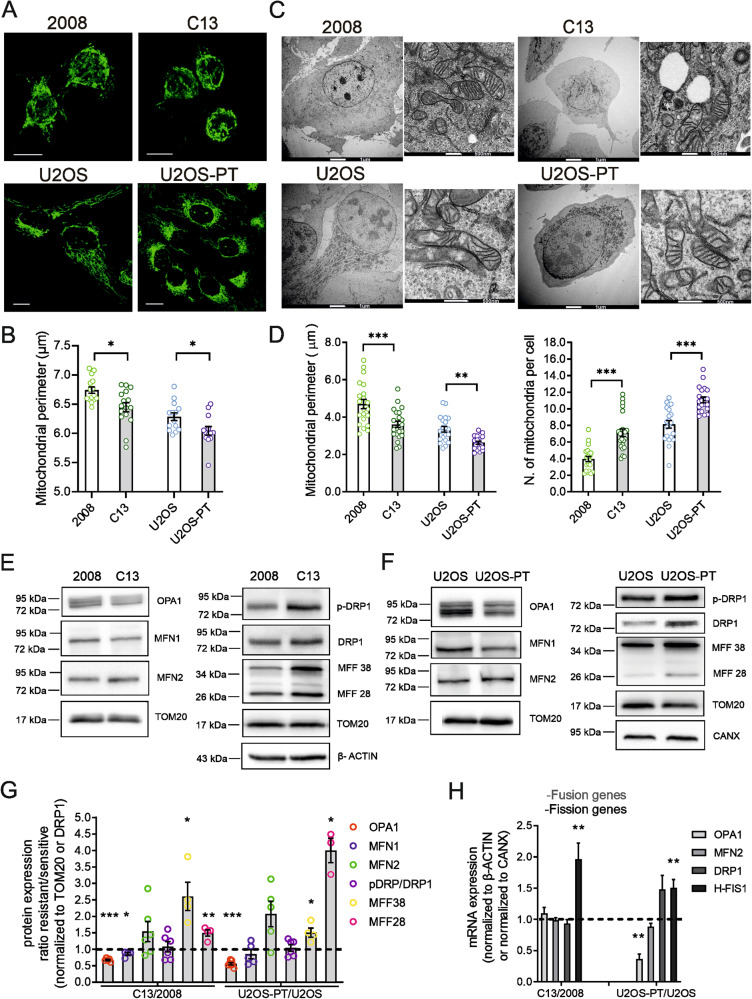
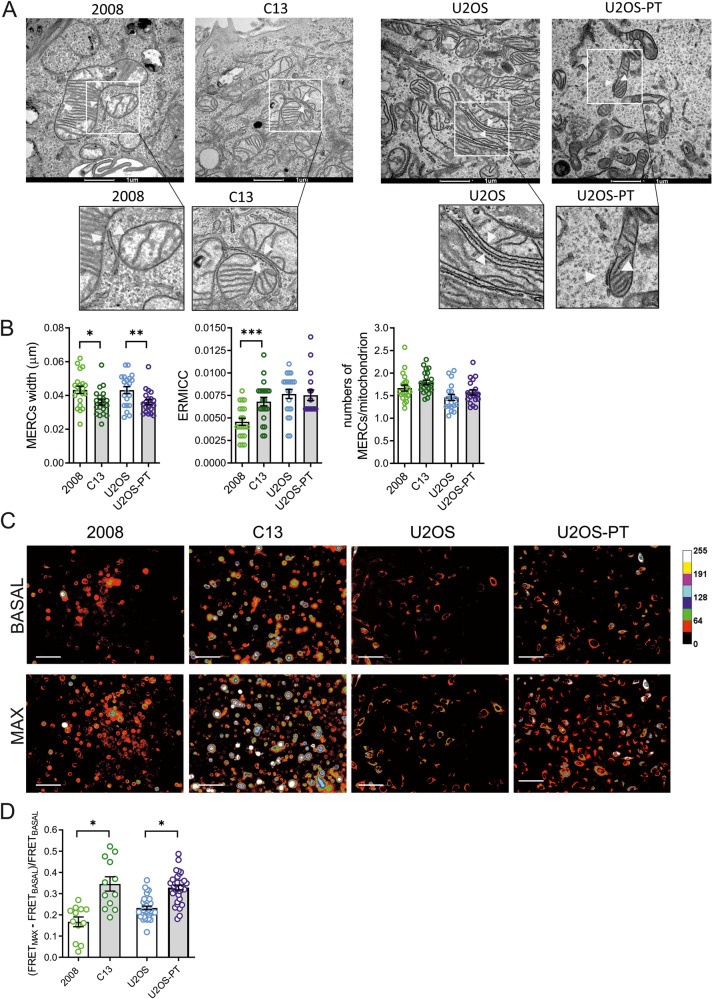
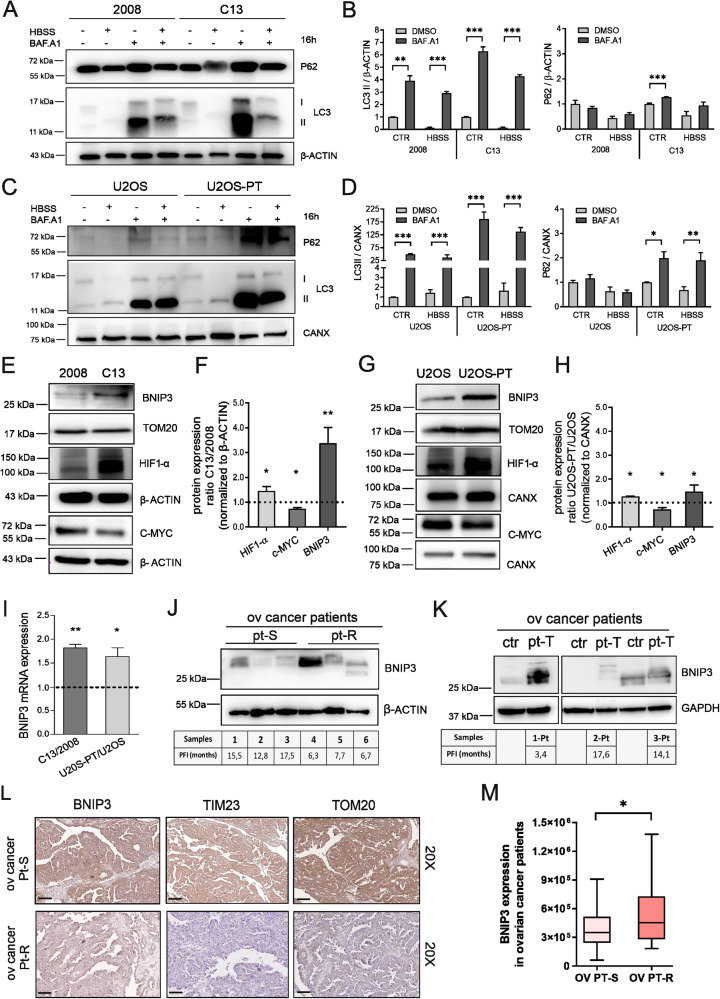
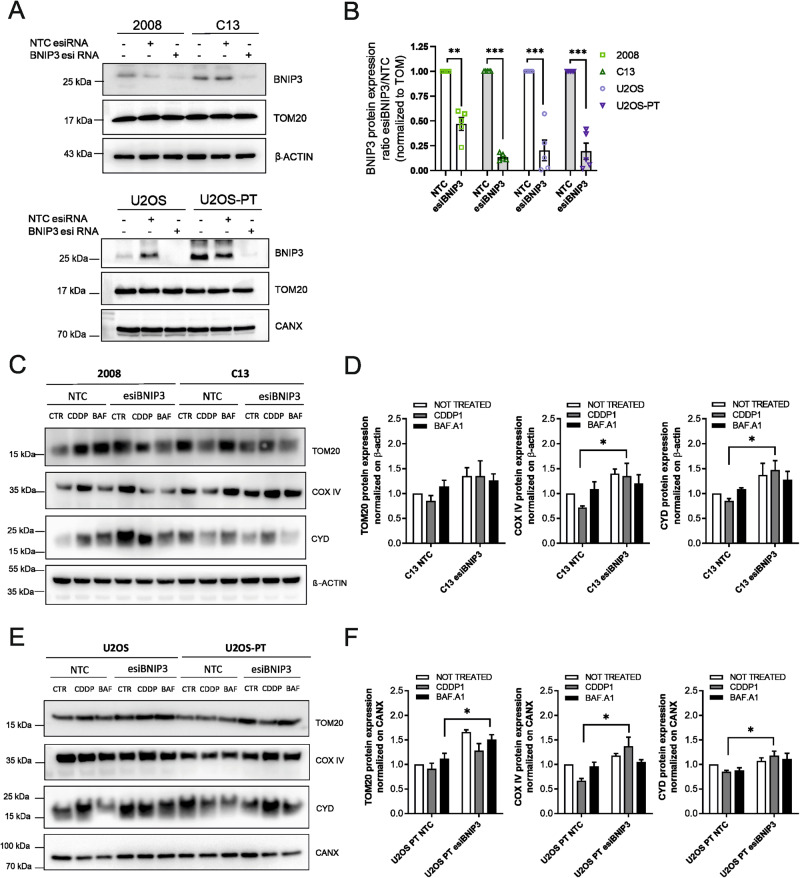
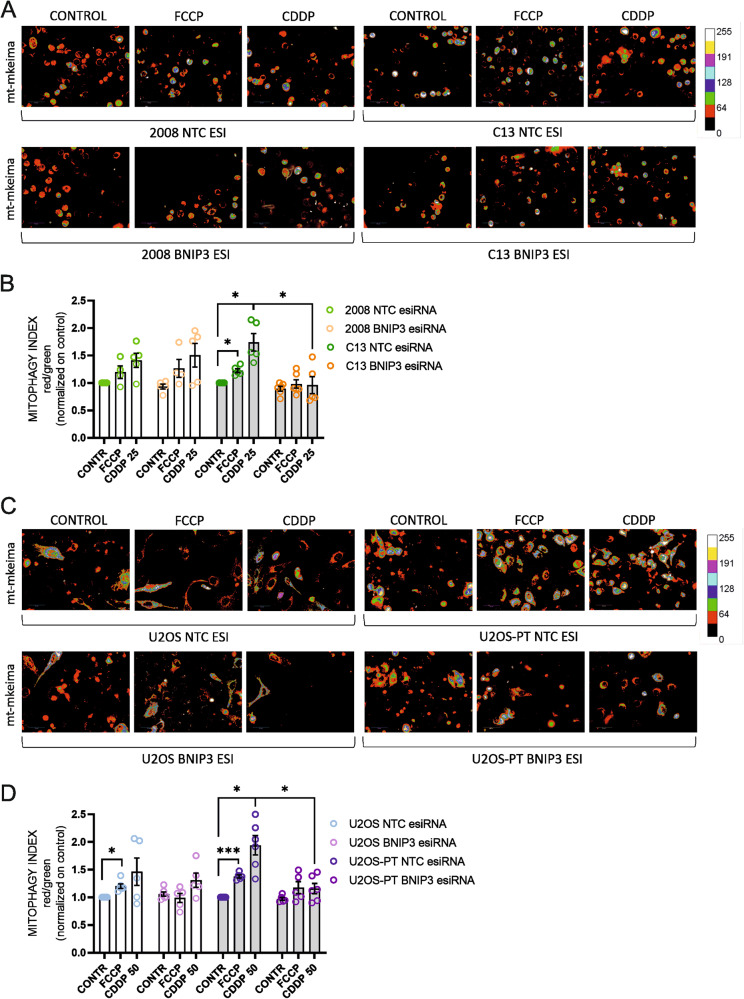
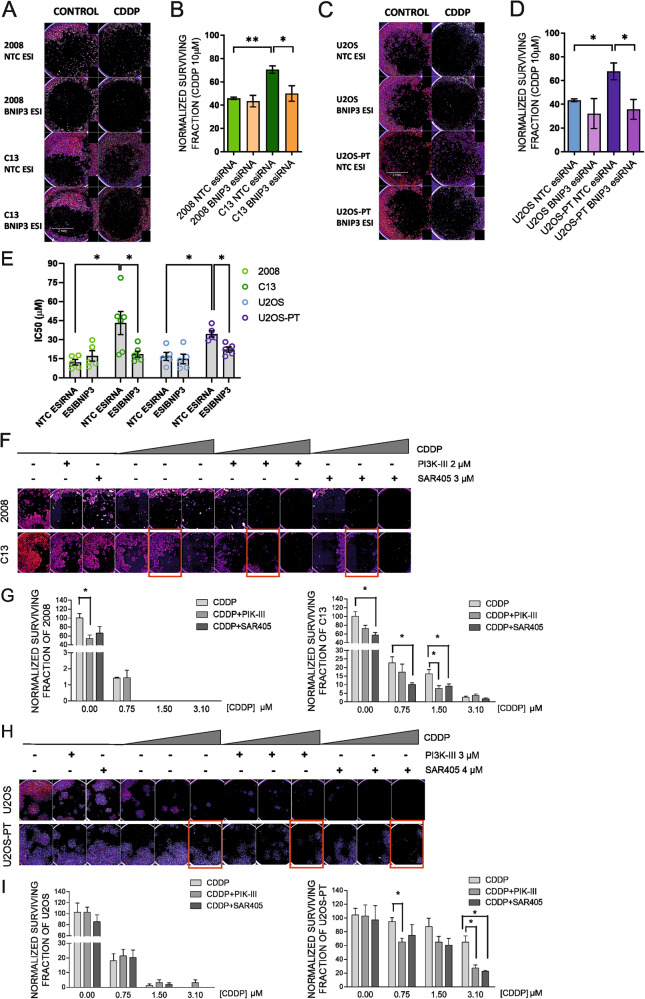
Cisplatin (CDDP) is commonly used to treat a multitude of tumors including sarcomas, ovarian and cervical cancers. Despite recent investigations allowed to improve chemotherapy effectiveness, the molecular mechanisms underlying the development of CDDP resistance remain a major goal in cancer research. Here, we show that mitochondrial morphology and autophagy are altered in different CDDP resistant cancer cell lines. In CDDP resistant osteosarcoma and ovarian carcinoma, mitochondria are fragmented and closely juxtaposed to the endoplasmic reticulum; rates of mitophagy are also increased. Specifically, levels of the mitophagy receptor BNIP3 are higher both in resistant cells and in ovarian cancer patient samples resistant to platinum-based treatments. Genetic BNIP3 silencing or pharmacological inhibition of autophagosome formation re-sensitizes these cells to CDDP. Our study identifies inhibition of BNIP3-driven mitophagy as a potential therapeutic strategy to counteract CDDP resistance in ovarian carcinoma and osteosarcoma.


Conflict of interest statement

ADM is employee and shareholder of Sprint Bioscience AB. All the other authors declare no conflicts of interest.

Figures

Fig. 1
Fig. 1. Mitochondria are fragmented in CDDP resistant cells.
A Images of mitochondrial network in sensitive (2008, U2OS) and resistant (C13, U2OS-PT) cells acquired by confocal microscopy Zeiss using TOM20 immunostaining, 488. Scale bar 20 µm. B Mitochondria segmentation was performed using the ImageJ Squassh plugin (Rizk et al., 2014); size and morphology features were measured by using Fiji. Data from 15 different cells per cell line. *p < 0.05, calculated by a two-tailed unpaired t-test comparing resistant vs sensitive cells. C Images of mitochondrial morphology in sensitive (2008, U2OS) and resistant (C13, U2OS-PT) cells acquired by Tecnai G2 (FEI) transmission electron microscope operating at 100 kV; images were collected by a F114 (TVIPS) CCD camera. The TEM images and experiment are performed by the University of Padova electron microscopy facility. Scale bar 1 µm and 500 nm. D The morphometric analysis was performed using ImageJ freehand tool (at least 5 cells per sample, at least 50 images/sample). Data are the mean ± SEM of three different experiments; **p < 0.01, ***p < 0.001, calculated by a two-tailed unpaired t-test comparing resistant vs sensitive cells. E, F Expression of OPA1, MFN1, MFN2, MFFs, p-DRP1 and total DRP1. G The optical density (O.D.) was normalized respectively to TOM20; for total DRP1 to β-ACTIN for 2008-C13 or calnexin for U2OS-U2OS-PT in cancer cells sensitive and resistant. The data are expressed as ratio of resistant cells to sensitive. Data are the mean ± SEM of 4–5 different experiments; *p < 0.05; **p < 0.01, ***p < 0.001, calculated by a two-tailed unpaired t-test comparing resistant vs sensitive cells. H mRNA expression of genes OPA1, MFN2, DRP1 and H-FIS1 normalized to β-actin for 2008-C13 or calnexin for U2OS-U2OS-PT. The data are expressed as a ratio of resistant cells to sensitive cells set to 1. Data are the mean ± SEM of 4–5 different experiments; *p < 0.05; **p < 0.01, calculated by a two-tailed unpaired t-test comparing resistant vs sensitive cells.
Fig. 2
Fig. 2. Resistant cells show an increased Mitochondria–ER proximity.
A Images of mitochondria–ER contact sites in sensitive cells (2008, U2OS) and resistant (C13, U2OS-PT) acquired by Tecnai G2 (FEI) transmission electron microscope operating at 100 kV; images were collected by a F114 (TVIPS) CCD camera and the respective magnification of mitochondria–ER contact sites images. The TEM images and experiments are performed by the University of Padova electron microscopy facility. Scale bar 1 µm. B) The morphometric analysis of electron micrographs was performed using ImageJ freehand tool (7 cells per sample, at least 30 images/sample). We used the ER–mitochondria contact coefficient (ERMICC) to measure the extent of physical interaction among mitochondria and ER (as described in the Experimental procedures section). Data are the mean ± SEM of 3 different experiments; *p < 0.05, calculated by a two-tailed unpaired t-test comparing resistant vs sensitive cells. C Images of FRET signal using a modified FRET-based indicator of ER–mitochondria proximity (FEMP). D The respective measure of FRET signal of 2008-C13 and U2OS-U2OS-PT and quantification of the maximum MERC index for the indicated cell lines infected with Adenovirus FEMP. Scale bar 100 µm. Data represents mean ± SEM of 3 independent experiments; *p < 0.05, calculated by a two-tailed unpaired t-test comparing resistant vs sensitive cells. Cells from the raw images were segmented using YFP channel and intensity measures of CFP, YFP and FRET along with corresponding background intensities were calculated. Mean FRET Ratio intensity was then calculated by subtracting the background and normalizing to CFP intensity.
Fig. 3
Fig. 3. Resistant clones boost the autophagic flux in association with higher expression of hypoxia-induced BNIP3.
A and C Autophagic flux was measured by assessing levels of p62, LC3 BI, LC3 BII after 16 h starvation in HBSS, upon 200 nM Bafilomycin A1 treatment or HBSS in combination with Bafilomycin A1. The optical density was normalized on β-ACTIN (2008-C13) (B) and (D) on calnexin (U2OS-U2OS-PT). The data are expressed in the percentage of treated cells with respect to untreated cells. Data are the mean ± SEM of 4–5 different experiments. *p < 0.05; **p < 0.01; ***p < 0.001, calculated by a two-tailed unpaired t-test comparing Bafilomycin A1 treatment vs DMSO treated cells. E BNIP3, c-MYC, HIF-1α protein expression of 2008 and C13 normalized respectively to TOM20 and to β-ACTIN and respective quantification (F). BNIP3, c-MYC, HIF-1α proteins expression of U2OS-U2OS-PT normalized respectively to TOM20 and to calnexin (G) and respective quantification (H). Data are expressed as the ratio of resistant cells to sensitive. Data are the mean ± SEM of 4–5 different experiments; *p < 0.05, **p < 0.01; calculated by a two-tailed unpaired t-test comparing resistant vs sensitive cells. I mRNA expression of BNIP3 gene normalized on β-ACTIN (2008-C13) and calnexin (U2OS and U2OS-PT). The data are expressed as a ratio of resistant cells to sensitive set to 1. *p < 0.05, **p < 0.01, calculated by a two-tailed unpaired t-test comparing resistant vs sensitive cells. J BNIP3 expression in ovarian cancer patients sensitive (pt-S) and resistant (pt-R) to platinum-based chemotherapy (platinum free interval, PFI, if lower than 12months has been defined to classify resistant patients). K BNIP3 expression in another ovarian cancer patients’ group before and after platinum-based chemotherapy (ctr refers to non-treated patient and pt-T to treated patient). The first patient was treated with carboplatin in combination with doxorubicin and presented a higher BNIP3 expression and lower survival (PFI < 12months). The other two patients were treated with carboplatin in combination with taxol and presented lower BNIP3 expression and higher survival (PFI > 12months). L Representative images of ovarian cancer specimens (n = 2) showing low (0–20%) and high (55–100%) staining of TIM23, TOM20 and of BNIP3 in tumor tissue. Black scale bars = 100 μm. Between the two cancer patients treated with platinum-based chemotherapy after surgery, lower TIM23 and TOM20 protein expression was associated with platinum-resistant patient (pt-R), as compared to platinum-sensitive patient (pt-S). M Among the 295 ovarian cancer patients treated with platinum-based therapy (cisplatin, carboplatin, or oxaliplatin after surgery), high BNIP3 protein expression was associated with lower PFS (OV PT-R, ovarian cancer patient resistant to platinum-therapy) compared to patients with low BNIP3 expression (OV PT-S, ovarian cancer patient sensitive to platinum-therapy) (Wilcox-rank test, two-sided, p < 0.05).
Fig. 4
Fig. 4. BNIP3 silencing reduces mitochondrial mass loss.
A 2008-C13 and U2OS-U2OS-PT were transfected with a non-targeting control (NTC, scramble) esiRNA or with an esiRNA targeting BNIP3 (esiBNIP3). BNIP3 protein expression levels were normalized to TOM20; in (B) the respective quantification. Data are the mean ± SEM of 5 different experiments. **p < 0.01, ***p < 0.001, calculated by a two-tailed unpaired t-test comparing esiRNA targeting BNIP3 vs non-targeting control cells. (C) and (E) Effect of 24 h of CDDP (1 µM) and Bafilomycin A1 (100 nM) treatment on mitochondrial proteins expression of 2008-C13 and U2OS-U2OS-PT transfected with non-targeting control (NTC, scramble) esiRNA or with an esiRNA targeting BNIP3 (esiBNIP3), and the respective quantification (D) and (F). The optical density of TOM20, Cyclophilin D and COX IV was normalized to β-ACTIN for ovarian cancer cells and to calnexin for osteosarcoma cells sensitive and resistant. The data are expressed as the ratio of treated cells respect to untreated cells; *p < 0.05, calculated by a two-tailed unpaired t-test comparing esiRNA targeting BNIP3 (esiBNIP3) vs non-targeting control (NTC, scramble) cells. Data are the mean ± SEM of 4–5 different experiments.
Fig. 5
Fig. 5. BNIP3 silencing suppresses mitophagy.
Effect of 24 h of CDDP (25–50 µM) and of overnight of FCCP (10 µM) on mitophagy of 2008-C13 (A) and U2OS-U2OS-PT (C) transfected with non-targeting control (NTC, scramble) esiRNA or with an esiRNA targeting BNIP3 (esiBNIP3). The respective Mitophagy Index and quantification is reported in (B) and (D). Data are the mean ± SEM of 5–6 different experiments. *p < 0.05; calculated by a two-tailed unpaired t-test comparing esiRNA targeting BNIP3 (esiBNIP3) cells vs non-targeting control (NTC, scramble) esiRNA cells; *p < 0.05, ***p < 0.001, calculated by a two-tailed unpaired t-test comparing treated cells vs untreated cells.
Fig. 6
Fig. 6. BNIP3 silencing and pharmacological inhibition of autophagy promotes CDDP sensitivity.
Clonogenic assay of 2008-C13 (A) and U2OS-U2OS-PT (C) cells transfected with a control NTC esiRNA (scramble esiRNA) or esiRNA targeting BNIP3 (esiBNIP3) and treated for 24 h with CDDP (10–50 µM). The respective quantification of normalized surviving factor of the experiment in (AC) is reported in (B) and (D). Data are the mean ± SEM of 4–5 different experiments. *p < 0.05; **p < 0.01; calculated by a two-tailed unpaired t-test comparing esiBNIP3 cells vs NTC esiRNA cells and comparing resistant vs sensitive counterparts. E IC50 of viability curves upon 24 h of CDDP (1–5–10–25–50 µM) of 2008-C13 and of U2OS-U2OS-PT transfected with non-targeting control (NTC, scramble) esiRNA or with an esiRNA targeting BNIP3 (esiBNIP3). Data are the mean ± SEM of 5–6 different experiments. *p < 0.05, calculated by a two-tailed unpaired t-test comparing esiRNA targeting BNIP3 (esiBNIP3) resistant vs sensitive cells and non-targeting control (NTC, scramble) esiRNA resistant vs sensitive cells; *p < 0.05, esiRNA targeting BNIP3 cells vs non-targeting control cells. Clonogenic assay of ovarian cancer cells treated for 72 h with CDDP (0.75–1.5–3.1 µM) in combination with either DMSO, 3 µM PIK-III or 2 µM SAR-405 (F). Quantification of the normalized surviving factor (G) of the experiment shown in (F). Clonogenic assay of osteosarcoma cells treated for 72 h with CDDP (0.75–1.5–3.1 µM) in combination with either DMSO, 3 µM PIK-III or 4 µM SAR-405 (H). Quantification of the normalized surviving factor (I) of the experiment shown in (H). Data are the mean ± SEM of 4–5 different experiments. *p < 0.05; calculated by a two-tailed unpaired t-test comparing combination treatment vs the CDDP treatment.

References

    1. Kelland L. The resurgence of platinum-based cancer chemotherapy. Nat Rev Cancer. 2007;7:573–84. doi: 10.1038/nrc2167. - DOI - PubMed
    1. Bean GR, Ganesan YT, Dong Y, Takeda S, Liu H, Chan PM et al. PUMA and BIM are required for oncogene inactivation-induced apoptosis. Sci Signal. 2013;6. 10.1126/scisignal.2003483. - PMC - PubMed
    1. Galluzzi L, Senovilla L, Vitale I, Michels J, Martins I, Kepp O, et al. Molecular mechanisms of cisplatin resistance. Oncogene. 2012;31:1869–83. doi: 10.1038/onc.2011.384. - DOI - PubMed
    1. Chipuk JE, Kuwana T, Bouchier-Hayes L, Droin NM, Newmeyer DD, Schuler M, et al. Direct activation of bax by p53 mediates mitochondrial membrane permeabilization and apoptosis. Science (80-) 2004;303:1010–4. doi: 10.1126/science.1092734. - DOI - PubMed
    1. Tajeddine N, Galluzzi L, Kepp O, Hangen E, Morselli E, Senovilla L, et al. Hierarchical involvement of Bak, VDAC1 and Bax in cisplatin-induced cell death. Oncogene. 2008;27:4221–32. doi: 10.1038/onc.2008.63. - DOI - PubMed

Publication types

MeSH terms