. 2022 Apr 22;21(1):69.
doi: 10.1186/s12934-022-01790-9.

GC/MS-based 13C metabolic flux analysis resolves the parallel and cyclic photomixotrophic metabolism of Synechocystis sp. PCC 6803 and selected deletion mutants including the Entner-Doudoroff and phosphoketolase pathways

Affiliations

GC/MS-based 13C metabolic flux analysis resolves the parallel and cyclic photomixotrophic metabolism of Synechocystis sp. PCC 6803 and selected deletion mutants including the Entner-Doudoroff and phosphoketolase pathways

Dennis Schulze et al. Microb Cell Fact. .

Abstract

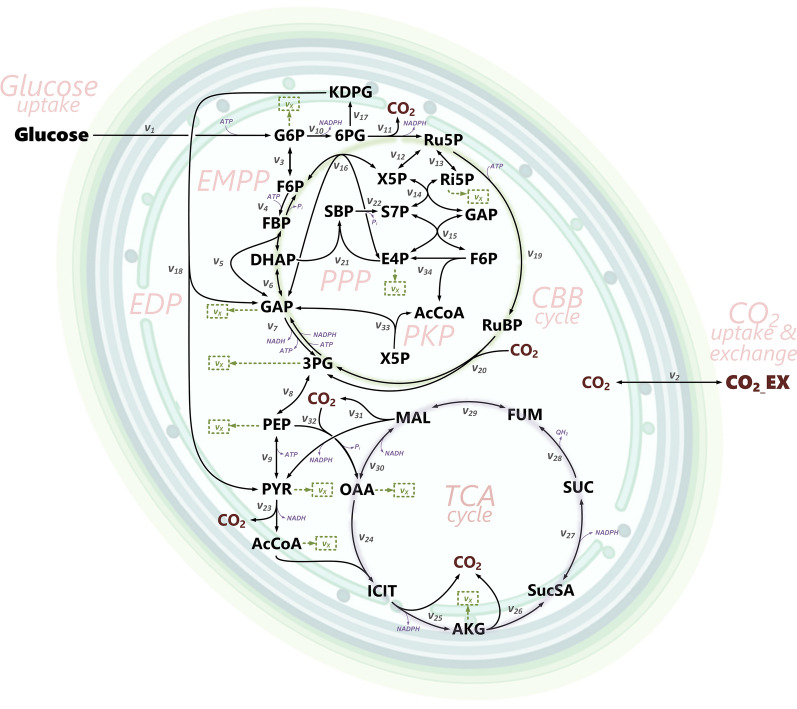
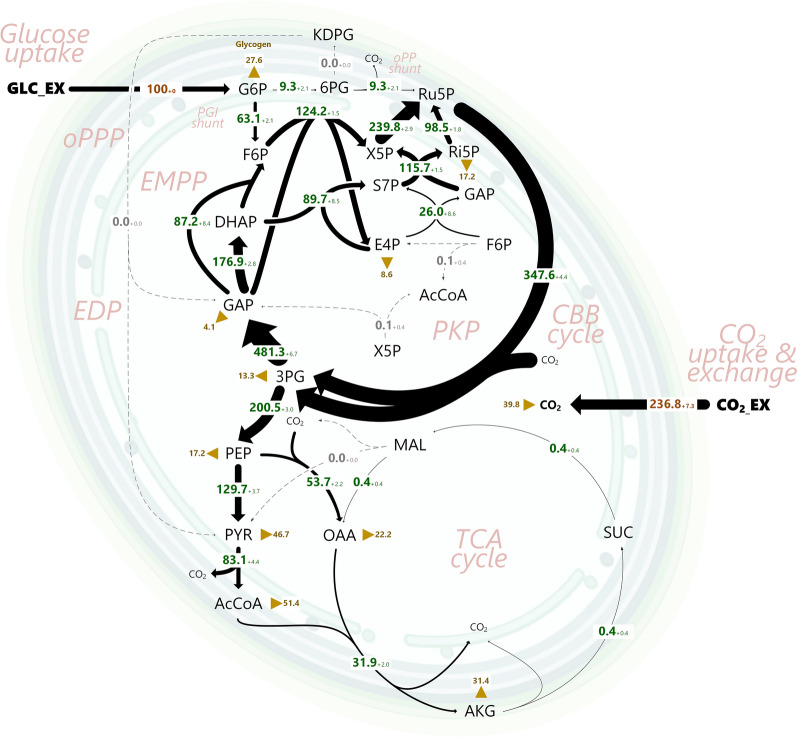
Background: Cyanobacteria receive huge interest as green catalysts. While exploiting energy from sunlight, they co-utilize sugar and CO2. This photomixotrophic mode enables fast growth and high cell densities, opening perspectives for sustainable biomanufacturing. The model cyanobacterium Synechocystis sp. PCC 6803 possesses a complex architecture of glycolytic routes for glucose breakdown that are intertwined with the CO2-fixing Calvin-Benson-Bassham (CBB) cycle. To date, the contribution of these pathways to photomixotrophic metabolism has remained unclear.

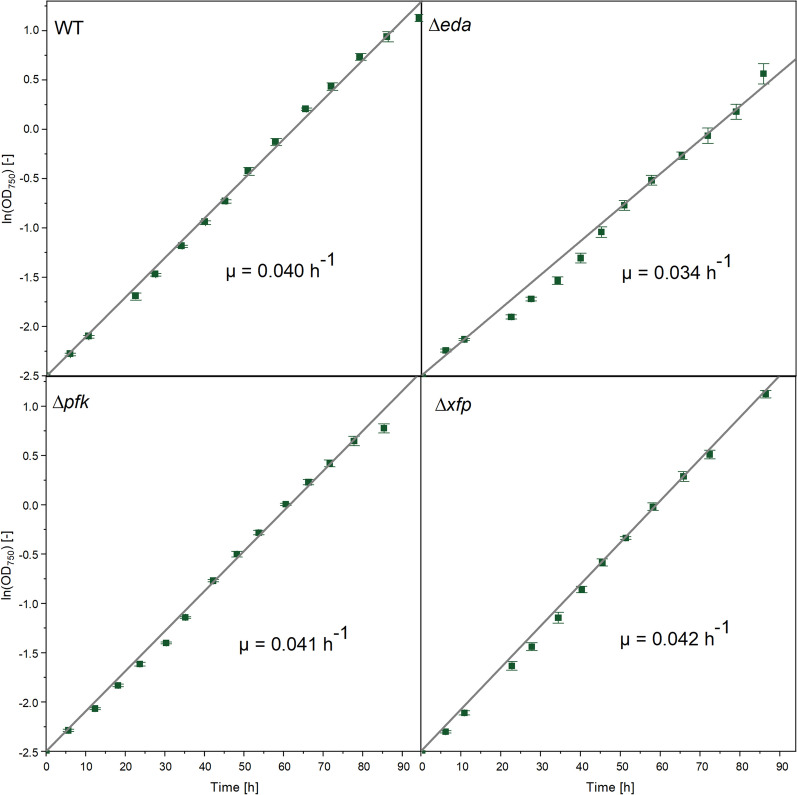
Results: Here, we developed a comprehensive approach for 13C metabolic flux analysis of Synechocystis sp. PCC 6803 during steady state photomixotrophic growth. Under these conditions, the Entner-Doudoroff (ED) and phosphoketolase (PK) pathways were found inactive but the microbe used the phosphoglucoisomerase (PGI) (63.1%) and the oxidative pentose phosphate pathway (OPP) shunts (9.3%) to fuel the CBB cycle. Mutants that lacked the ED pathway, the PK pathway, or phosphofructokinases were not affected in growth under metabolic steady-state. An ED pathway-deficient mutant (Δeda) exhibited an enhanced CBB cycle flux and increased glycogen formation, while the OPP shunt was almost inactive (1.3%). Under fluctuating light, ∆eda showed a growth defect, different to wild type and the other deletion strains.

Conclusions: The developed approach, based on parallel 13C tracer studies with GC-MS analysis of amino acids, sugars, and sugar derivatives, optionally adding NMR data from amino acids, is valuable to study fluxes in photomixotrophic microbes to detail. In photomixotrophic cells, PGI and OPP form glycolytic shunts that merge at switch points and result in synergistic fueling of the CBB cycle for maximized CO2 fixation. However, redirected fluxes in an ED shunt-deficient mutant and the impossibility to delete this shunt in a GAPDH2 knockout mutant, indicate that either minor fluxes (below the resolution limit of 13C flux analysis) might exist that could provide catalytic amounts of regulatory intermediates or alternatively, that EDA possesses additional so far unknown functions. These ideas require further experiments.

Keywords: 13C metabolic flux analysis; CO2; Calvin-Benson-Bassham cycle; Cyanobacteria; Entner-Doudoroff pathway; GC–MS; Glucose; Glycolytic shunt; NMR; Oxidative pentose phosphate pathway; Phosphoketolase pathway; TCA cycle, photomixotrophic growth.


Conflict of interest statement

All authors declare that they have no competing interests.

Figures

Fig. 1
Fig. 1
Carbon core metabolic network of Synechocystis 6803 for the co-utilization of glucose and CO2 under photomixotrophic conditions. The network comprises the Calvin-Bassham-Benson (CBB) cycle, the Emden-Meyerhof-Parnas (EMP) pathway (including the PGI shunt), the Entner-Doudoroff (ED) pathway (including the ED shunt), the oxidative pentose phosphate (OPP) pathway (including the OPP shunt), the phosphoketolase (PK) pathway, the TCA cycle, and anabolic routes. Abbreviations:, glucose 6-phosphate (G6P), fructose 6-phosphate (F6P), dihydroxyacetone phosphate (DHAP), glyceraldehyde 3-phosphate (GAP), 3-phosphoglycerate (3PG), phosphoenolpyruvate (PEP), pyruvate (PYR), acetyl-CoA (AcCoA), isocitrate (ICI), 2-oxoglutarate (2OG), succinate semialdehyde (SucA), succinate (SUC), fumarate (FUM), malate (MAL), oxaloacetate (OAA), 6-phosphogluconate (6PG), 2-keto-3-deoxy-6-phosphogluconate (KDPG), ribose 5-phosphate (Ri5P), ribulose 5-phosphate (Ru5P), xylose 5-phosphate (X5P), sedoheptulose 7-phosphate (S7P), erythrose 4-phosphate (E4P), extracellular carbon dioxide (CO2_EX), intracellular carbon dioxide (CO2). The reaction numbers refer to the biochemical network, used for flux estimation (Additional file 1: Table S9). Anabolic fluxes into biomass (X) are given as vx
Fig. 2
Fig. 2
Photomixotrophic growth of Synechocystis 6803 on glucose with ambient CO2 levels and constant light (35 µE m−2 s−1). The dashed line indicates the cell concentration up to which the cells grew non-limited by light (Additional file 1: Fig. S1). n = 3
Fig. 3
Fig. 3
Experimental design for 13C metabolic flux analysis of photomixotrophic Synechocystis 6803. Different setups using different combinations of 13C tracer substrates and 13C labelling data were analyzed for achievable flux precision and accuracy, assuming a flux scenario with zero flux through the ED and the PK pathway. Here, the key fluxes of upper and lower carbon metabolism, i.e., through the ED, OPP, EMP, and PK pathways, the CBB cycle, and the TCA cycle, are shown. Each setup was evaluated by a Monte-Carlo approach that mimicked 100 repetitions of the corresponding flux study while taking experimental errors into account. The sensitive substrates [1-13C], [3-13C], [6-13C], and [13C6] glucose seemed useful for the following reasons. The combination of [1-13C] glucose and [6-13C] glucose well discriminated the fluxes through the EMP, the PP, and the ED pathway in glucose-grown pseudomonads, revealing a similarly cyclic pathway architecture as cyanobacteria [9]. Metabolization of [3-13C] glucose (based on the underlying carbon transitions) via the ED route should selectively lead to 13C label enrichment at the C1 of pyruvate (and amino acids derived therefrom), providing a sensitive readout, should this pathway be active. The use of [13C6] glucose appeared beneficial, likely because it helped to estimate the relative uptake of 13C sugar versus (non-labelled) CO2, as previously demonstrated for Basfia succiniciproducens, grown on sucrose under high rates of CO2 assimilation [22]. The color indicates flux determinability: green, < 0.1%, yellow < 1%, orange < 10%; and red, > 10%
Fig. 4
Fig. 4
In vivo flux distribution of Synechocystis 6803 during photomixotrophic growth on glucose and CO2 determined by GC–MS based 13C metabolic flux analysis. Fluxes are normalized to the glucose uptake (100%, 0.421 mmol g−1 h−1). The thickness of the arrows denotes the amount of flux. The errors for the fluxes reflect standard deviations, estimated by Monte-Carlo simulation. The anabolic fluxes into biomass are shown as triangles. The complete flux data set is given in Additional file 1: Table S2, where also the 95% confidence intervals from the Monte-Carlo analysis are provided. GLC_ex extracellular glucose; G6P glucose 6-phosphate; F6P fructose 6-phosphate; DHAP dihydroxyacetone phosphate; GAP glyceraldehyde 3-phosphate; 3PG 3-phosphoglycerate; PEP phosphoenolpyruvate; PYR pyruvate; AcCoA acetyl coenzyme A; ICI isocitrate; 2OG 2-oxoglutarate; SucA succinate-semialdehyde; SUC succinate; FUM fumarate; MAL malate; OAA oxaloacetate; 6PG 6-phosphogluconate; KDPG 2-keto-3-deoxy-6-phosphogluconate; Ri5P ribose 5-phosphate; Ru5P ribulose 5-phosphate; X5P xylose 5-phosphate; S7P sedoheptulose 7-phosphate; E4P erythrose 4-phosphate; CO2_EX extracellular carbon dioxide; CO2 intracellular carbon dioxide. The flux estimation yielded an excellent quality of fit for the considered mass isotopomers of amino acids, sugars, and sugar derivatives (Additional file 1: Table S1). The variance-weighted sum of squared residuals (SSR) was 377 and within the expected range (342–434) of the chi-square test at 95% confidence level, confirming also statistical acceptability (Additional file 1: Fig. S8). n = 4
Fig. 5
Fig. 5
In vivo flux distribution of Synechocystis 6803 ∆eda during photomixotrophic growth on glucose and CO2 determined by GC–MS based 13C metabolic flux analysis. Fluxes are normalized to the glucose uptake (100%, 0.429 mmol g−1 h−1). The thickness of the arrows denotes the amount of flux. The errors for the fluxes reflect standard deviations, estimated by Monte-Carlo simulation. The anabolic fluxes into biomass are shown as triangles. The complete flux data set is given in Additional file 1: Table S2, where also the 95% confidence intervals from the Monte-Carlo analysis are provided. The abbreviations for the metabolites are explained in the legend of Fig. 4. The flux estimation yielded an excellent quality of fit for the considered mass isotopomers of amino acids, sugars, and sugar derivatives (Additional file 1: Table S3). The variance-weighted sum of squared residuals (SSR) was 377 and within the expected range (342–434) of the chi-square test at 95% confidence level, confirming also statistical acceptability (Additional file 1: Fig. S8). n = 4
Fig. 6
Fig. 6
Photomixotrophic growth of Synechocystis 6803 wildtype and the single gene deletion mutants ∆eda, ∆pfkAB, and ∆xfp1/xfp2 using glucose as carbon source. The cultures were illuminated using 1-min dark–light cycles. The statistical significance of differences in the specific growth rate was assessed by a t-test, considering a 95% confidence level (p < 0.01, **) and a 90% confidence level (p < 0.05, *). The analysis revealed that ∆eda (µ = 0.0339 ± 0.005 h1, p = 0.003) and ∆xfp1/xfp2 (µ = 0.0423 ± 0.003 h1, p = 0.012) differed significantly from the wild type (µ = 0.0401 ± 0.003 h1), whereas ∆pfkAB did not (µ = 0.0406 ± 0.003 h1, p = 0.178). n = 3

References

    1. Becker J, Wittmann C. From systems biology to metabolically engineered cells-an omics perspective on the development of industrial microbes. Curr Opin Microbiol. 2018;45:180–188. doi: 10.1016/j.mib.2018.06.001. - DOI - PubMed
    1. Sauer U. Metabolic networks in motion: 13C-based flux analysis. Mol Syst Biol. 2006;2:62. doi: 10.1038/msb4100109. - DOI - PMC - PubMed
    1. Kitamura S, Toya Y, Shimizu H. C-13-Metabolic flux analysis reveals effect of phenol on central carbon metabolism in Escherichia coli. Front Microbiol. 2019 doi: 10.3389/fmicb.2019.01010. - DOI - PMC - PubMed
    1. Wittmann C, Weber J, Betiku E, Krömer J, Bohm D, Rinas U. Response of fluxome and metabolome to temperature-induced recombinant protein synthesis in Escherichia coli. J Biotechnol. 2007;132:375–384. doi: 10.1016/j.jbiotec.2007.07.495. - DOI - PubMed
    1. Becker J, Zelder O, Hafner S, Schroder H, Wittmann C. From zero to hero-Design-based systems metabolic engineering of Corynebacterium glutamicum for L-lysine production. Metab Eng. 2011;13:159–168. doi: 10.1016/j.ymben.2011.01.003. - DOI - PubMed

LinkOut - more resources