. 2022 Apr 22;8(1):49.
doi: 10.1038/s41531-022-00315-w.

Antagonistic network signature of motor function in Parkinson's disease revealed by connectome-based predictive modeling

Affiliations

Antagonistic network signature of motor function in Parkinson's disease revealed by connectome-based predictive modeling

Xuyang Wang et al. NPJ Parkinsons Dis. .

Abstract

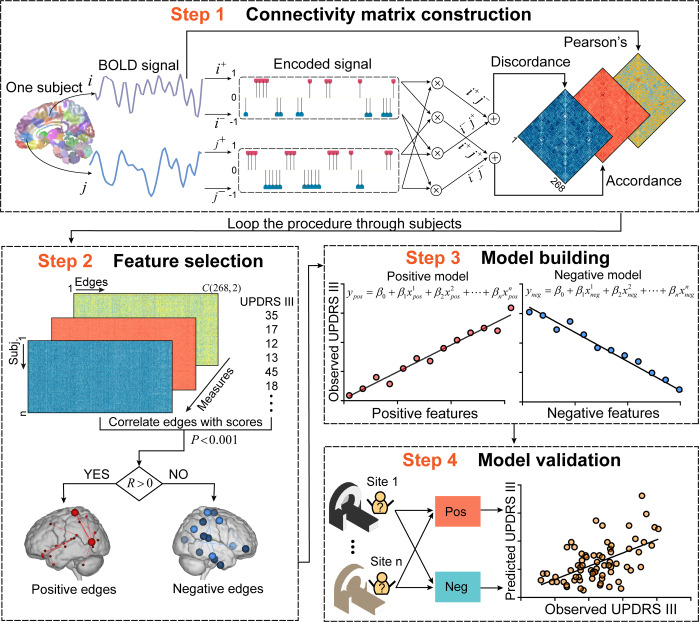
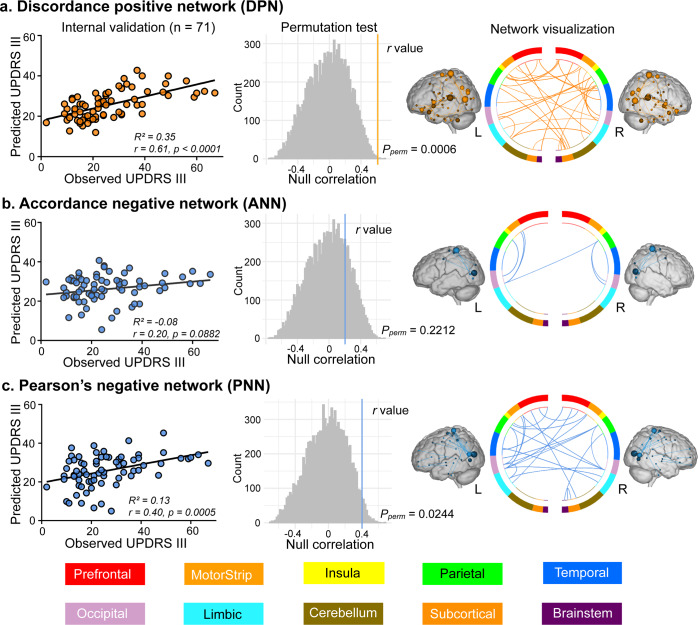
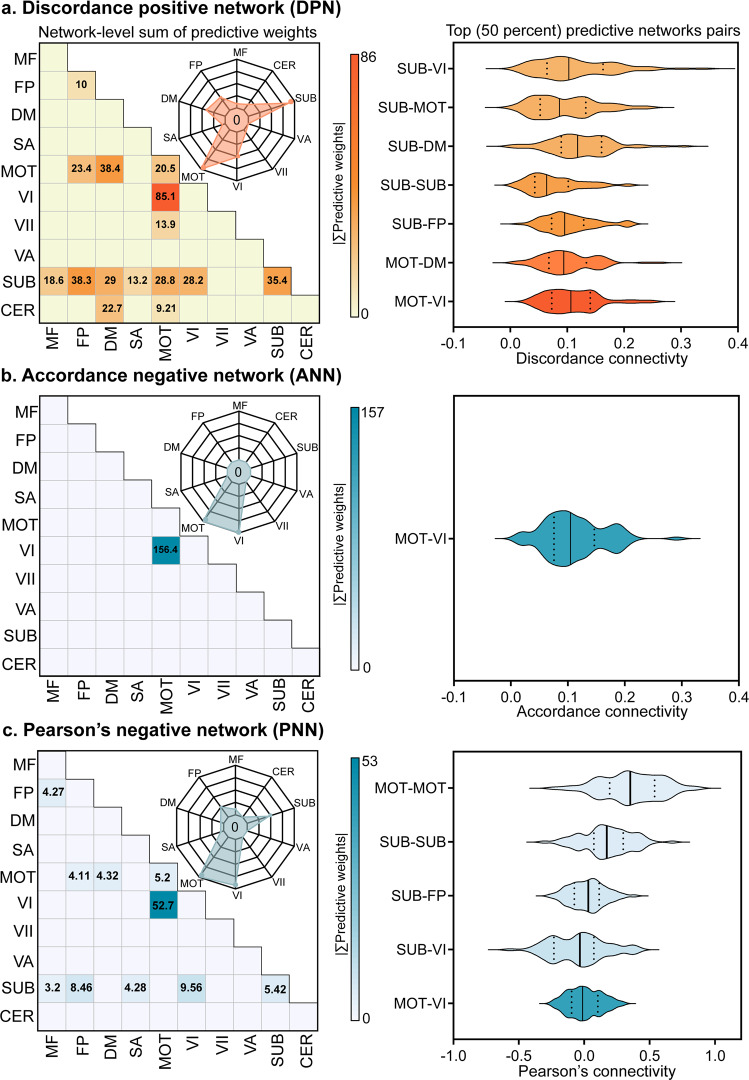
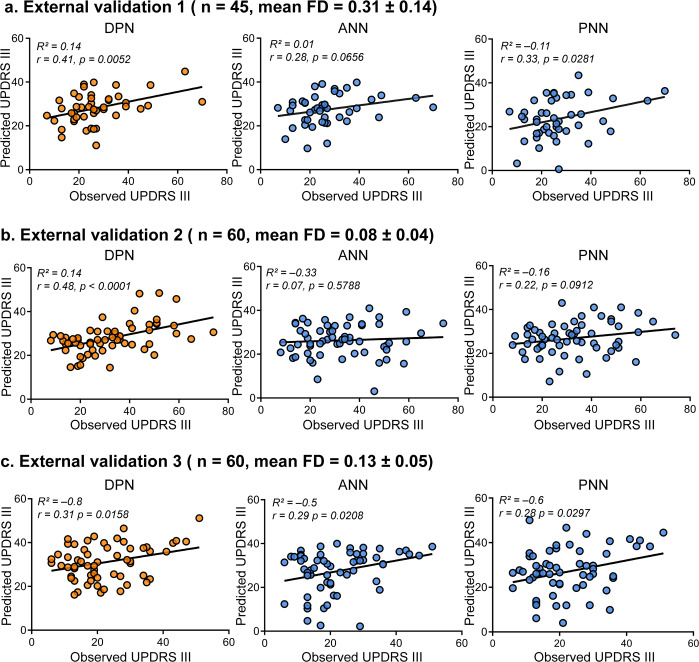
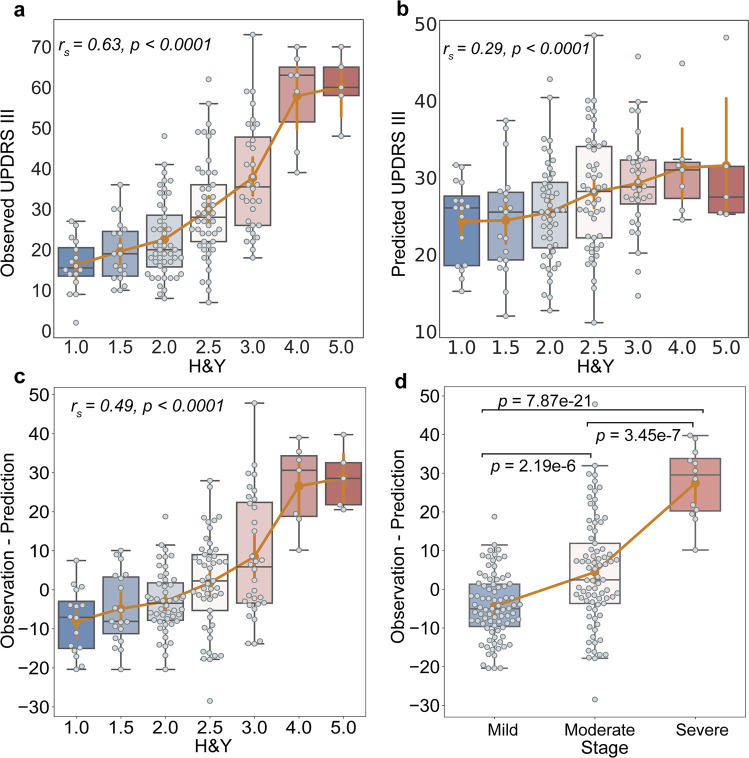
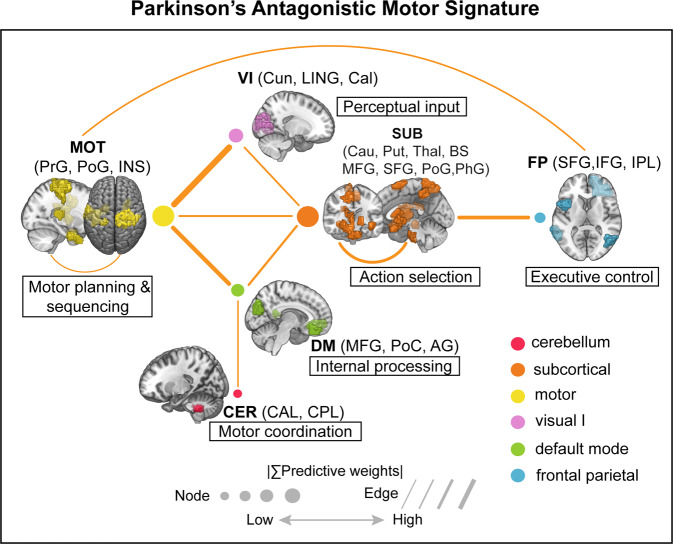
Motor impairment is a core clinical feature of Parkinson's disease (PD). Although the decoupled brain connectivity has been widely reported in previous neuroimaging studies, how the functional connectome is involved in motor dysfunction has not been well elucidated in PD patients. Here we developed a distributed brain signature by predicting clinical motor scores of PD patients across multicenter datasets (total n = 236). We decomposed the Pearson's correlation into accordance and discordance via a temporal discrete procedure, which can capture coupling and anti-coupling respectively. Using different profiles of functional connectivity, we trained candidate predictive models and tested them on independent and heterogeneous PD samples. We showed that the antagonistic model measured by discordance had the best sensitivity and generalizability in all validations and it was dubbed as Parkinson's antagonistic motor signature (PAMS). The PAMS was dominated by the subcortical, somatomotor, visual, cerebellum, default-mode, and frontoparietal networks, and the motor-visual stream accounted for the most part of predictive weights among network pairs. Additional stage-specific analysis showed that the predicted scores generated from the antagonistic model tended to be higher than the observed scores in the early course of PD, indicating that the functional signature may vary more sensitively with the neurodegenerative process than clinical behaviors. Together, these findings suggest that motor dysfunction of PD is represented as antagonistic interactions within multi-level brain systems. The signature shows great potential in the early motor evaluation and developing new therapeutic approaches for PD in the clinical realm.


Conflict of interest statement

The authors declare no competing interests.

Figures

Fig. 1
Fig. 1. Schematic representation of connectome-based predictive modeling for motor dysfunction in PD.
Step 1: We extracted the mean signal from regions of interest (ROIs), then positive extreme values of the z-transformed time series were encoded as 1, whereas negative extreme values were encoded as -1. The encoded series was subsequently sent into two layers. The first layer (dot product layer) produced sub-states of connectivity for each pair of ROIs, and the last layer (accumulation layer) quantified the synchronized interactions (accordance) and antagonistic interactions (discordance). Connectivity matrices based on three FC measures were constructed for each subject. Step 2: We looped step 1 through subjects and created a group-level matrix (m×n, where m represents subjects, and n represents FC). The significantly motor-correlated edges (P < 0.001) were selected and divided into positive features (R > 0) and negative features (R < 0). Step 3: We trained a multivariate linear regression model using partial least squares based on selected features. Step 4: Apply models to novel subjects in independent samples to assess the generalizability. Brain images in this figure were obtained from the Bioimage Suite (https://bioimagesuiteweb.github.io/webapp/), which is an open source software package. UPDRS III Unified Parkinson’s Disease Rating Scale motor examination; FC functional connectivity.
Fig. 2
Fig. 2. Internal validation of predictive models and network visualization.
Using the LOOCV method to obtain predicted scores, the evaluation of predictive performance was based on (1) the Pearson’s correlation between observed UPDRS III scores and predicted UPDRS III scores, and (2) the predicted R2 (the left column). Permutation test was performed by comparing true r values (colored vertical lines in the middle column) with a null distribution of r values, yielding a significant effect for DPN and PNN models. Edges with significant (P < 0.001) and robust (exceed 95% of iterations) dependency on UPDRS III scores were reserved in the predictive networks (the right column). The network visualization was completed with Bioimage Suite (https://bioimagesuiteweb.github.io/webapp/). The color bars at the bottom of this figure represent which brain parcellation the nodes are assigned to on the basis of a lobe scheme. L left hemisphere, R right hemisphere, LOOCV leave-one-out cross-validation, DPN discordance positive network, PNN Pearson’s negative network.
Fig. 3
Fig. 3. Network level representation of predictive weights and the distribution of top 50% network pairs on the discovery cohort (n = 71).
268 ROIs were divided into 10 canonical functional networks, and we characterized the whole predictive networks (ac) from the edge-level (within- and between- networks, shown as heatmaps) and node-level (shown as radar charts) by aggregating all related weights. The first half of the predictive network pairs were selected according to the sorted weights, and the mean strength of network interactions were shown in the second column. The black solid lines in the violin plots represents for the median value, and the dash lines represents for the upper and lower quartiles in each network pair. Networks acronyms: MF Medial Frontal, FP Frontal Parietal, DM Default Mode, MOT Motor, VI Visual I, VII Visual II, VA Visual Association, SUB Subcortical, CER Cerebellum.
Fig. 4
Fig. 4. External validations of three candidate models.
We showed the sensitivity and generalizability on three independent datasets. a External validation 1 (Study 2, n = 45) is based on a sample of the same center as Study 1, and participants have higher head movements (mean FD > 0.2 mm, translation > 3 mm, or rotation > 3°). b External validation 2 (Study 3, n = 60) is based on another center with a different scanner, and participants were recruited under the same head motion inclusion criteria as Study 1. c External validation 3 (Study 4, n = 60) was performed on the cohort from PPMI, which covered seven sites and the white race. The plots showed the relationships between the observed scores versus predicted scores. Each dot represents an individual participant, and the line represents the regression line. Combining all external validations, DPN showed better generalizability than the other two models. PPMI Parkinson’s Progression Markers Initiative.
Fig. 5
Fig. 5. Stage-specific analysis of the DPN predictive model.
Using the samples showed a relatively accurate performance (R2 > 0), Study 1 to 3 (n = 176) were aggregated to evaluate the predictive performance of DPN along with PD progression. a We delineated the observed UPDRS III scores at different H&Y stages, and found a significant correlation (Spearman’s r = 0.63, P < 0.0001). b We showed the relationship between predicted UPDRS III scores and H&Y stages (Spearman’s r = 0.29, P < 0.0001). c We correlated the residuals between observations and predictions with H&Y stages (Spearman’s r = 0.49, P < 0.0001). d Based on the H&Y, patients were divided into mild (H&Y = 1, 1.5, 2; n = 83), moderate (H&Y = 2.5, 3; n = 81), and severe (H&Y = 4, 5; n = 12) groups. Significant differences in predicted deviations were revealed between each pair of groups using two-sample t-tests. Boxplots indicate the median (the black line in the box), upper and lower quartiles (box), 1.5 times interquartile range (whiskers) and outliers (circles) for the values in each stage. DPN discordance predictive model.
Fig. 6
Fig. 6. Parkinson’s antagonistic motor signature (PAMS): a functional connectivity biomarker of motor dysfunction in PD.
We sketched the top ten predictive network pairs in the final model. The widths of dots and lines are proportional to the predictive weights. We also showed the function of each network according to previous literature and the corresponding anatomical regions. PrG precentral gyrus, PoG postcentral gyrus, INS insula gyrus, Cun cuneus, LING lingual gyrus, Cal calcarine, Cau caudate; Put putamen, Thal thalamus; BS brainstem, MFG medial frontal gyrus, SFG superior frontal gyrus, PhG parahippocampa gyrus; IFG inferior frontal gyrus, IPL inferior parietal lobe, PoC posterior cingulate, AG angular gyrus, CAL cerebellum anterior lobe, CPL cerebellum posterior lobe.

References

    1. Willis AW. Parkinson disease in the elderly adult. Mo. Med. 2013;110:406–410. - PMC - PubMed
    1. Tessitore A, Cirillo M, De Micco R. Functional connectivity signatures of Parkinson’s disease. J. Parkinsons Dis. 2019;9:637–652. doi: 10.3233/JPD-191592. - DOI - PMC - PubMed
    1. McGregor MM, Nelson AB. Circuit mechanisms of Parkinson’s disease. Neuron. 2019;101:1042–1056. doi: 10.1016/j.neuron.2019.03.004. - DOI - PubMed
    1. Tysnes OB, Storstein A. Epidemiology of Parkinson's disease. J. Neural Transm. 2017;124:901–905. doi: 10.1007/s00702-017-1686-y. - DOI - PubMed
    1. Palop JJ, Chin J, Mucke L. A network dysfunction perspective on neurodegenerative diseases. Nature. 2006;443:768–773. doi: 10.1038/nature05289. - DOI - PubMed