. 2022 Apr 22;7(1):46.
doi: 10.1038/s41541-022-00469-x.

A DNA vaccine targeting VEE virus delivered by needle-free jet-injection protects macaques against aerosol challenge

Affiliations

A DNA vaccine targeting VEE virus delivered by needle-free jet-injection protects macaques against aerosol challenge

John J Suschak et al. NPJ Vaccines. .

Abstract

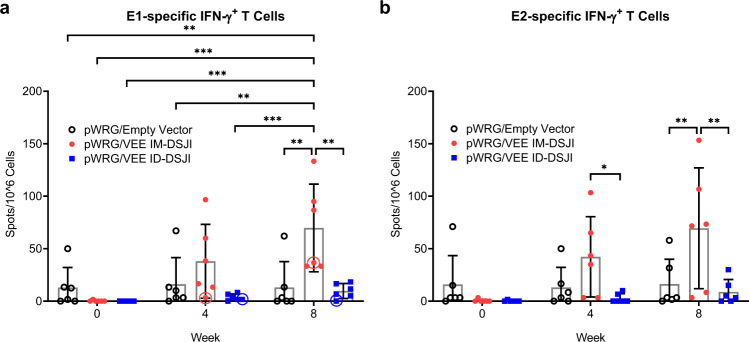
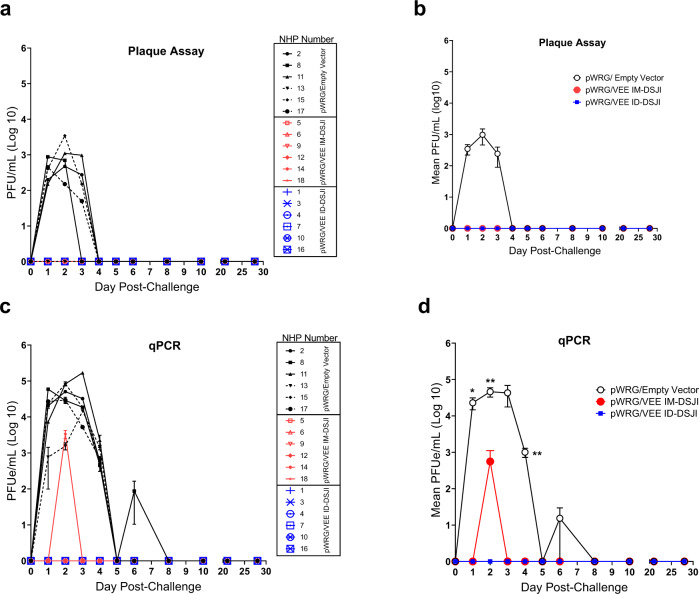
We have previously shown that DNA vaccines expressing codon optimized alphavirus envelope glycoprotein genes protect both mice and nonhuman primates from viral challenge when delivered by particle-mediated epidermal delivery (PMED) or intramuscular (IM) electroporation (EP). Another technology with fewer logistical drawbacks is disposable syringe jet injection (DSJI) devices developed by PharmaJet, Inc. These needle-free jet injection systems are spring-powered and capable of delivering vaccines either IM or into the dermis (ID). Here, we evaluated the immunogenicity of our Venezuelan equine encephalitis virus (VEEV) DNA vaccine delivered by either the IM- or ID-DSJI devices in nonhuman primates. The protective efficacy was assessed following aerosol challenge. We found that a prime and single boost by either the IM or ID route resulted in humoral and cellular immune responses that provided significant protection against disease and viremia. Although the ID route utilized one-fifth the DNA dose used in the IM route of vaccination, and the measured humoral and cellular immune responses trended lower, the level of protection was high and performed as well as the IM route for several clinical endpoints.


Conflict of interest statement

Opinions, interpretations, conclusions, and recommendations are those of the authors and are not necessarily endorsed by the U.S. Department of the Army, the U.S. Department of Defense, or the U.S. Department of Health and Human Services or of the institutions and companies affiliated with the authors. Erin Spiegel is an employee of PharmaJet, Inc. The author acknowledges that there is a potential conflict of interest inherent in the publication of this manuscript and asserts that an effort to reduce or eliminate that conflict has been made where possible. There are no other conflicts of interest to report.

Figures

Fig. 1
Fig. 1. pWRG/VEE delivered by IM- or ID-DSJI elicits anti-VEEV GP binding antibodies.
a Temporal anti-VEEV GP IgG responses and (b) total IgG antibody titers in vaccinated nonhuman primates (NHPs). c Total IgA antibody titers 4 weeks after the second vaccination in vaccinated NHPs. The shaded areas represent the assay limit based on the lowest sera dilution tested. Arrows represent vaccination time points. Data represent the group geometric mean ± geometric SD. *p < 0.05, **p < 0.01. d Correlation analysis of the VEEV ELISA and PsVNA80. For panels (a) and (c), p values were determined by one-way ANOVA with Tukey’s multiple comparison test. For panel (b), p values were determined by two-way ANOVA with Tukey’s multiple comparison. For panel (d), linear regression and 95% CI is shown as line and dotted lines, respectively. Circled symbols represent individual NHPs in VEEV-vaccinated groups that developed fever (defined as >3 SD above baseline lasting for more than 2 h) following VEEV aerosol challenge.
Fig. 2
Fig. 2. pWRG/VEE delivered by IM- or ID-DSJI elicits anti-VEEV neutralizing antibodies.
a Temporal anti-VEEV GP neutralizing antibody responses and (b) PsVNA neutralizing antibody titers in vaccinated nonhuman primates. c PRNT titers 4 weeks post 2nd vaccination. The shaded areas represent the assay limit based on the lowest dilution of serum tested. Arrows represent vaccination time points. Data represent the group geometric mean ± geometric SD. *p < 0.05, **p < 0.01. d Correlation analysis to evaluate the relation of the VEEV PsVNA80 and PRNT80. For panels (a) and (c), p values were determined by one-way ANOVA with Tukey’s multiple comparison test. For panel (b), p values were determined by two-way ANOVA with Tukey’s multiple comparison. For panel (d), linear regression and 95% CI is shown as line and dotted lines, respectively. Circled symbols represent individual animals in VEEV-vaccinated groups that developed a fever >3 °C above baseline after VEEV aerosol challenge.
Fig. 3
Fig. 3. pWRG/VEE delivered by IM-, but not ID-, DSJI elicits anti anti-VEEV GP cellular immunity.
a VEEV E1- and (b) E2-specific IFN-γ+ T cells. Peripheral blood mononuclear cells were stimulated with pools of 15-mer, overlapping peptides spanning the VEEV E1 or E2 proteins. Data represent the group mean ± SD. Statistical analysis was performed using a two-way ANOVA with Tukey’s multiple comparison test. *p < 0.05, **p < 0.01, ***p < 0.001. Circled symbols represent individual animals in VEEV-vaccinated groups that developed a fever >3 °C above baseline after VEEV aerosol challenge.
Fig. 4
Fig. 4. Viremia following VEEV aerosol exposure.
a Individual nonhuman primate (NHP) serum VEEV plaque assay data. b Group plaque assay data. Mean ± SEM are plotted for each group. c Individual NHP RT-qPCR determination of VEEV viral load present in plasma. Viral load is expressed in equivalent (e) PFU/mL and was interpolated from a standard curve generated from RNA extracted from challenge virus. Samples were analyzed in technical triplicate. Error bars reflect standard deviation. The lower limit of quantitation for the qPCR assay is 100 PFU/mL. d Group qPCR data. Mean ± SEM are plotted. For panel (d), p values were determined by one-way ANOVA with Tukey’s multiple comparison test. *p < 0.05, **p < 0.01.
Fig. 5
Fig. 5. Fever responses in nonhuman primates (NHPs) following VEEV aerosol challenge.
Fever-hours for individual animals in the (a) pWRG/empty vector (b) pWRG/VEE IM-DSJI and (c) pWRG/VEE ID-DSJI groups. Fever-hours are the sum of the significant temperature elevations (defined as >3 SD above baseline) in a 24 h period. The group means ± SEM and area under the curve (AUC) are presented in (d) and (e), respectively. f Maximum temperature elevation above baseline in a 24 h period. Data are presented as mean ± SEM. p values were determined using a one-way ANOVA with Tukey’s multiple comparison test. *p < 0.05, ****p < 0.0001.
Fig. 6
Fig. 6. VEEV DNA vaccine delivered by IM- or ID-DSJI prevents decline in white blood cell populations following aerosol challenge.
Percent change from baseline in (a) white blood cells, (b) circulating lymphocyte populations, (c) circulating monocyte populations, (d) circulating neutrophil populations, (e) circulating eosinophil populations, and (f) circulating basophil populations following aerosol VEEV exposure. The dashed line represents the baseline values as determined by the average of 3 independent measurements on days −7, −5, and −3 relative to challenge. Data represent the group mean ± SEM. Group and pairwise statistical analysis is presented in Supplementary Table 3.
Fig. 7
Fig. 7. Encephalitis typical of VEEV infection in nonhuman primates (NHPs).
Representative pathology in the cerebrum of NHPs challenged with VEEV by aerosol. a NHP #17 (pWRG/empty vector), Cerebrum. Virchow-Robbins spaces (arrows) surrounding blood vessels (BV) in the brain. This area is moderately expanded by inflammatory cells. H&E 20X. b NHP #8 (pWRG/empty vector), Cerebrum. Virchow-Robbin space is moderately expanded by lymphocytes and macrophages (boxed area), or nonsuppurative inflammation. This is a key feature in differentiating VEEV from Eastern and Western equine encephalitis viruses (EEEV and WEEV, respectively). H&E 20X. c NHP #18 (IM-DSJI), Cerebrum. There are degenerating and dead neurons (arrows) characterized by shrunken cells that are angular and hypereosinophilic (dark red/pink) with condensed nuclei. There is satellitosis (rectangle) characterized by glial cells surrounding the neuron, like satellites. Spongiosis (oval) is present in this section as the neuropil is lost or edematous giving the look of a sponge. H&E 40X.

References

    1. Tsai TF. Arboviral infections in the United States. Infect. Dis. Clin. North Am. 1991;5:73–102. doi: 10.1016/S0891-5520(20)30389-5. - DOI - PubMed
    1. Steele, K., et al. in Medical Aspects of Biological Warfare (ed Dembek Z. F.) Ch. Alphavirus encephalitis, 241-270 (Office of the Surgeon General, Department of the Army and US Army Medical Department Center and School, 2007).
    1. Rusnak JM, Dupuy LC, Niemuth NA, Glenn AM, Ward LA. Comparison of aerosol- and percutaneous-acquired venezuelan equine encephalitis in humans and nonhuman primates for suitability in predicting clinical efficacy under the animal rule. Comp. Med. 2018;68:380–395. doi: 10.30802/AALAS-CM-18-000027. - DOI - PMC - PubMed
    1. Franz DR, et al. Clinical recognition and management of patients exposed to biological warfare agents. Clin. Lab. Med. 2001;21:435–473. doi: 10.1016/S0272-2712(18)30018-0. - DOI - PubMed
    1. Hanson RP, et al. Arbovirus infections of laboratory workers. Extent of problem emphasizes the need for more effective measures to reduce hazards. Science. 1967;158:1283–1286. doi: 10.1126/science.158.3806.1283. - DOI - PubMed