. 2022 Oct 4;121(19):3753-3764.
doi: 10.1016/j.bpj.2022.04.023. Epub 2022 Apr 21.

Conformational transitions in BTG1 antiproliferative protein and their modulation by disease mutants

Affiliations

Conformational transitions in BTG1 antiproliferative protein and their modulation by disease mutants

Ekaterina Kots et al. Biophys J. .

Abstract

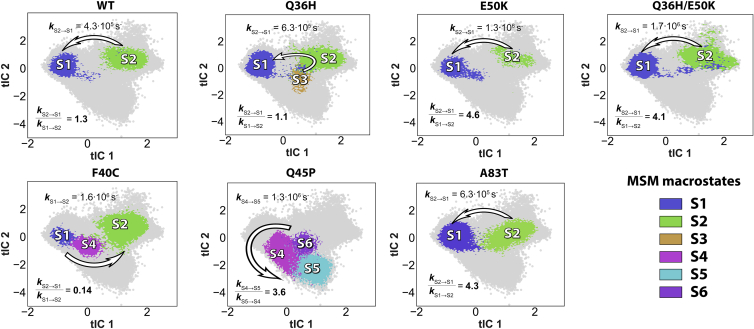
B cell translocation gene 1 (BTG1) protein belongs to the BTG/transducer of ERBB2 (TOB) family of antiproliferative proteins whose members regulate various key cellular processes such as cell cycle progression, apoptosis, and differentiation. Somatic missense mutations in BTG1 are found in ∼70% of a particularly malignant and disseminated subtype of diffuse large B cell lymphoma (DLBCL). Antiproliferative activity of BTG1 has been linked to its ability to associate with transcriptional cofactors and various enzymes. However, molecular mechanisms underlying these functional interactions and how the disease-linked mutations in BTG1 affect these mechanisms are currently unknown. To start filling these knowledge gaps, here, using atomistic molecular dynamics (MD) simulations, we explored structural, dynamic, and kinetic characteristics of BTG1 protein, and studied how various DLBCL mutations affect these characteristics. We focused on the protein region formed by α2 and α4 helices, as this interface has been reported not only to serve as a binding hotspot for several cellular partners but also to harbor sites for the majority of known DLBCL mutations. Markov state modeling analysis of extensive MD simulations revealed that the α2-α4 interface in the wild-type (WT) BTG1 undergoes conformational transitions between closed and open metastable states. Importantly, we show that some of the mutations in this region that are observed in DLBCL, such as Q36H, F40C, Q45P, E50K (in α2), and A83T and A84E (in α4), either overstabilize one of these two metastable states or give rise to new conformations in which these helices are distorted (i.e., kinked or unfolded). Based on these results, we conclude that the rapid interconversion between the closed and open conformations of the α2-α4 interface is an essential component of the BTG1 functional dynamics that can prime the protein for functional associations with its binding partners. Disruption of the native dynamic equilibrium by DLBCL mutants leads to the ensemble of conformations in BTG1 that are unlikely structurally and/or kinetically to enable productive functional interactions with the binding proteins.


Conflict of interest statement

Declaration of interests A.M. has research funding from Janssen Pharmaceuticals, Sanofi, Epizyme, and Daiichi Sankyo; has consulted for Epizyme and Constellation; and is on the advisory board for KDAC Pharma.

Figures

Figure 1
Figure 1
Structural features of BTG1 protein. (A) Sequence of human BTG1 from Uniprot P62324 with important functional regions highlighted. (B) Sites of selected clinical mutations along the α2/α4 interface of BTG1. Colormap shows the frequency of clinical mutations observed in each residue of the protein. (C) Selected residues constituting the hydrophobic core of the protein behind the α2/α4 interface. (D) Zoomed view from above of the hydrophobic core behind α2/α4. The LxxLL regions in H2 and H4 are highlighted in orange in (C) and (D). To see this figure in color, go online.
Figure 2
Figure 2
Kinetic model of conformational transitions in the WT and mutant BTG1 constructs. MSM analysis carried out on the 2D tICA spaces of the individual BTG1 systems (see Fig. S3) identified locations of kinetically distinct macrostates on the tICA surface (color coded; the gray cloud represents the entire 2D tICA conformational space sampled by all the protein systems within the entire MD dataset). The arrows show the direction of the reactive fluxes evaluated with the transition path theory (TPT) approach, as described in Methods. To see this figure in color, go online.
Figure 3
Figure 3
Metastable states identified from the MSM analysis and their structural properties. (A) The populations of the kinetic states of the MSM. Each color corresponds to a particular state (see the legend). (B) The violin plot of distributions of the Ca distance between the residues Q36 and I87 (top), and of the distribution of the dihedral angle between α2 and α4 (bottom). (C) The representative conformations of each of the identified kinetic metastable states with two of the CVs highlighted. Top row: the average values of the Cα distance between residues Q36 and I87. Bottom row: the average values of the dihedral angle between α2 and α4. To see this figure in color, go online.
Figure 4
Figure 4
Key molecular interactions stabilizing various metastable states. Distribution of hydrophobic and polar interactions behind the α2/α4 interface in the identified MSM macrostates from all the BTG1 variants studied, including L26-F40 (A), L26-I87 (B), Q/H36-I87 (C), E46-R86 (D), and Q36-F40 (E). The apolar interaction between a pair of residues (for A, B, and E) was assumed if the minimum distance between any heavy sidechain atoms was no longer than 5 Å. The cutoff radius for the polar interactions (for C and D) was set to 3.5 Å. (F) Structural representation of the hydrophobic core in S1 (left) and S2 (right) metastable states. To see this figure in color, go online.
Figure 5
Figure 5
Effects of mutations at Q36 position on the interactions along the H2/H4 interface. (A) The extent of hydrophobic interactions behind the α2/α4 interface, including F40-L26, I87-L26, and Q/H36-F40, quantified as a fraction of MD trajectory frames the residue pairs formed apolar interactions. The latter was defined as formed if the minimum distance between any heavy sidechain atoms was no longer than 5 Å. (B) Fraction of MD trajectory frames in which polar interactions between the sidechain of a residue in 36 position and the sidechains (T32, S33) or the backbone (I87) of its neighbors. The cutoff radius for the polar interactions was set to 3.5 Å. (C) Visual snapshots showing the polar interactions formed between Q/H/N36, T32, S33, and L87 residues in BTG1 WT, Q36H, and Q36N, respectively. To see this figure in color, go online.
Figure 6
Figure 6
The effects of A83T, A84E, and Q45P BTG1 DLBCL mutations on the structure of the H2/H4 region. (A) The formation of the hydrogen bond (H-bond) between the mutated T83 and the backbone of L79 (left), the minimum distance between heavy atoms of T83 sidechain and Q36-E50 residues of H2 (center), and aligned conformations of the WT (pale green) and A83T (royal blue) S1 states (right). (B) Fraction of trajectory frames from BTG1A84E MD simulations a residue in the 78–87 segment is in the helical (deep purple) or coil (light blue) secondary structure conformation (left); selected frames from MD simulations of A84E representing unfolded conformation of H4 helix (right). (C) Violin plot showing distributions of the backbone dihedrals of the residues neighboring Q45P from MD simulations of BTG1Q45P system (left). The horizontal lines represent the mean values (solid lines) and their standard deviations (dashed lines) of the φ (hot pink) and ψ (gray) peptide dihedrals in α helix; representative conformations of the S4, S5, and S6 states from MD simulations of Q45P BTG1 system aligned to α2 (right). To see this figure in color, go online.

References

    1. Rouault J.P., Rimokh R., et al. Magaud J. Btg1, a member of a new family of antiproliferative genes. Embo J. 1992;11:1663–1670. doi: 10.1002/j.1460-2075.1992.tb05213.x. - DOI - PMC - PubMed
    1. Winkler G.S. The mammalian anti-proliferative BTG/Tob protein family. J. Cell Physiol. 2010;222:66–72. doi: 10.1002/jcp.21919. - DOI - PubMed
    1. Yuniati L., Scheijen B., et al. van Leeuwen F.N. Tumor suppressors BTG1 and BTG2: beyond growth control. J. Cell Physiol. 2019;234:5379–5389. doi: 10.1002/jcp.27407. - DOI - PMC - PubMed
    1. Kanda M., Oya H., et al. Kodera Y. Diversity of clinical implication of B-cell translocation gene 1 expression by histopathologic and anatomic subtypes of gastric cancer. Dig. Dis Sci. 2015;60:1256–1264. doi: 10.1007/s10620-014-3477-8. - DOI - PubMed
    1. Kanda M., Sugimoto H., et al. Kodera Y. B-cell translocation gene 1 serves as a novel prognostic indicator of hepatocellular carcinoma. Int. J. Oncol. 2015;46:641–648. doi: 10.3892/ijo.2014.2762. - DOI - PubMed

Publication types