. 2022 Apr 22;5(8):e202101209.
doi: 10.26508/lsa.202101209. Print 2022 Aug.

Adipose tissue-specific ablation of Ces1d causes metabolic dysregulation in mice

Affiliations

Adipose tissue-specific ablation of Ces1d causes metabolic dysregulation in mice

Gang Li et al. Life Sci Alliance. .

Abstract

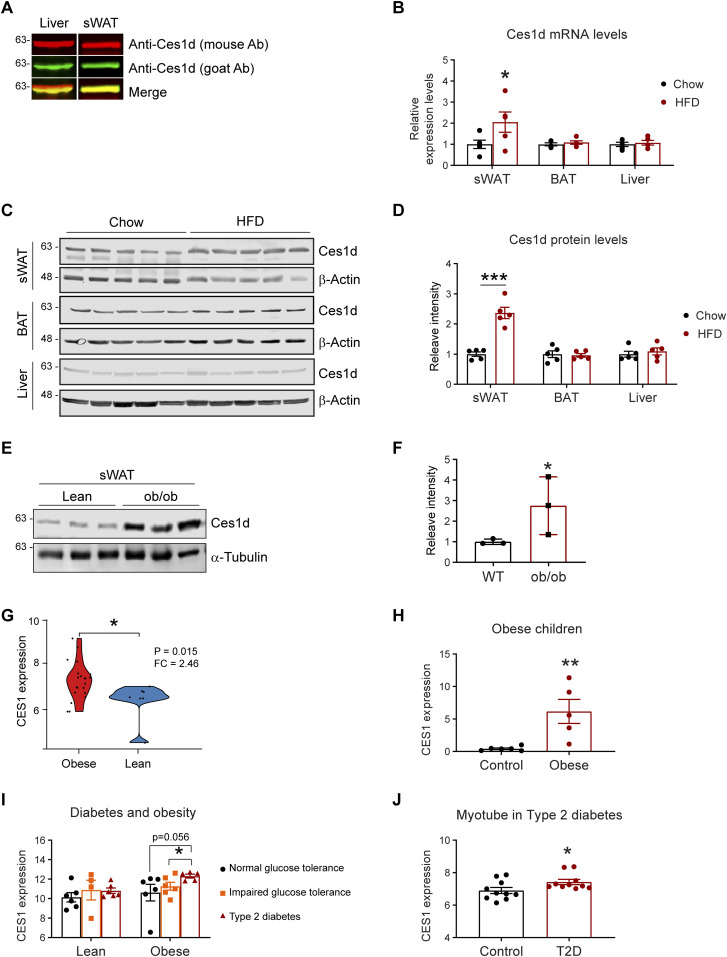
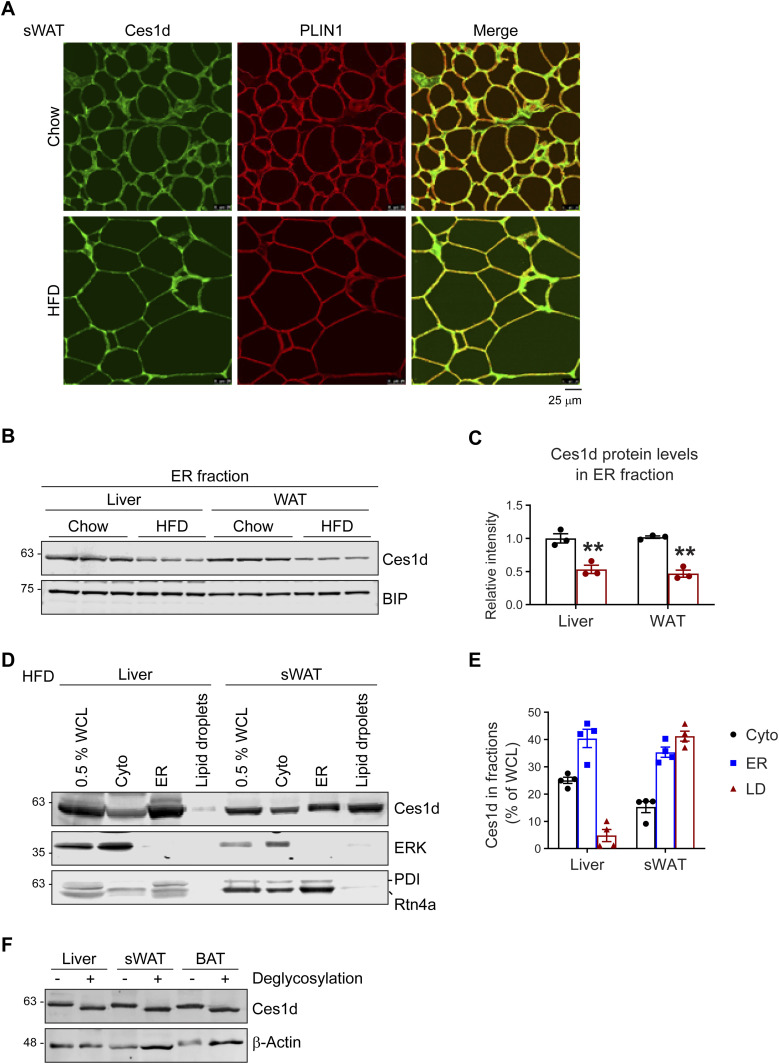
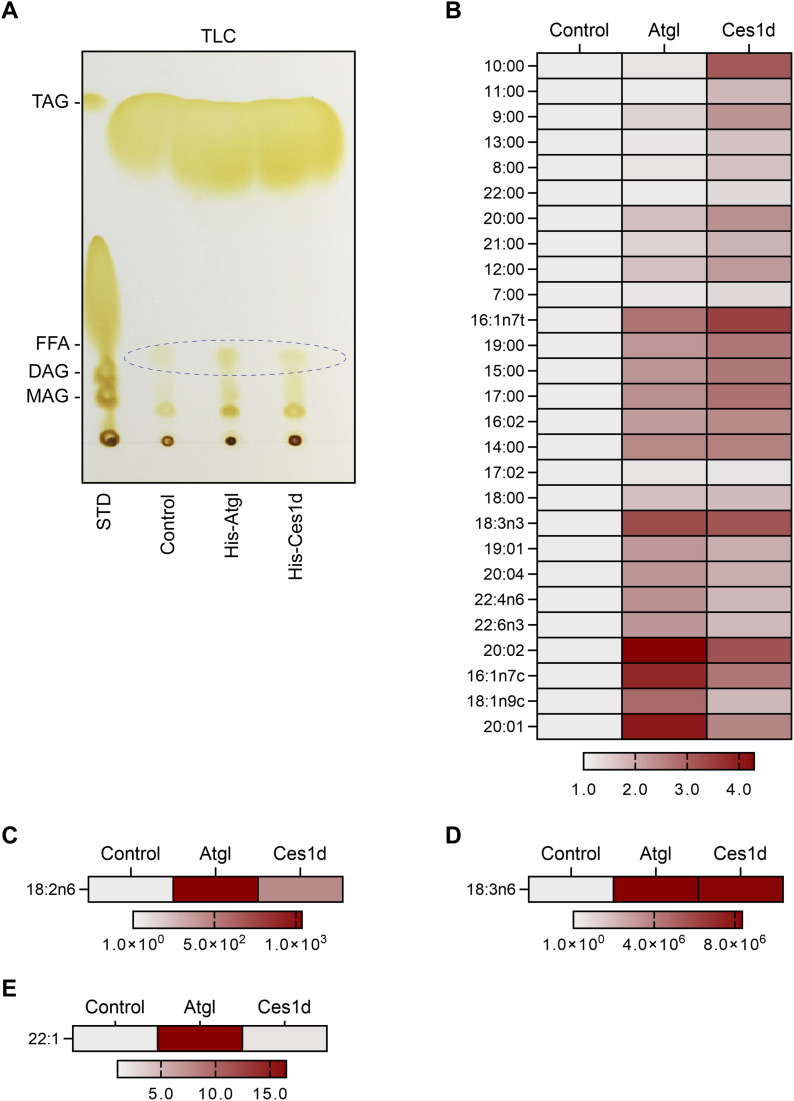
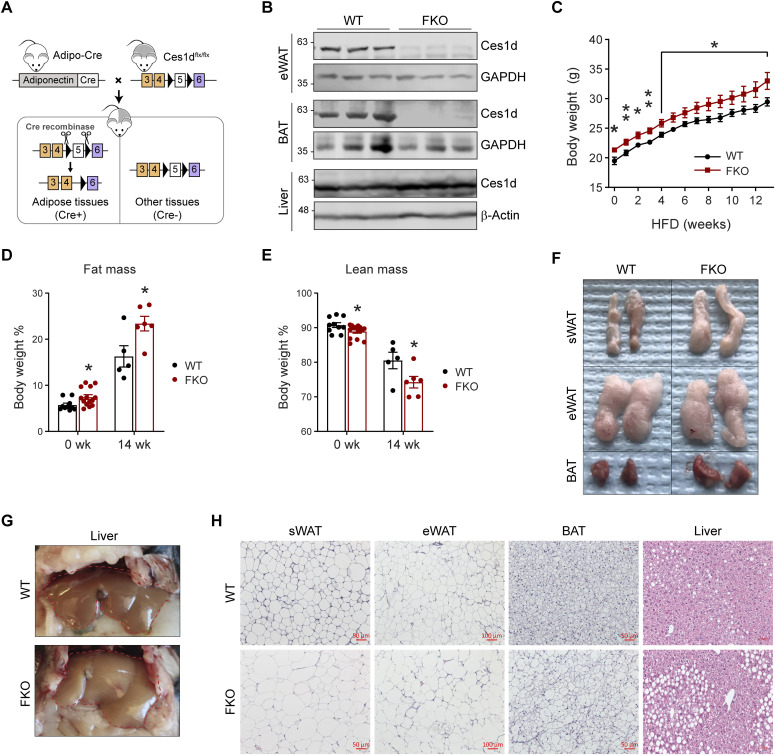
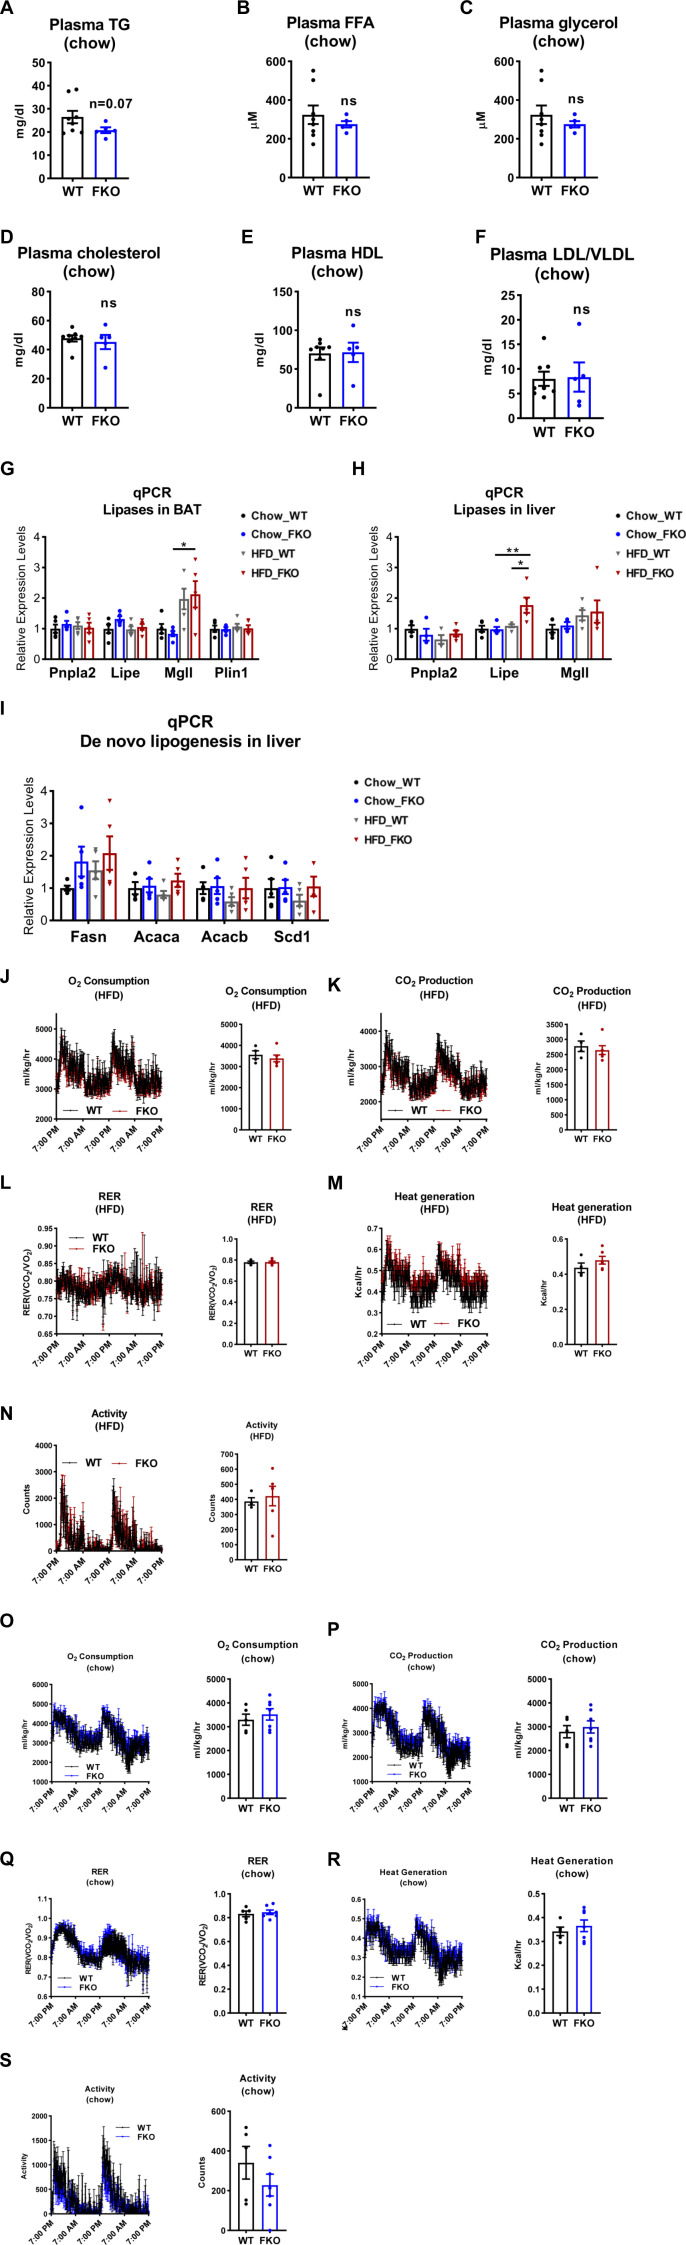
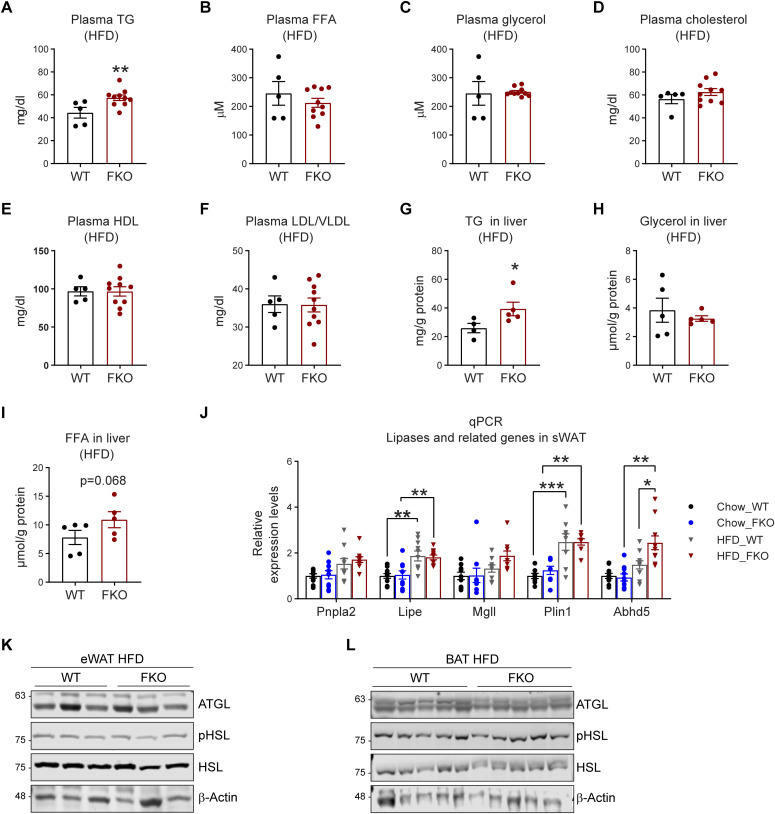
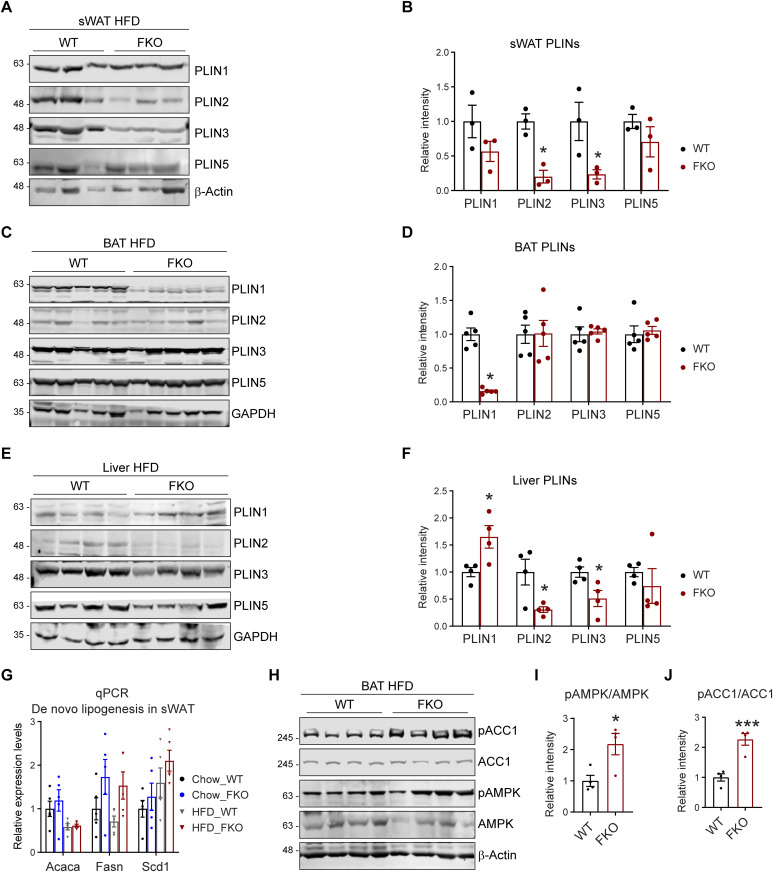
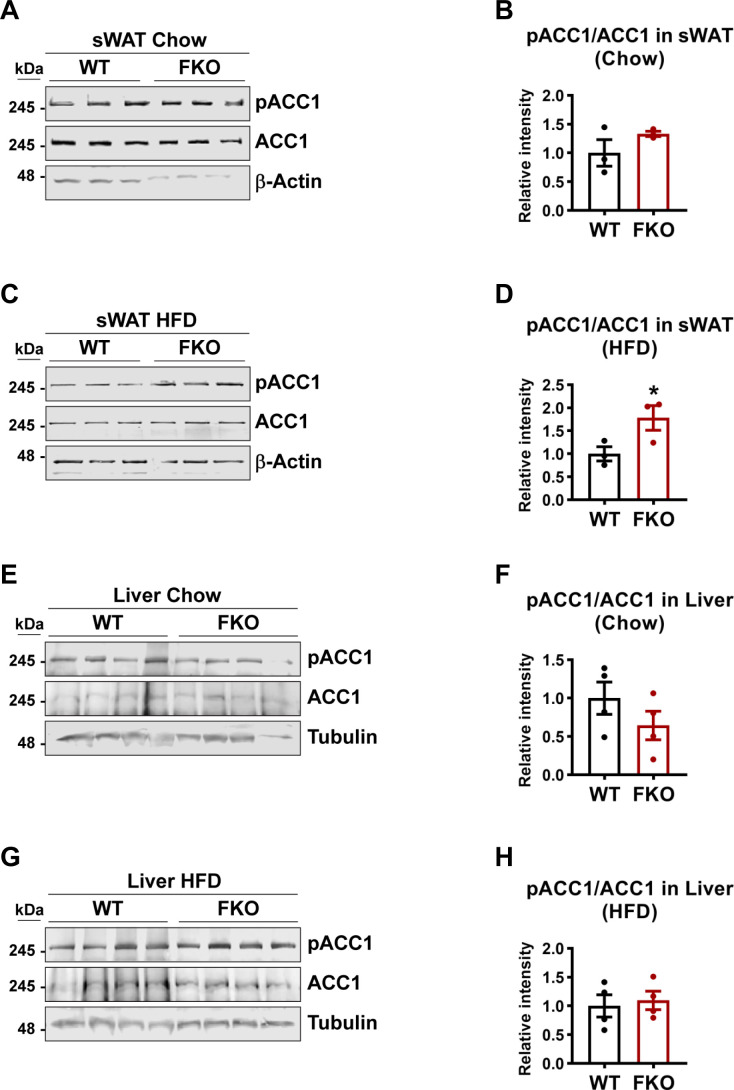
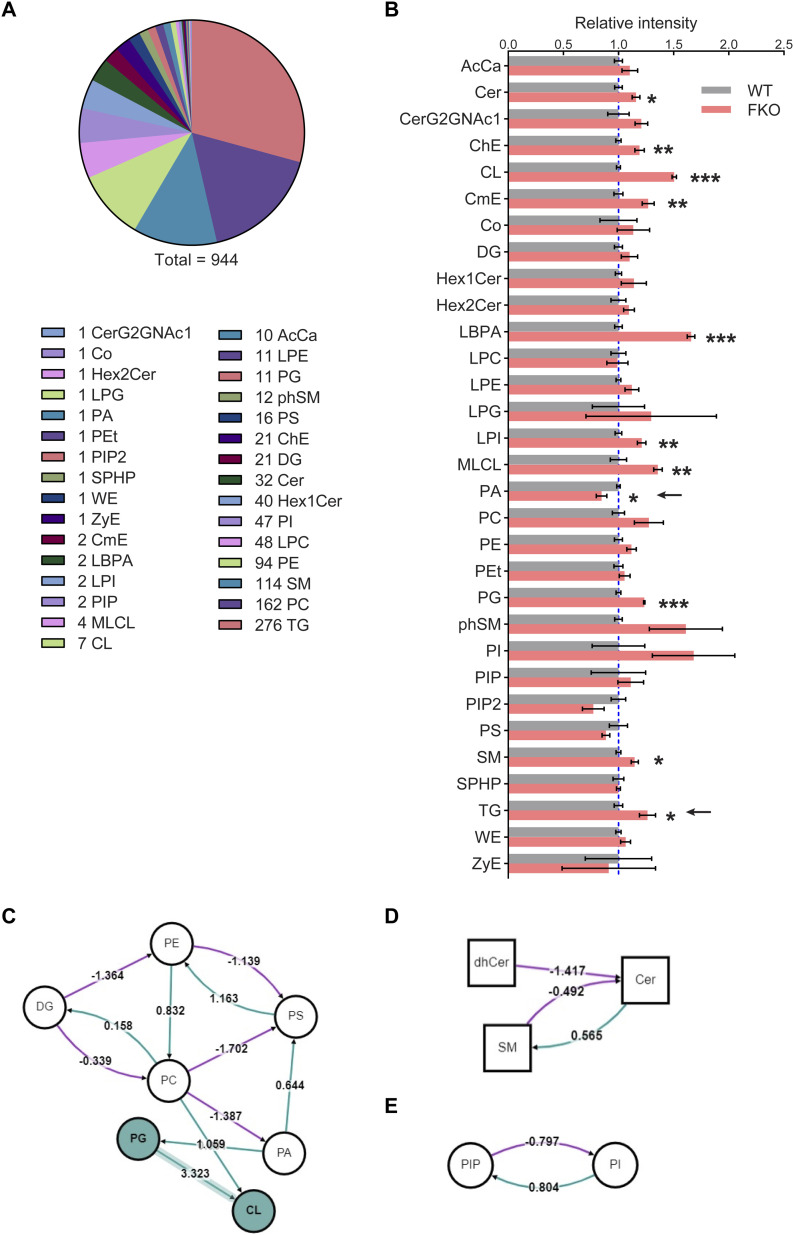
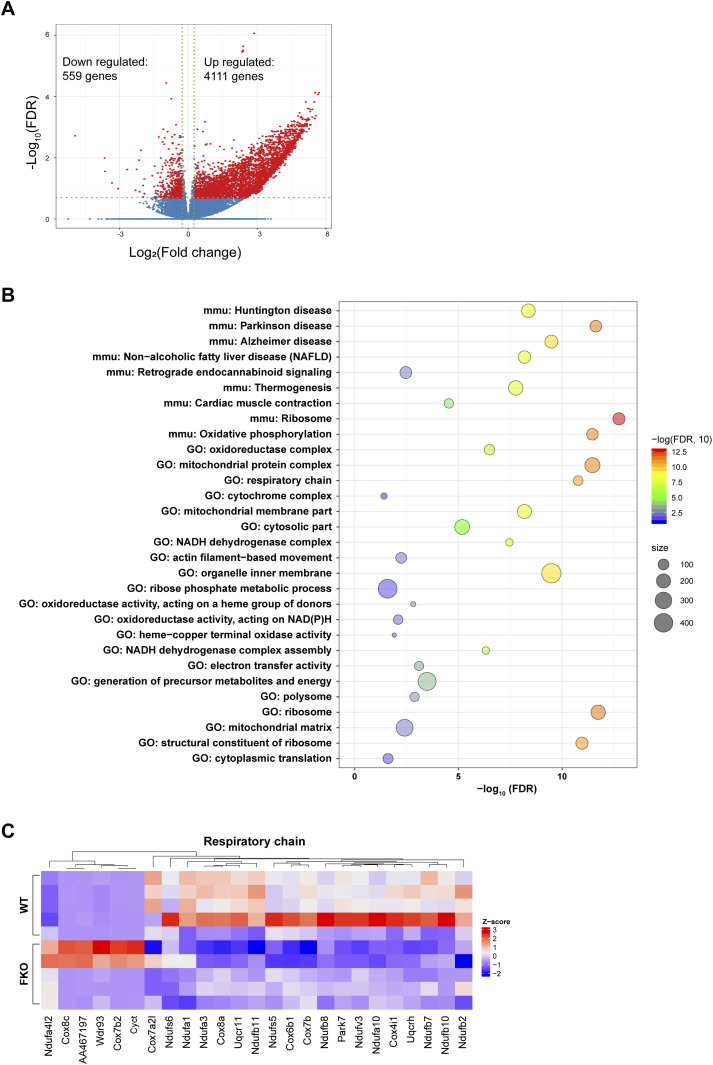
Carboxylesterase 1d (Ces1d) is a crucial enzyme with a wide range of activities in multiple tissues. It has been reported to localize predominantly in ER. Here, we found that Ces1d levels are significantly increased in obese patients with type 2 diabetes. Intriguingly, a high level of Ces1d translocates onto lipid droplets where it digests the lipids to produce a unique set of fatty acids. We further revealed that adipose tissue-specific Ces1d knock-out (FKO) mice gained more body weight with increased fat mass during a high fat-diet challenge. The FKO mice exhibited impaired glucose and lipid metabolism and developed exacerbated liver steatosis. Mechanistically, deficiency of Ces1d induced abnormally large lipid droplet deposition in the adipocytes, causing ectopic accumulation of triglycerides in other peripheral tissues. Furthermore, loss of Ces1d diminished the circulating free fatty acids serving as signaling molecules to trigger the epigenetic regulations of energy metabolism via lipid-sensing transcriptional factors, such as HNF4α. The metabolic disorders induced an unhealthy microenvironment in the metabolically active tissues, ultimately leading to systemic insulin resistance.


Conflict of interest statement

The authors declare that they have no conflict of interest.

Figures

Figure 1.
Figure 1.. The levels of Ces1d increase in adipose tissues during obesity.
(A) Western blotting (WB) analysis of Ces1d in 50 μg proteins of the tissue lysates collected from the liver and subcutaneous white adipose tissue (sWAT) of the C57BL/6J wild-type (WT) mice using mouse α-Ces1d antibody (red) and goat α-Ces1d antibody (green). (B) Comparison of the mRNA levels of Ces1d by qPCR in the samples of sWAT, brown adipose tissue (BAT), and liver collected from WT mice fed by regular chow or high fat diet (HFD) for 14 wk (n = 5 per group, each point represents a biology replicate, representative of three repeats). Data are represented as mean ± SEM, t test, *P < 0.05. (C) WB analysis of Ces1d in the lysates from the sWAT from WT mice fed by regular chow or HFD for 14 wk. β-Actin was used as loading controls (n = 5 per group, representative of three repeats). (D) Quantification of the band intensity for Ces1d in (c) by ImageJ (n = 5 per group, each point represents a biology replicate). Data are represented as mean ± SEM, t test, ***P < 0.001. (E) WB analysis of Ces1d in the lysates from the sWAT from ob/ob mice fed by regular chow for 14 wk. α-Tubulin was used as loading controls (n = 3 per group, representative of three repeats). (F) Quantification of the band intensity for Ces1d in (c) by ImageJ (n = 3 per group, each point represents a biology replicate). Data are represented as mean ± SEM, t test, *P < 0.05. (G) The CES1 expression levels in the adipose tissues from morbidly obese patients or controls. The data was obtained from the Gene Expression Omnibus database (GDS3679). n = 7–21 per group. (H) The CES1 expression levels in adipose tissues from the obese and normal-weight prepubertal children (GDS3688). n = 5∼6 per group. (I) The CES1 expression levels in adipose tissues from the lean or obese subjects with normal, impaired glucose tolerance, or type 2 diabetes (GDS3961). n = 4–6 per group. (J) The CES1 expression levels in the myotube cell lines established from type 2 diabetes (T2D) or control subjects (GDS3681). n = 10 per group. Source data are available for this figure.
Figure 2.
Figure 2.. Ces1d localizes on both ER and lipid droplets in adipose tissue.
(A) Co-immunofluorescence (Co-IF) staining with α-Ces1d (green) and α-Perilipin-1 (PLIN1, red) (lipid droplet marker protein) antibodies on the sWAT from WT mice fed by regular chow or HFD (representative of six fields, experiments were repeated for three times). Scale bars: 25 μm. (B) WB analysis of Ces1d in the ER fractions isolated from the liver and WAT from WT mice fed by regular chow or HFD. BIP was used as the loading control for the ER fraction (n = 3 per group, representative of three repeats). (B, C) Quantification of the band intensity for Ces1d in (B) (n = 3 per group, each point represents a biology replicate). Data are represented as mean ± SEM, t test, **P < 0.01. (D) WB analysis of Ces1d in different cell fractions, including whole cell lysates (WCL), cytoplasm (Cyto), ER, and lipid droplets of the liver and sWAT from the wild-type mice. ERK was used as the loading control for cytosolic proteins, whereas PDI and Rtn4a were used as the loading controls for the ER proteins. 0.5% of the total WCL, 1% of the Cyto, ER, and lipid droplets extracts were loaded (representative of three repeats). (D, E) Quantification of the band intensity for Ces1d in (D) (n = 4 per group, each point represents a biology replicate). Data are represented as mean ± SEM. (F) WB analysis of Ces1d in the lysates from the liver, sWAT, and BAT from WT mice. The samples were pretreated with de-glycosylation enzymes to remove both O- and N-glycans before the analysis.
Figure 3.
Figure 3.. Ces1d hydrolyzes lipid droplets isolated from adipose tissue of WT mice and produce unique free fatty acids (FFAs).
(A) TLC of the products of the neutral lipids hydrolyzed by His-Atgl or His-Ces1d. The FFAs are circulated in the panel. The neutral lipids isolated from adipose tissue of WT mice were mixed with His-Atgl or His-Ces1d proteins that were purified from 293T cells. The mixtures were rotated at 37°C for 1 h. STD, standards of lipids; TAG, triacylglycerol; FFA, free fatty acids; DAG, diacylglycerol; MAG, monoacylglycerol. Loadings were normalized to the same quantity of biomass. (A, B, C, D, E) The categories of the FFAs that were identified by LC-MS/MS from the fatty acid fractions as indicated by ellipse in (A). The intensities of each fatty acid were normalized to the control group. Source data are available for this figure.
Figure 4.
Figure 4.. Adipose tissue–specific Ces1d knockout (FKO) mice gain more body weights with larger fat masses and fatty liver.
(A) Schematic representation of adipocyte-specific Ces1d knockout (Adipo-Cre;Ces1dflx/flx) mouse model. (B) WB analysis for Ces1d in the lysates from epididymal WAT (eWAT), BAT, and liver of the FKO and their littermate control WT mice. GAPDH was used as the loading control for eWAT and BAT, whereas β-actin for liver. (n = 3 per group, representative of three repeats). (C) Body weights of the WT and FKO mice during a 14-wk HFD feeding (n = 5 in WT group and n = 10 in FKO group, each point represents a biology replicate, representative of three repeats). Data are represented as mean ± SEM, t test, *P < 0.05, **P < 0.01. (D, E) Fat mass (D) and lean mass (E) of the WT and FKO mice with or without HFD feeding (n = 5–14, each point represents a biology replicate, representative of three repeats). Data are represented as mean ± SEM, t test, *P < 0.05. (F) Images of biopsies of the sWAT, eWAT, and BAT from WT and FKO mice after 14-wk HFD feeding (representative of five mice per group). (G) Images of biopsies of the liver from WT and FKO mice after 14-wk HFD feeding (representative of five mice per group). (H) H & E staining for the sWAT, eWAT, BAT, and liver from WT and FKO mice after 14-wk HFD feeding (representative of five fields of the samples from five mice per group). Scale bars: 50, 100 μm in eWAT. Source data are available for this figure.
Figure S1.
Figure S1.. Comparison of the parameters of lipid metabolism and energy expenditure between the WT and FKO mice.
(A, B, C, D, E, F) The levels of TAG (A), FFA (B), glycerol (C), cholesterol (D), HDL (E), and LDL/VLDL (F) in the plasma of WT and FKO mice fed on regular chow (n = 8 in WT group and n = 5 in FKO group, each point represents a biology replicate, representative of three repeats). Data are represented as mean ± SEM, t test. (G) qPCR analysis for the mRNA levels of lipases and related genes including Pnpla2, Lipe, Mgll, and Plin1 in the BAT of WT and FKO mice fed on regular chow or HFD (n = 5 per group, each point represents a biology replicate, representative of three repeats). Data are represented as mean ± SEM, one-way ANOVA, *P < 0.05. (H) qPCR analysis for the mRNA levels of lipases including Pnpla2, Lipe, and Mgll in the liver from WT and FKO mice fed on regular chow or HFD (n = 5 per group, each point represents a biology replicate, representative of three repeats). Data are represented as mean ± SEM, one-way ANOVA, *P < 0.05, **P < 0.01. (I) qPCR analysis for the mRNA levels of De novo lipogenesis genes including Fasn, Acaca, Acacb, and Scd1 in the liver from WT and FKO mice fed on regular chow or HFD (n = 5 per group, each point represents a biology replicate, representative of three repeats). Data are represented as mean ± SEM, one-way ANOVA. (J, K, L, M, N) Metabolic cage studies by indirect calorimetric measurements on the energy expenditure of the WT and FKO mice under HFD feeding. (n = 5 per group). Data are represented as mean ± SEM, one-way ANOVA. (O, P, Q, R, S) Metabolic cage studies indirect calorimetric measurements on the energy expenditure of the WT and FKO mice under regular chow feeding. (n = 5 per group). Data are represented as mean ± SEM, one-way ANOVA.
Figure 5.
Figure 5.. Deficiency of Ces1d in adipose tissue impairs lipid homeostasis.
(A, B, C, D, E, F) The levels of triglyceride (TG) (A), free fatty acid (FFA) (B), glycerol (C), cholesterol (D), high-density lipoproteins (HDL) (E), and low-density lipoproteins and very low-density lipoproteins (LDL/VLDL) (F) in the plasma of WT and FKO mice after 14-wk HFD feeding (n = 5 in WT group and n = 10 in FKO group, each point represents a biology replicate, representative of three repeats). Data are represented as mean ± SEM, t test, **P < 0.01. (G, H, I) The levels of TG (G), FFA (H), and glycerol (I) in the liver of WT and FKO mice after 14-wk HFD feeding (n = 5 in WT group and n = 4 in FKO group, each point represents a biology replicate). Data are represented as mean ± SEM, t test, *P < 0.05. (J) qPCR analysis for the mRNA levels of lipases and related genes including Pnpla2, Lipe, Mgll, Plin1, and Abhd5 in the sWAT of WT and FKO mice fed on regular chow or HFD (n = 5 per group, each point represents a biology replicate, representative of three repeats). Data are represented as mean ± SEM, one-way ANOVA, *P < 0.05, **P < 0.01, ***P < 0.001. (K) WB analysis of ATGL, pHSL, and HSL in the lysates from the eWAT of WT and FKO mice fed by HFD. β-Actin was used as loading control (n = 3 per group, representative of three repeats). (L) WB analysis of ATGL, pHSL, and HSL in the lysates from the BAT of WT and FKO mice fed by HFD. β-Actin was used as loading control (n = 5 per group, representative of three repeats). Source data are available for this figure.
Figure 6.
Figure 6.. Deficiency of Ces1d in adipose tissue affects the dynamics of lipid droplets.
(A) WB analysis of Perilipins (PLINs) including PLIN1, PLIN2, PLIN3, and PLIN5 in the lysates from the sWAT of WT and FKO mice fed on HFD. β-Actin was used as loading control (n = 3 per group; representative of three repeats). (A, B) Quantification of the band intensity in (A) (n = 3 per group, each point represents a biology replicate). Data are represented as mean ± SEM, t test, *P < 0.05. (C) WB analysis of PLIN1, PLIN2, PLIN3, and PLIN5 in the lysates from the liver of WT and FKO mice fed on HFD. GAPDH was used as loading control (n = 4 per group, representative of three repeats). (C, D) Quantification of the band intensity in (C) (n = 4 per group, each point represents a biology replicate). Data are represented as mean ± SEM, t test, *P < 0.05. (E) WB analysis of PLIN1, PLIN2, PLIN3, and PLIN5 in the lysates from the BAT of WT and FKO mice fed on HFD. GAPDH was used as loading control. (n = 5 per group, representative of three repeats). (E, F) Quantification of the band intensity in (E) (n = 5 per group, each point represents a biology replicate). Data are represented as mean ± SEM, t test, *P < 0.05. (G) qPCR analysis for the mRNA levels of de novo lipogenesis related genes including Acaca, Fasn, and Scd1 in the sWAT from WT and FKO mice fed on regular chow or HFD (n = 5 in each group, each point represents a biology replicate, representative of three repeats). Data are represented as mean ± SEM, one-way ANOVA. (H) WB analysis of pACC1, ACC1, pAMPK, and AMPK in the lysates from the BAT of WT and FKO mice fed on HFD. β-Actin was used as the loading control (n = 4 per groups, representative of three repeats). (H, I, J) Quantification of the band intensity for pACC1/ACC1 ratio (I) and pAMPK/AMPK ratio (J) in (H) by ImageJ software (n = 4 per group, each point represents a biology replicate). Data are represented as mean ± SEM, t test, *P < 0.05, ***P < 0.001.
Figure S2.
Figure S2.. WB analysis of pACC1 and ACC1 in the lysates from the metabolic tissues of WT and FKO mice.
(A) WB analysis of pACC1 and ACC1 in the lysates from the sWAT of WT and FKO mice fed on regular chow. Actin was used as loading control (n = 3 per group, representative of three repeats). (A, B) Quantification of the band intensity of pACC1/ACC1 ratio in (A) (n = 3 per group, each point represents a biology replicate). Data are represented as mean ± SEM, t test. (C) WB analysis of pACC1 and ACC1 in the lysates from the sWAT of WT and FKO mice fed on HFD. Actin was used as loading control (n = 3 per group, representative of three repeats). (C, D) Quantification of the band intensity of pACC1/ACC1 ratio in (C) (n = 3 each point represents a biology replicate). Data are represented as mean ± SEM, t test, *P < 0.05. (E) WB analysis of pACC1 and ACC1 in the lysates from the liver of WT and FKO mice fed on regular chow. Tubulin was used as loading control (n = 4 per group. representative of three repeats). (E, F) Quantification of the band intensity of pACC1/ACC1 ratio in (E) (n = 4 per group, each point represents a biology replicate). Data are represented as mean ± SEM, t test. (G) WB analysis of pACC1 and ACC1 in the lysates from the liver of WT and FKO mice fed on HFD. Tubulin was used as loading control (n = 4 per group, representative of three repeats). (G, H) Quantification of the band intensity of pACC1/ACC1 ratio in (G) (n = 4 per group, each point represents a biology replicate). Data are represented as mean ± SEM, t test. Source data are available for this figure.
Figure 7.
Figure 7.. Lipid profiling in the serum of FKO and WT mice upon HFD challenge by lipidomics.
(A) Total 944 different lipids were detected by the lipidomic analysis in the serum from WT and FKO mice fed on HFD for 14 wk (n = 3 per group; for each sample, sera from two or three mice were pooled). (B) The relative intensities of the lipid species for the lipidomic analysis in the serum from WT and FKO mice fed on HFD (n = 3 per group; for each sample, sera from two or three mice were pooled). Data are represented as mean ± SEM, t test *P < 0.05; **P < 0.01; ***P < 0.001. (C, D, E) The lipid metabolic pathway analysis using all the detected molecules from lipidomics. Node shape: circle, glycerolipids and glycerophospholipids (including DG, PE, PS, PC, PA, PG, CL, PIP, and PI); square, sphingolipids (including dhCer, Cer, and SM). Edge color: pink means negative regulation, whereas green means positive regulation. Source data are available for this figure.
Figure 8.
Figure 8.. FKO mice exhibit impaired glucose tolerance and insulin sensitivity.
(A) Fasting glucose levels in the plasma of WT and FKO mice fed on regular chow (n = 8 in WT group and n = 5 in FKO group, each point represents a biology replicate, representative of three repeats). Data are represented as mean ± SEM, t test, *P < 0.05. (B) Fasting insulin levels in the plasma of WT and FKO mice fed on regular chow (n = 8 in WT group and n = 5 in FKO group, each point represents a biology replicate, representative of three repeats). Data are represented as mean ± SEM, t test. (C) Blood glucose levels during the glucose tolerance test in WT and FKO mice fed on regular chow (n = 8 in WT group and n = 5 in FKO group). Data are represented as mean ± SEM. t test, *P < 0.05. (C, D) The area under the curve (AUC) from (C) (n = 8 in WT group and n = 5 in FKO group, each point represents a biology replicate). Data are represented as mean ± SEM, t test, *P < 0.05. (E) Blood glucose levels during the insulin tolerance test in WT and FKO mice fed on regular chow (n = 8 in WT group and n = 5 in FKO group, representative of three repeats). Data are represented as mean ± SEM, t test, *P < 0.05. (F) The AUC of (E) (n = 8 in WT group and n = 5 in FKO group, each point represents a biology replicate). Data are represented as mean ± SEM, t test, *P < 0.05. (G) Fasting glucose levels in the plasma of WT and FKO mice fed on HFD (n = 5 in WT group and n = 10 in FKO group, each point represents a biology replicate, representative of three repeats). Data are represented as mean ± SEM, t test, *P < 0.05. (H) Fasting insulin levels in the plasma of WT and FKO mice fed on HFD (n = 5 in WT group and n = 10 in FKO group, each point represents a biology replicate, representative of three repeats). Data are represented as mean ± SEM, t test, *P < 0.05. (I) Blood glucose levels during the glucose tolerance test in the WT and FKO mice fed on HFD (n = 5 in WT group and n = 10 in FKO group, representative of three repeats). Data are represented as mean ± SEM, t test, *P < 0.05, **P < 0.01. (I, J) The AUC of (I) (n = 5 in WT group and n = 10 in FKO group, each point represents a biology replicate). Data are represented as mean ± SEM, t test, **P < 0.01. (K) Blood glucose levels during the insulin tolerance test in WT and FKO mice fed on HFD (n = 5 in WT group and n = 10 in FKO group, representative of three repeats). Data are represented as mean ± SEM, t test, *P < 0.05. (K, L) The AUC of (K) (n = 5 in WT group and n = 10 in FKO group, each point represents a biology replicate). Data are represented as mean ± SEM, t test. (M) WB analysis of pAKT(S473) and AKT in the lysates from the liver of WT and FKO mice fed on HFD. The samples were collected 15 min later after insulin injection via i.p. β-Actin was used as the loading control (n = 3 per group, representative of three repeats). (N) Quantification of the band intensity of pAKT/AKT ratio in (M) (n = 3 per group, each point represents a biology replicate). Data are represented as mean ± SEM, t test, **P < 0.01. (O) WB analysis of pAKT(S473) and AKT in the lysates from the muscle of WT and FKO mice fed on HFD. The samples were collected 15 min later after insulin injection via i.p. β-Actin was used as the loading control (n = 3 per group, representative of three repeats). (O, P) Quantification of the band intensity of pAKT/AKT ratio in (O) (n = 3 per group, each point represents a biology replicate). Data are represented as mean ± SEM, t test, *P < 0.05. Source data are available for this figure.
Figure 9.
Figure 9.. Deficiency of Ces1d in adipose tissue leads to epigenetic regulations of the metabolic genes.
(A) qPCR analysis for the mRNA levels of Hnf4α and its target genes including G6pc, Pck1, Apoc3, and Cyp7a1 in the liver of WT and FKO mice fed on HFD (n = 5–10 per group, each point represents a biology replicate, representative of three repeats). Data are represented as mean ± SEM, one-way ANOVA, *P < 0.05. (B) WB analysis of HNF4α in the lysates from the liver of WT and FKO mice fed on HFD. Tubulin-α was used as loading control (n = 4 per group, representative of three repeats). (C) qPCR analysis for the mRNA levels of Hnf4α target genes including Pck1, Cyp7a1, and Apoc3 in the primary hepatocytes of WT or liver-specific Hnf4 knockout mice treated by the serum from WT or FKO mice (n = 3–6 per group, each point represents a biology replicate, representative of three repeats). Data are represented as mean ± SEM, t test, *P < 0.05, n.s, no significance. (D) Analysis of luciferase reporter activity for HNF4α in HepG2 cells treated by the serum from WT or FKO mice. RLU, relative light units (n = 6 per group, each point represents a biology replicate, representative of three repeats). Data are represented as mean ± SEM, t test, **P < 0.01. (E) qPCR analysis for the mRNA levels of Srebf1, Srebf2, Mlxipl, and Nr1h3 in the liver of WT and FKO mice fed on regular chow or HFD (n = 5 per group, each point represents a biology replicate, representative of three repeats) Data are represented as mean ± SEM, one-way ANOVA. (F) qPCR analysis for Creb1 mRNA in the sWAT of WT and FKO mice fed on regular chow or HFD (n = 5 per group, representative of three repeats). Data are represented as mean ± SEM, one-way ANOVA. (G) WB analysis of pCREB and CREB in the lysates from the sWAT of WT and FKO mice fed on HFD. β-Actin was used as loading control (n = 3 per group, representative of three repeats). (G, H) Quantification of the band intensity for pCREB/CREB ratio in (G) (n = 3 per group, each point represents a biology replicate). Data are represented as mean ± SEM, t test, *P < 0.05. (I) WB analysis of pCREB and CREB in the lysates from the BAT of WT and FKO mice fed on HFD. β-Actin was used as loading control (n = 4 per group, representative of three repeats). (I, J) Quantification of the band intensity for pCREB/CREB ratio in (I) (n = 4 per group, each point represents a biology replicate). Data are represented as mean ± SEM, t test, *P < 0.05. (K) WB analysis of pCREB and CREB in the lysates from the liver of WT and FKO mice fed on HFD. β-Actin was used as loading control (n = 4 per group, representative of three repeats). (K, L) Quantification of the band intensity for pCREB/CREB ratio in (K) (n = 4 per group, each point represents a biology replicate). Data are represented as mean ± SEM, t test, **P < 0.01.
Figure S3.
Figure S3.. Gene expression levels of metabolism-related factors in the WT and FKO mice.
(A) qPCR analysis for the mRNA levels of Hnf4a, G6pc, Pepck1, Cyp7a1, and Apoc3 in the liver from WT and FKO mice fed on regular chow (n = 5 per group, representative of three repeats). Data are represented as mean ± SEM, t test, *P < 0.05, **P < 0.01. (B) qPCR analysis for the mRNA levels of Pparγ, Srebf1, Srebf2, Mlxipl, and Nr1h3 in the sWAT from WT and FKO mice fed on regular chow or HFD (n = 5 per group, representative of three repeats). Data are represented as mean ± SEM, one-way ANOVA. (C) Heat map and clusters for all the DEGs in the RNA-seq from the WAT of WT and FKO fed on HFD. High and low expression values of DEGs are represented by red and blue colors, respectively.
Figure 10.
Figure 10.. Deficiency of Ces1d in adipose tissue leads to down-regulation of mitochondrial function related genes.
(A) Volcano plot showing differential expressed genes from RNA-seq data of white adipose tissue from WT versus FKO mice fed on HFD. The red dots denote the significantly differentially expressed genes (DEGs) with absolute log2 (fold change) greater than 1.2 and −log10 false discovery rate (FDR) great than 0.70 (n = 5 per group). (B) Bubble chart of the Gene Ontology and KEGG pathways enriched in the down-regulated DEGs (n = 559 genes). Bubble color reflects enrichment strength (−log10 FDR). Bubble size reflects the number of genes in each term. FDR: false discovery rate. (C) Heat map showing expression pattern of the respiratory chain related genes in the WAT from WT and FKO mice. Red and blue colors are proportional the high and low expression, respectively.
Figure 11.
Figure 11.. Deficiency of Ces1d in adipose tissue causes local unhealthy microenvironment in adipose tissue and the liver, ultimately leading to systemic insulin resistance.
(A) qPCR analysis for the mRNA levels of adipogenesis-related genes including Pdgfa, Pdgfb, Zfp243, and Dlk1 in the sWAT of WT and FKO mice fed on regular chow or HFD (n = 5 in each group, each point represents a biology replicate, representative of three repeats). Data are represented as mean ± SEM, one-way ANOVA, *P < 0.05, **P < 0.01, ***P < 0.001. (B) qPCR analysis for the mRNA levels of fibrosis related genes including Col1a1, Col2a1, Clo3a1, Clo6a3, and Lox in the sWAT from WT and FKO mice fed on regular chow or HFD (n = 5 in each group, each point represents a biology replicate, representative of three repeats). Data are represented as mean ± SEM, one-way ANOVA, *P < 0.05, **P < 0.01, ***P < 0.001. (C) qPCR analysis for the mRNA levels of inflammation related genes including Tlr4, Tnf, and Adgre1 in the sWAT of WT and FKO mice fed on regular chow or HFD (n = 5 in each group, each point represents a biology replicate, representative of three repeats). Data are represented as mean ± SEM, one-way ANOVA, *P < 0.05, **P < 0.01. (D) IF staining with α-Mac-2 antibody on the eWAT of WT and FKO mice fed on HFD (representative of six fields, experiments were repeated for three times; scale bars: 200 μm). (E) Co-IF staining with α-CD68 (green) and α-CD206 (red) antibodies on the eWAT of WT and FKO mice fed on HFD (representative of six fields, experiments were repeated for three times; scale bars: 200 μm). (F) qPCR analysis for the mRNA levels of fibrosis related genes including Tgfbr1, Col1a1, Col2a1, and Col3a1 in the liver from WT and FKO mice fed on regular chow or HFD (n = 5 in each group, each point represents a biology replicate, representative of three repeats). Data are represented as mean ± SEM, one-way ANOVA, **P < 0.01. (G) qPCR analysis for the mRNA levels of inflammation related genes including Adgre1, Tlr4, Nos2, Il1b, Cd86, Cd163, Cd206, Nfkb, Il-4r, and Clec4e in the liver of WT and FKO mice fed on regular chow or HFD (n = 5 in each group, each point represents a biology replicate, representative of three repeats). Data are represented as mean ± SEM, one-way ANOVA, *P < 0.05, **P < 0.01. (H) IF staining with α-Mac-2 antibody on the liver of WT and FKO mice fed on HFD (representative of six fields, experiments were repeated for three times, scale bars: 100 μm). (I) Left: In the normal adipose tissue, Ces1d hydrolyzes the lipid droplet TG. The produced FFAs circulate into BAT and the liver where they serve as the substrates for energy generation. Moreover, the FFAs also function as signaling molecules to activate the lipid-sensing transcriptional factors to regulate the glucose and lipid metabolic homeostasis. Right: In the Ces1d-deficient adipose tissue, insufficiency of lipolysis leads to the formation of larger lipid droplets in adipocytes. The excessive nutritional stress, especially under HFD challenging condition may cause increased ectopic deposition of TG in peripheral tissues. This leads to lipotoxicity, which further induces fatty liver and whitening of the BAT. Concomitantly, absence of the key signaling FFAs might blunt the proper regulations of key metabolic genes, which further worsens the metabolic adverse effects. Ultimately, the mice develop whole-body insulin resistance.
Figure S4.
Figure S4.. Expression levels of leptin and adiponectin in the WT and FKO mice.
(A) qPCR analysis for Lep in the sWAT from WT and FKO mice fed on regular or HFD (n = 5 -10 per group, each point represents a biology replicate, representative of three repeats). Data are represented as mean ± SEM, one-way ANOVA, **P < 0.01, ***P < 0.001. (B) qPCR analysis for Adipoq mRNA level in the sWAT from WT and FKO mice fed on regular chow or HFD. (n = 5 in each group, each point represents a biology replicate, representative of three repeats). Data are represented as mean ± SEM, one-way ANOVA.

References

    1. Rosen ED, Spiegelman BM (2014) What we talk about when we talk about fat. Cell 156: 20–44. 10.1016/j.cell.2013.12.012 - DOI - PMC - PubMed
    1. Sun K, Kusminski CM, Scherer PE (2011) Adipose tissue remodeling and obesity. J Clin Invest 121: 2094–2101. 10.1172/JCI45887 - DOI - PMC - PubMed
    1. Cusi K (2010) The role of adipose tissue and lipotoxicity in the pathogenesis of type 2 diabetes. Curr Diab Rep 10: 306–315. 10.1007/s11892-010-0122-6 - DOI - PubMed
    1. Krahmer N, Farese RV, Jr, Walther TC (2013) Balancing the fat: Lipid droplets and human disease. EMBO Mol Med 5: 973–983. 10.1002/emmm.201100671 - DOI - PMC - PubMed
    1. Ducharme NA, Bickel PE (2008) Lipid droplets in lipogenesis and lipolysis. Endocrinology 149: 942–949. 10.1210/en.2007-1713 - DOI - PubMed