Clinical Trial
. 2022 Jun;36(6):1654-1665.
doi: 10.1038/s41375-022-01571-8. Epub 2022 Apr 22.

Integrated clinical and genomic evaluation of guadecitabine (SGI-110) in peripheral T-cell lymphoma

Affiliations
Clinical Trial

Integrated clinical and genomic evaluation of guadecitabine (SGI-110) in peripheral T-cell lymphoma

Jonathan Wong et al. Leukemia. 2022 Jun.

Abstract

Peripheral T-cell lymphoma (PTCL) is a rare, heterogenous malignancy with dismal outcomes at relapse. Hypomethylating agents (HMA) have an emerging role in PTCL, supported by shared mutations with myelodysplasia (MDS). Response rates to azacitidine in PTCL of follicular helper cell origin are promising. Guadecitabine is a decitabine analogue with efficacy in MDS. In this phase II, single-arm trial, PTCL patients received guadecitabine on days 1-5 of 28-day cycles. Primary end points were overall response rate (ORR) and safety. Translational sub-studies included cell free plasma DNA sequencing and functional genomic screening using an epigenetically-targeted CRISPR/Cas9 library to identify response predictors. Among 20 predominantly relapsed/refractory patients, the ORR was 40% (10% complete responses). Most frequent grade 3-4 adverse events were neutropenia and thrombocytopenia. At 10 months median follow-up, median progression free survival (PFS) and overall survival (OS) were 2.9 and 10.4 months respectively. RHOAG17V mutations associated with improved PFS (median 5.47 vs. 1.35 months; Wilcoxon p = 0.02, Log-Rank p = 0.06). 4/7 patients with TP53 variants responded. Deletion of the histone methyltransferase SETD2 sensitised to HMA but TET2 deletion did not. Guadecitabine conveyed an acceptable ORR and toxicity profile; decitabine analogues may provide a backbone for future combinatorial regimens co-targeting histone methyltransferases.


Conflict of interest statement

JS has received research funding from Astex Pharmaceuticals Inc. related to the published work. All other disclosures for JS and co-authors are outside of the published work. JS has received research funding from Amgen and Bristol Myers Squibb/Celgene; JS has served on Advisory Boards for Novartis, BMS, Mundipharma and Astellas. RG has received honoraria from Merck Sharp & Dohme, Takeda, Novartis, AbbVie and Astellas. EAH has provided consultancy to Specialised Therapeutics; EAH has received research funding from Bristol Myers Squibb/Celgene, Merck KGaA, Astra Zeneca and Roche; EAH has received speakers bureau from Roche, Astra Zeneca, Janssen, Regeneron and Abbvie; EAH has served on Advisory Boards for Roche, Antigene, Bristol Myers Squibb and Astra Zeneca and has received travel expenses from Roche. LMK has received research funding and consultancy fees from Agios Pharmaceuticals and Celgene. JR has received research funding from AbbVie and is a shareholder in Novartis AG and Alcon. GPG has served on Advisory Boards for Roche, Novartis, Janssen and Gilead; GPG has received honoraria/speakers’ bureau from Roche, Novartis, Janssen and Astra Zeneca; GPG has received research funding from Beigene, Merck, Abbvie and Janssen; GPG has received travel funds from Roche and Novartis. SO has provided consultancy to AbbVie, Astra Zeneca, Janssen and Roche; SO has received research funding from Amgen and Beigene; SO has received honoraria from AbbVie, Astra Zeneca, Celgene, CSL Behring, Gilead, Janssen, Merck, Roche and Takeda; SO has served on Advisory Boards for AbbVie, Astra Zeneca, Celgene, CSL Behring, Gilead, Janssen, Merck, Roche and Takeda. The other authors have no COI to disclose.

Figures
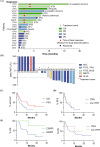
Fig. 1
Fig. 1. Treatment response summary.
A Swimmer plots demonstrating progress of subjects treated for T-cell lymphoma with guadecitabine from treatment initiation to discontinuation. B Change in total metabolic tumor volume at time of maximal clinical response relative to baseline. Those patients who withdrew from the study prior to cycle 2 FDG-PET assessment are arbitrarily designated + 100%. C PFS and OS of guadecitabine-treated patients (D) PFS (top panel) and OS (lower panel) of guadecitabine-treated patients stratified by tTFH status. E Landmark analysis of OS from 2 months for response (PR + CR) vs non-response (SD + PD). PTCL Peripheral T-cell lymphoma, tTFH T-cell lymphoma of T-follicular helper origin, MEITL Monomorphic epitheliotropic intestinal T-cell lymphoma, CMML Chronic myelomonocytic leukemia, ALCL Anaplastic large cell lymphoma, CR Complete response, PR Partial response, SD Stable disease, PD Progressive disease.
Fig. 2
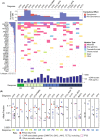
Fig. 2. Mutation analysis of ctDNA plasma.
A Co-mutation plot for variants detected in ctDNA at study entry clustered according to best clinical response. B Variant allele fractions for RHOA, TP53 and CHIP associated mutations from individual subjects at trial baseline. RHOA mutated cases are represented to the left of the figure. ctDNA cell free tumor DNA, PTCL Peripheral T-cell lymphoma, tTFH T-cell lymphoma of T-follicular helper origin, MEITL Monomorphic epitheliotropic intestinal T-cell lymphoma, CMML Chronic myelomonocytic leukemia, ALCL Anaplastic large cell lymphoma, CR Complete response, PR Partial response, SD Stable disease PD Progressive disease, CHIP Clonal hematopoiesis of indeterminate potential, MB Megabase, hGE Human genome equivalents.
Fig. 3
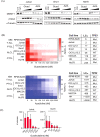
Fig. 3. In vitro activity of guadecitabine and azacitidine versus T-cell lymphoma lines.
A Western blot of DNMT1 expression and γH2AX phosphorylation for cells treated for 72 h with 39-312 nM of HMA. αTubulin is provided as a loading control. Results are representative of 3 independent experiments. B Heat map of cell viability (propidium iodide exclusion) following 5 days treatment with guadecitabine or azacitidine with viability analysis performed on day 7. The subtype of lymphoma is annotated to the left of each heat map and LC50 and TP53 mutation status for each cell line are tabulated to the right. The RPMI-8226 myeloma cell line is provided as an HMA sensitive positive control. Results are the median of 3 independent experiments. C Colony forming assay for cells treated with guadecitabine or vehicle control for 72 h prior to plating in soft agar. Bars represent median colony counts (+/− SEM; n = 3 independent experiments) following 21 days culture. Unt Untreated, Veh Vehicle control, Guad Guadecitabine, AZA Azacitidine, MM Multiple myeloma, T-ALL T-cell acute lymphoblastic leukemia, PTCL Peripheral T-cell lymphoma, ALCL Anaplastic large cell lymphoma, CTCL Cutaneous T-cell lymphoma, LC50, 50% lethal concentration, Mut Mutated, WT Wild type.
Fig. 4
Fig. 4. Expression profiling of HMA-treated T-cell lymphoma cells.
A Scatterplot correlating significant DEGs (FDR < 0.05) (RNA Seq) induced by guadecitabine (100 nM) or AZA (100 nM) in Hut78 (upper panel) or Smz1 (lower panel) for 72 h of drug treatment, relative to vehicle (DMSO). B Violin plots of significant DEGs (FDR < 0.05 and |logFC | > 0.5) induced by either AZA or Guadecitabine in Hut78 (upper panel) or Smz1 (lower panel). C Venn diagram showing overlap between differentially expressed genes induced by either Guadecitabine or AZA (FDR < 0.05) in Hut78 and Smz1 cells. P value from hypergeometric analysis is shown. D Heatmap of significantly DEGs (FDR < 0.05 and |logFC | > 0.5) induced by guadecitabine or AZA, relative to vehicle, in either Hut78 or Smz1 cells. E Venn diagram showing overlap in Hallmark gene sets that were significantly enriched in Hut78 and SMZ1 cells treated with guadecitabine. F Enrichment plots of selected gene sets from (E). AZA Azacitidine, Guad Guadecitabine, DMSO Dimethylsulfoxide DEG Differentially expressed genes, FDR False discovery rate.
Fig. 5
Fig. 5. CRISPR/Cas9 screen targeting epigenetic regulators that modulate response HMAs.
A CRISPR/Cas9 knockout screen in Hut78 cells using a custom library targeting ~900 epigenetic regulators. Scatterplot showing correlation of enrichment of genes in the presence of guadecitabine (150 nM) or AZA (300 nM) relative to DMSO after 24 days of culture. Gene enrichment was determined by MAGeCK. B STRING network analysis showing known interactions between proteins encoded by genes that increased or decreased sensitivity of Hut78 cells to HMA treatment. C Heatmap showing change in representation (logFC) of the subset of genes represented in both the CRISPR/Cas9 screen and the ctDNA panel performed on clinical trial patients (p < 0.05 in bold type). D Log2 normalised read counts for individual sgRNAs targeting the indicated genes between day 0 and 24 of the screen. E Competitive proliferation assay using Hut78 cells transduced vectors expressing the indicated sgRNAs and co-expressing the Crimson reporter. Cells were treated with DMSO, guadecitabine (100 nM) or AZA (800 nM). Error bars indicate mean ± s.d. from 2 biological replicates. F Cells were treated with DMSO, guadecitabine (100 nM) or AZA (800 nM) for 72 h and apoptosis was quantified by FACS using Annexin/PI staining. Error bars indicate mean ± s.d. from 3 biological replicates. sg, short guide RNA, SCR Scrambled AZA Azacitidine, Guad Guadecitabine, DMSO Dimethylsulfoxide, FDR False discovery rate, PI Propidium iodide.

References

    1. Ma H, O’Connor OA, Marchi E. New directions in treating peripheral T-cell lymphomas (PTCL): leveraging epigenetic modifiers alone and in combination. Expert Rev Hematol. 2019;12:137–46. doi: 10.1080/17474086.2019.1583102. - DOI - PubMed
    1. Lemonnier F, Dupuis J, Sujobert P, Tournillhac O, Cheminant M, Sarkozy C, et al. Treatment with 5-azacytidine induces a sustained response in patients with angioimmunoblastic T-cell lymphoma. Blood. 2018;132:2305–9. doi: 10.1182/blood-2018-04-840538. - DOI - PubMed
    1. Sakata-Yanagimoto M, Enami T, Yoshida K, Shiraishi Y, Ishii R, Miyake Y, et al. Somatic RHOA mutation in angioimmunoblastic T-cell lymphoma. Nat Genet. 2014;46:171–5. doi: 10.1038/ng.2872. - DOI - PubMed
    1. Odejide O, Weigert O, Lane AA, Toscano D, Lunning MA, Kopp N, et al. A targeted mutational landscape of angioimmunoblastic T-cell lymphoma. Blood. 2014;123:1293–6. doi: 10.1182/blood-2013-10-531509. - DOI - PMC - PubMed
    1. Cairns RA, Iqbal J, Lemonnier F, Kucuk C, de Leval L, Jais JP, et al. IDH2 mutations are frequent in angioimmunoblastic T-cell lymphoma. Blood. 2012;119:1901–3. doi: 10.1182/blood-2011-11-391748. - DOI - PMC - PubMed

Publication types

MeSH terms