. 2022 Nov;29(11):2163-2176.
doi: 10.1038/s41418-022-01005-z. Epub 2022 Apr 22.

IRF4 deficiency vulnerates B-cell progeny for leukemogenesis via somatically acquired Jak3 mutations conferring IL-7 hypersensitivity

Affiliations

IRF4 deficiency vulnerates B-cell progeny for leukemogenesis via somatically acquired Jak3 mutations conferring IL-7 hypersensitivity

Dennis Das Gupta et al. Cell Death Differ. 2022 Nov.

Abstract

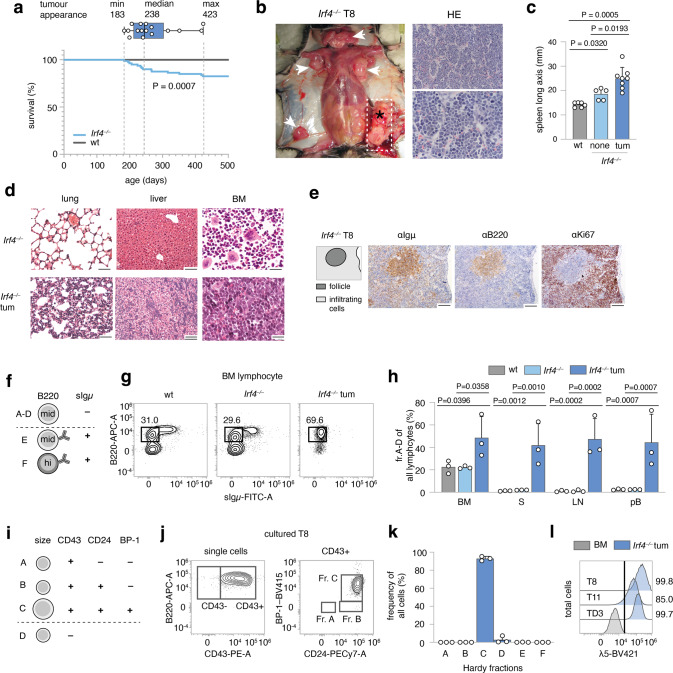
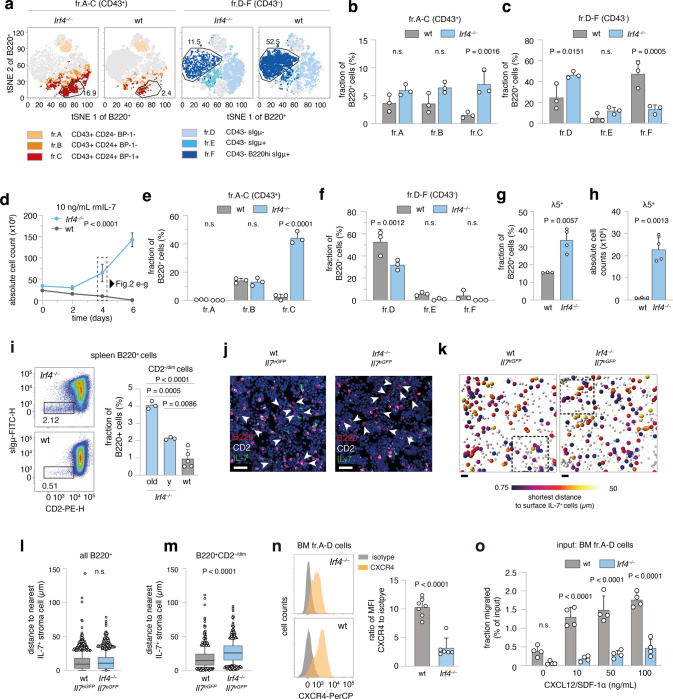
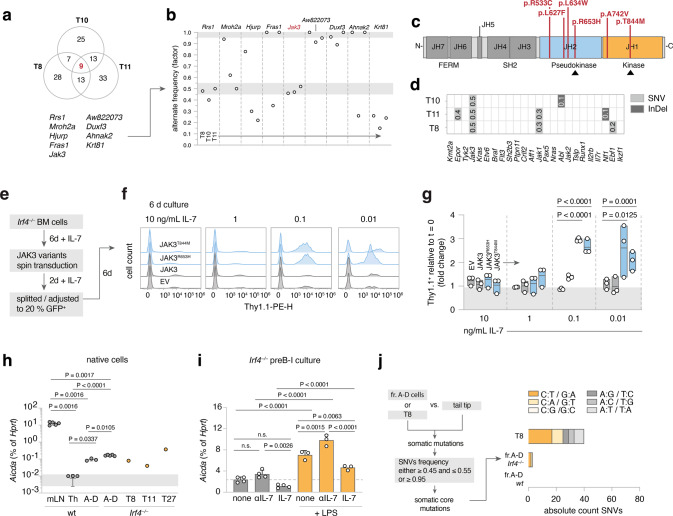
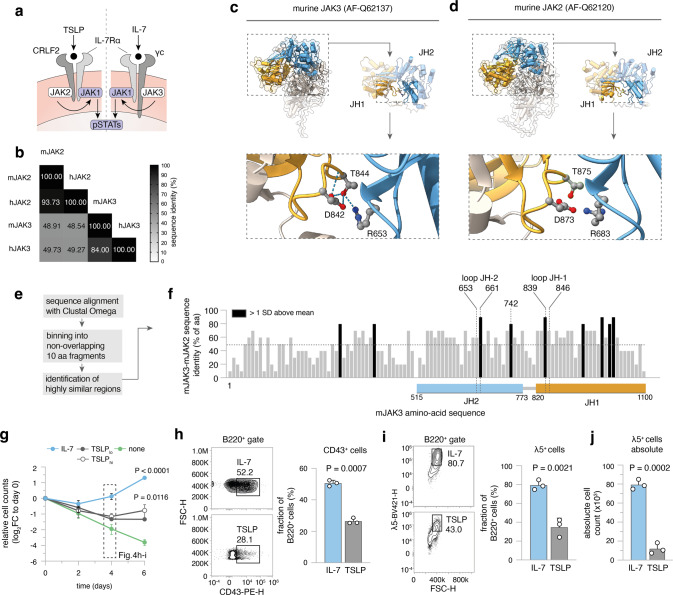
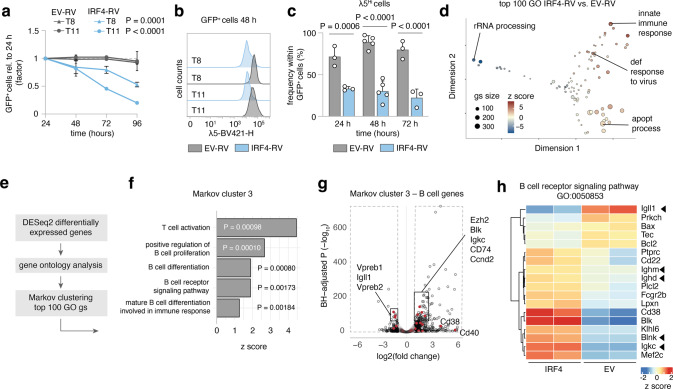
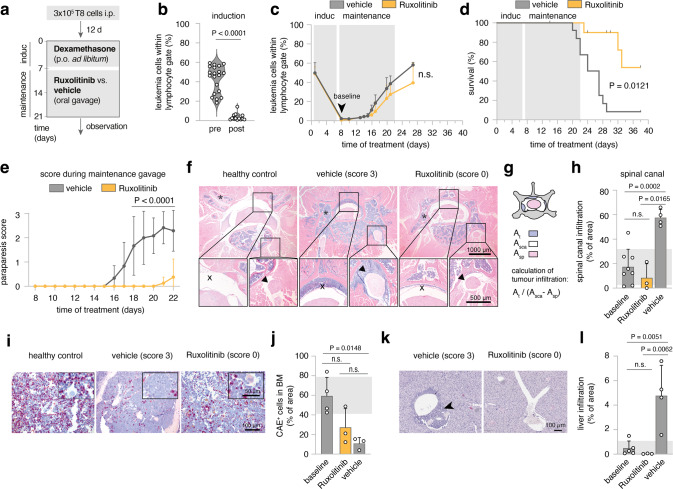
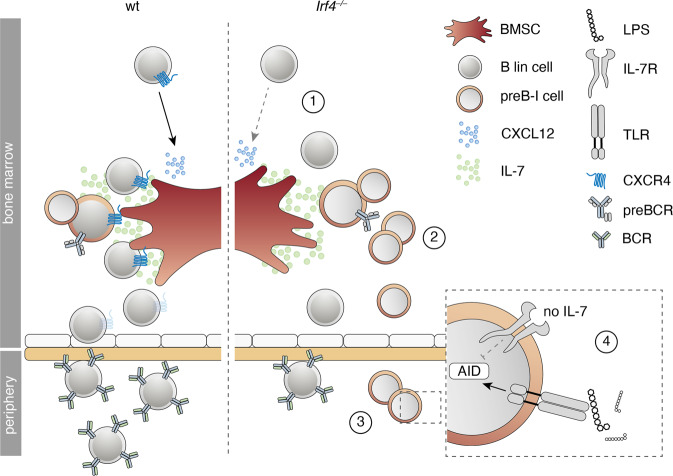
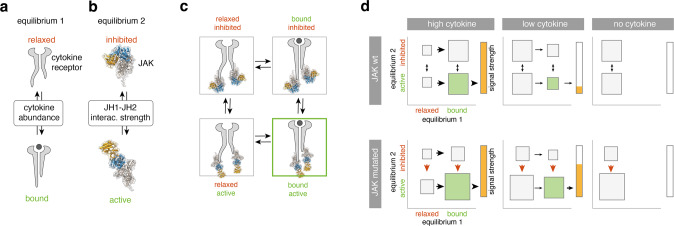
The processes leading from disturbed B-cell development to adult B-cell progenitor acute lymphoblastic leukemia (BCP-ALL) remain poorly understood. Here, we describe Irf4-/- mice as prone to developing BCP-ALL with age. Irf4-/- preB-I cells exhibited impaired differentiation but enhanced proliferation in response to IL-7, along with reduced retention in the IL-7 providing bone marrow niche due to decreased CXCL12 responsiveness. Thus selected, preB-I cells acquired Jak3 mutations, probably following irregular AID activity, resulting in malignant transformation. We demonstrate heightened IL-7 sensitivity due to Jak3 mutants, devise a model to explain it, and describe structural and functional similarities to Jak2 mutations often occurring in human Ph-like ALL. Finally, targeting JAK signaling with Ruxolitinib in vivo prolonged survival of mice bearing established Irf4-/- leukemia. Intriguingly, organ infiltration including leukemic meningeosis was selectively reduced without affecting blood blast counts. In this work, we present spontaneous leukemogenesis following IRF4 deficiency with potential implications for high-risk BCP-ALL in adult humans.


Conflict of interest statement

The authors declare no competing interests.

Figures

Fig. 1
Fig. 1. Spontaneous emergence of preB-I cell BCP-ALL in adult Irf4−/− mice.
a A cohort of 80 Irf4−/− and wt mice was observed over 500 days for tumor development. Kaplan–Meier plot of survival. Box and whisker plot indicates minimum, maximum and median age at tumor appearance of the 14 affected mice. b Macroscopic appearance of an exemplary tumor (asterisk) and LNs (arrowheads) in an Irf4−/− mouse. Right: Hematoxylin-Eosin (HE) staining from the tumor. Scale bars: top: 50 µm, bottom: 20 µm. c Longitudinal spleen (S) axis (mm) of Irf4−/− mice with (n = 8) or without (n = 5) tumor and control wt mice (n = 6). tum = tumor. d HE stainings of lung, liver, and BM of tumor mouse T8 and a healthy Irf4−/− mouse. Scale Bars: 50 µm (lung and liver), 20 µm (BM). e IHC-stainings of T8 mouse spleen for Igμ, B220, and Ki67. Scale bars: 100 µm. f Schematic representation of gross Hardy fractioning by surface B220 and Igμ expression. g Whole BM cells from wt, Irf4−/−, and tumor mice were stained for B220 and sIgμ expression and analyzed by flow cytometry. h Quantification of cell frequencies gated as in (g) for BM, S, LN, and pB (peripheral blood) of n = 3 mice per group. i Tabular representation of Hardy fr. A-D by size, CD43-, CD24-, and BP-1-surface expression. j Surface expression of markers as in (i) of in vitro cultured T8 tumor cells k quantification of cell frequencies gated as in (j) for three tumors (T8, T11, TD3) l surface λ5 expression on T8, T11, and TD3 by flow cytometry in comparison to whole BM cells from Irf4−/− mice (BM) as a negative control. Statistical significance testing was performed with (c) one-way Welch-ANOVA followed by Dunnet’s T3 multiple comparison test and (h) with two-way ANOVA followed by pair-wise Tukey corrected comparisons within each organ. Bars depict mean ± SD, dots indicate mice (h) or distinct Irf4−/− tumors (k).
Fig. 2
Fig. 2. Irf4−/− B lymphopoiesis is preleukemically altered.
ac flow cytometric analysis of BM cells for Hardy markers as in Fig. 1j. a tSNE of BM cells gated on B220+ cells. Colors correspond to Hardy fractions identified by the markers detailed in the legend. b and c quantification of Hardy fraction frequencies for n = 3 mice per genotype. dh BM cells from Irf4−/− and wt mice were cultured in the presence of 10 ng/mL rmIL-7 for 6 days and d counted every two days. e, f After 4 days, cells were stained as in ac and Hardy fractions quantified. g frequency and h absolute cell counts of λ5+ cells on day 4. i spleen cells from Irf4−/− (“y” = young: 6–10 weeks and old: >6 months) and wt mice were analyzed for the presence of CD2–/dimsIgμ cells within the B220+ gate. one-way ANOVA, Tukey post hoc. jm 7 µm cryosections from Irf4−/−Il-7eGFP and wt Il-7eGFP mice were stained for B220, CD2, GFP, and DAPI. j exemplary regions of BM cryosections. Arrowheads indicate B220+CD2–/dim cells. Scale bars = 15 µm. k automated B220+ cell detection: gray spheres indicate B220+ cells, larger spheres B220+CD2–/dim cells, color-coded for their distance to GFP+ cells. Rectangles indicate magnified areas in j. Scale bars = 40 µm. l, m quantification of distances to IL-7+ cells for l all B220+ and m B220+CD2–/dim cells. (n = 4 mice per genotype, one cryosection from femur metaphysis per mouse analyzed). Box and whiskers indicate mean and 95-IQR, dots indicate cells outside 95-IQR. n BM cells from Irf4−/− and wt mice were gated on B220+sIgμ fr.A-D cells and analyzed for CXCR4 expression (left panels as representative staining). Data is presented for n = 7 (wt) and n = 6 (Irf4−/−) mice as the ratio of geometric mean for CXCR4 to isotype staining. o MACS-purified fr.A-D cells from BM were placed in the top insert of a Boyden chamber and left to migrate towards differing concentrations of CXCL12 for 16 h. Dots represent n = 4 biologically independent experiments, presented as migrated percentage of input cells. Two-Way ANOVA, Sidak post hoc for (b, c, e, f, o), Two-tailed unpaired t test for (g, h, ln).
Fig. 3
Fig. 3. leukemia-derived Jak3 mutations heighten IL-7 sensitivity of Irf4−/− preB-I cells.
a Venn diagram of shared mutated genes among WES from three Irf4−/− leukemia samples (T8, T10, T11) b the nine shared genes were filtered for SNV frequency. gray areas: >0.95 and 0.45–0.55 margins as core mutation filters. c the five detected distinct Jak3 SNVs were mapped onto JAK3 primary structure (JH = Jak homology domain). d Irf4−/− leukemia WES were analyzed for mutations (SNV or InDel = insertions/deletions) in genes commonly altered in human BCP-ALL. Numbers indicate rounded frequencies of alteration. eg Irf4−/− BM cells were cultured for 6d with 10 ng/mL rmIL-7, transduced with control or JAK3mut coding RVs, rested for 2 days, and then split into decreasing IL-7 concentrations. f Histograms for the Thy1.1 RV infection marker 6 days after splitting. g Quantification of Thy1.1+ cells after 6 days relative to start of culture (t = 0). Dots indicate n = 3 independent experiments, plotted as floating bars. EV = empty vector. h qRT-PCR from wt and Irf4−/− cells for Aicda mRNA expression, relative to Hprt expression for n = 3 (Th (= T helper) and sorted fr.A-D wt BM cells), n = 5 (mLN (= mesenteric lymph node) and sorted fr.A-D Irf4−/− BM cells), n = 1 per tumor T8, T11, T27. i Irf4−/− preB-I cell cultures from whole BM cells were cultured in combinations of IL-7, αIL-7, and LPS for 24 h, as indicated, and analyzed for Aicda levels by qRT-PCR for n = 4 (no LPS) and n = 3 (LPS) samples. j WES from fr.A-D cells and T8 were compared to tail-tip samples to identify SNVs. Filtering on SNV frequency “0.45–0.55 or ≥0.95” yielded putative “core mutations”. Absolute numbers of nucleotide exchanges are presented as stacked bars, colors give the type of nucleotide exchange. Two-way ANOVA, Sidak post hoc for gi.
Fig. 4
Fig. 4. Ph-like ALL in humans harbors Jak2 mutation corresponding to Jak3 mutations in Irf4−/− BCP-ALL.
a Cartoon depicting IL-7 and TSLP receptor components. b Multiple sequence alignment results (using Clustal Omega) of mouse (m) and human (h) JAK3 and JAK2 amino-acid sequences are presented as a matrix. Numbers and shade indicate sequence identity as percentage of amino acids. cd Alpha-fold structure predictions of murine c JAK3 and d JAK2 are presented. Colors indicate domains: orange = JH1, blue = JH2. JH1-JH2 interface is magnified and T844/T875, R653/R683, D842/D873 amino acids are highlighted as ball-and-sticks representations. Dotted lines = hydrogen bonds. e Overview of analysis for f: Sequences of mJAK2 and mJAK3 were aligned using Clustal Omega. The sequence of mJAK3 was binned into 10 non-overlapping amino-acid fragments and the sequence identity to mJAK2 plotted along the mJAK3 sequence. Dotted line = mean protein-wide sequence identity, black bars = areas with sequence identity greater than 1 SD above mean. JH1 and JH2 loop regions are mapped onto the sequence, JH1 and JH2 domain regions are indicated by colored rectangles below. gj Irf4−/− BM cells were cultured for 6 days in the presence of 10 ng/mL rmIL-7, 10, or 100 ng/mL rmTSLP(lo/hi) or no cytokine (none). g log2 of cell counts relative to day 0 for n = 3 independent experiments plotted as means ± SD. One-way ANOVA, Sidak post hoc comparing cytokine effect. hi On day 4, h CD43+ and i λ5+ cells within B220+ cells were recorded for IL-7 and TSLP treated cultures. Numbers indicate percentages within the depicted gates of B220+ cells. j Absolute counts of λ5+ cells at day 4. Dots in hj indicate n = 3 independent experiments, presented as bars (mean ± SD). Unpaired two-tailed t test for hj.
Fig. 5
Fig. 5. IRF4 re-expression results in apoptosis and differentiation of leukemia cells.
ac T8 and T11 cells were transduced with IRF4-RV or control empty vector (EV)-RV. a GFP+ cell frequency normalized to 24 h after transduction was recorded. One-Way ANOVA, Sidak post hoc for RV effect per tumor. Mean ± SD of n = 3 independent experiments. b Representative histogram of λ5 surface expression of GFP+ cells at 48 h. c Pooled Quantification of λ5Hi cells for three (24, 72 h) to five (48 h) independent experiments for T8 and T11. dh T8 cells were collected in duplicates at 24 h after EV-RV and IRF4-RV transduction and subjected to bulk RNAseq. d MDS plot of top 100 gene ontology (GO) gene-sets varying between EV and IRF4 transduced T8. Representative gene sets annotated. Size of circles = number of genes, color = z score. e Analysis strategy for GO gene-set clustering using Markov clustering. f Gene-sets from Markov cluster 3 and corresponding P values and z scores. g Volcano plot of B-cell genes from Markov cluster 3 (red) highlighted within all differentially regulated genes (black). h Heat map of B-cell receptor signaling GO gene-set. Immunoglobulin genes and the tumor suppressor Blnk are marked. Color = z score.
Fig. 6
Fig. 6. Ruxolitinib reduces leukemic meningeosis and organ infiltration in vivo.
a Schematic overview of experimental design. Day 0: injection of mice with 2 × 105 T8 cells. After 12 days initiation of Dexamethasone induction therapy supplied in drinking water for seven days. Maintenance therapy comprised either Ruxolitinib-phosphate (11 mice) or vehicle control gavage (13 mice) twice daily for 14 days. Mice were scored daily and blood sampling was performed regularly. b Leukemia cell frequency (B220+sIgμ-) within lymphocyte gate before and after induction with Dexamethasone. Two-tailed unpaired t test c time-course of leukemia cell frequencies in peripheral blood for Ruxolitinib and vehicle-treated mice. d Survival as Kaplan–Meier plot analyzed with Log-rank test. In the Ruxolitinib group, four mice were excluded and censored due to intervention-related adverse reactions or due to their use in the analysis described in fl. e Disease scores, determined as described in methods. Mean ± SD of the scores per indicated treatment group analyzed by two-way ANOVA, Sidak post hoc. n = 2 replicate experiments for be with similar outcome. f Exemplary histopathology (HE) of healthy or leukemia bearing mice (score 3, vehicle-treated or score 0, Ruxolitinib-treated). One representative mouse per condition. Bar size in the bottom right corners. Top panels: an overview of cross-sectioned lumbar vertebrum, bottom inserts from spinal canal (left) and spinal nerve root (right). g Schematic representation of the calculation of tumor infiltration into the spinal canal. (At: area of tumor infiltration, Asca: area of total spinal canal, Asp: area of the spinal cord). h Quantification of spinal canal infiltration according to g for n = 8 after induction (baseline), n = 3 score 0 (Ruxolitinib) and n = 4 score 3 (vehicle) mice. i Representative CAE stainings from vertebral BM for score 0 and score 3 mice. j Quantification of area occupied by CAE+ cells relative to total BM area for n = 4 (baseline), n = 3 (score 0, Ruxolitinib) and n = 4 (score 3, vehicle) mice. k Representative HE stainings from liver tissue for score 0 and score 3 mice, Scale bar bottom right. l Quantification of tumor infiltrated area relative to whole liver area for n = 5 (baseline), n = 3 (score 0, Ruxolitinib) and n = 4 (score 3, vehicle) mice. Each dot represents measurements of three complete liver cross-sections per mouse.
Fig. 7
Fig. 7. Summary of the preB-I preleukemic state induced by IRF4 deficiency.
Cartoon summarizing the findings for IRF4 deficient compared to wt B lymphopoiesis. B lineage (lin) cells are less responsive to BMSC-derived CXCL12 due to reduced surface CXCR4 expression (1). Irf4−/− preB-I cells exhibit impaired differentiation and IL-7 dependent hyperproliferation (2). Irf4−/− preB cells escape into the periphery (3), where a combination of IL-7 deprivation and danger-associated molecular patterns (such as LPS) might induce AID expression (4), fueling mutagenesis.
Fig. 8
Fig. 8. A “two-equilibrium model” explains JAK mutant effects in primary preB-I cells.
a Equilibrium 1 is determined by cytokine abundance and dictates the cytokine receptor state (bound vs. relaxed). b Equilibrium 2 is determined by the interaction strength between JH1 and JH2 domains in JAKs and dictates the JAK state (inhibited vs. active). c Equilibria 1 and 2 interact to create four possible states. Green lettering indicates signaling favoring state. Green frame indicates the actively signaling state. d For high (left), low (middle), and no (right) cytokine in the presence or absence of JAK3 mutations, hypothetical probabilities of equilibria states as in c are presented. Size of rectangles signifies likelihood of state relative to others. Arrows indicate shifts of equilibria, red arrows indicate the effect of JAK mutations. Green rectangle = active signaling state (bound and active). Bars to the right of each panel indicate signal strength as a direct result of the two equilibria adjacent to it.

References

    1. Johnson K, Hashimshony T, Sawai CM, Pongubala JMR, Skok JA, Aifantis I, et al. Regulation of immunoglobulin light-chain recombination by the transcription factor IRF-4 and the attenuation of interleukin-7 signaling. Immunity. 2008;28:335–45. doi: 10.1016/j.immuni.2007.12.019. - DOI - PubMed
    1. Geier JK, Schlissel MS. Pre-BCR signals and the control of Ig gene rearrangements. Semin Immunol. 2006;18:31–9. doi: 10.1016/j.smim.2005.11.001. - DOI - PubMed
    1. Herzog S, Reth M, Jumaa H. Regulation of B-cell proliferation and differentiation by pre-B-cell receptor signalling. Nat Rev Immunol. 2009;9:195–205. doi: 10.1038/nri2491. - DOI - PubMed
    1. Fistonich C, Zehentmeier S, Bednarski JJ, Miao R, Schjerven H, Sleckman BP, et al. Cell circuits between B cell progenitors and IL-7+ mesenchymal progenitor cells control B cell development cell circuits control B cell development. J Exp Med. 2018;215:2586–99. doi: 10.1084/jem.20180778. - DOI - PMC - PubMed
    1. Huber M, Lohoff M. IRF4 at the crossroads of effector T-cell fate decision. Eur J Immunol. 2014;44:1886–95.. doi: 10.1002/eji.201344279. - DOI - PubMed

Publication types