. 2022 Jun;32(6):570-584.
doi: 10.1038/s41422-022-00651-9. Epub 2022 Apr 22.

Discovery of small-molecule activators of nicotinamide phosphoribosyltransferase (NAMPT) and their preclinical neuroprotective activity

Affiliations

Discovery of small-molecule activators of nicotinamide phosphoribosyltransferase (NAMPT) and their preclinical neuroprotective activity

Hong Yao et al. Cell Res. 2022 Jun.

Abstract

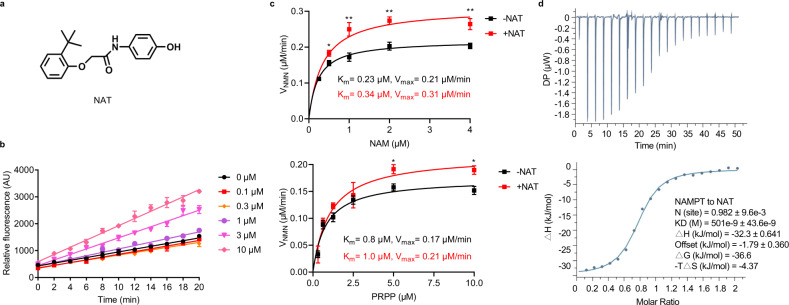
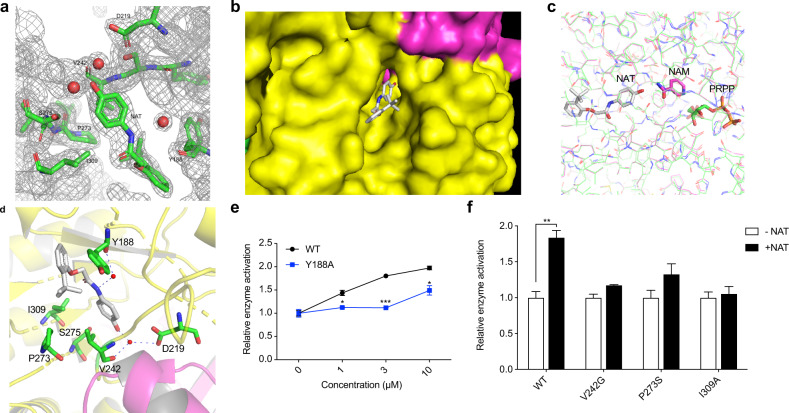
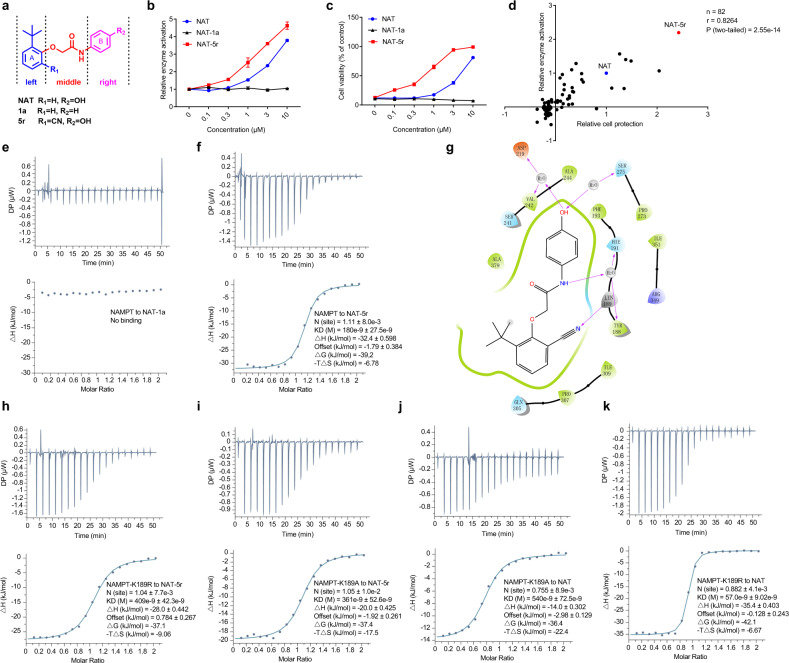
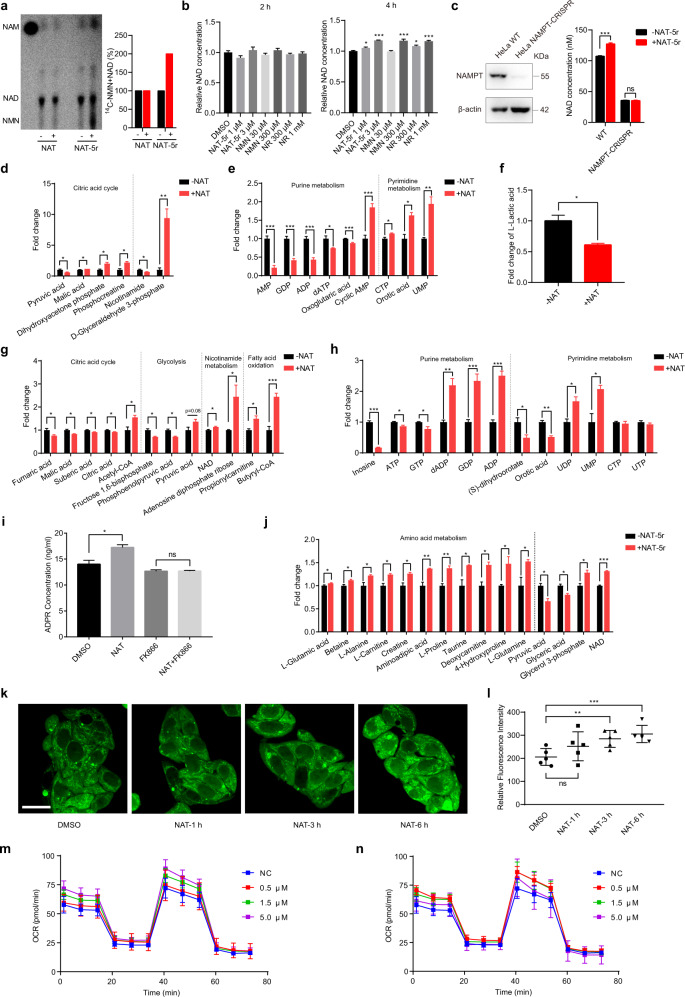
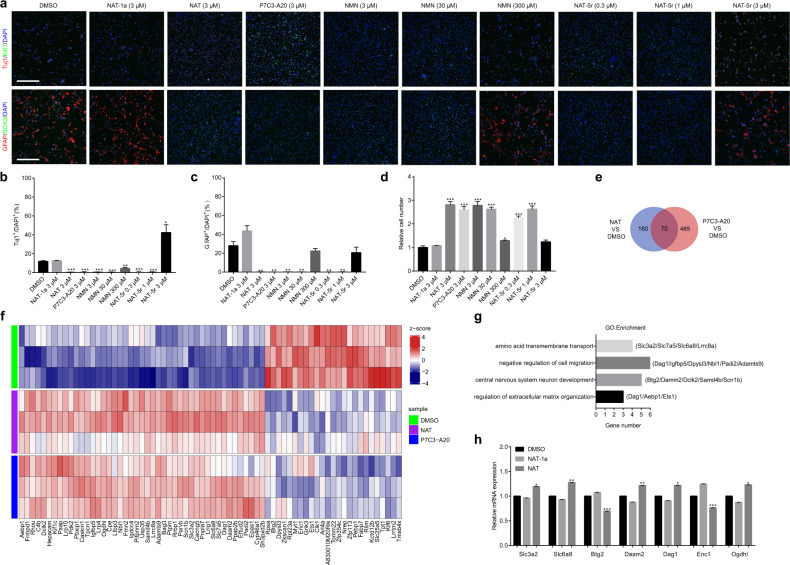
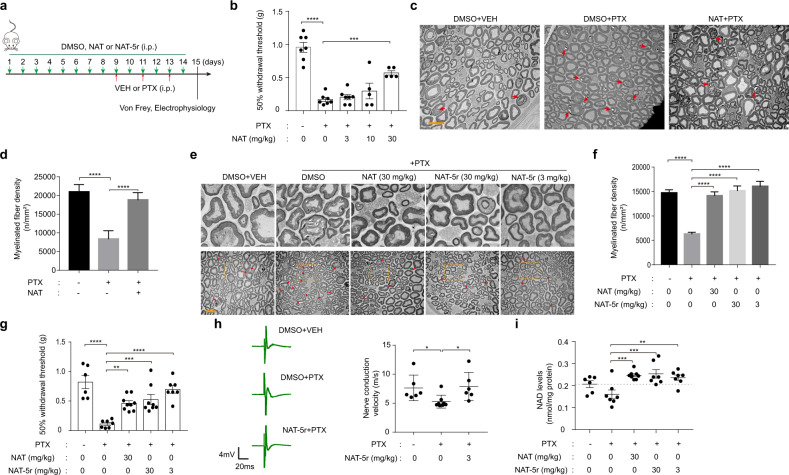
The decline of nicotinamide adenine dinucleotide (NAD) occurs in a variety of human pathologies including neurodegeneration. NAD-boosting agents can provide neuroprotective benefits. Here, we report the discovery and development of a class of potent activators (NATs) of nicotinamide phosphoribosyltransferase (NAMPT), the rate-limiting enzyme in the NAD salvage pathway. We obtained the crystal structure of NAMPT in complex with the NAT, which defined the allosteric action of NAT near the enzyme active site. The optimization of NAT further revealed the critical role of K189 residue in boosting NAMPT activity. NATs effectively increased intracellular levels of NAD and induced subsequent metabolic and transcriptional reprogramming. Importantly, NATs exhibited strong neuroprotective efficacy in a mouse model of chemotherapy-induced peripheral neuropathy (CIPN) without any overt toxicity. These findings demonstrate the potential of NATs in the treatment of neurodegenerative diseases or conditions associated with NAD level decline.


Conflict of interest statement

G.W., Y.T., H.Y., M.L., L.W., C.L., R.Z., Y.Z., C.W., F.L., and S.C. filed a patent application for NAMPT activator NATs. The other authors have no conflicts of interest to declare.

Figures

Fig. 1
Fig. 1. NAT binds and directly activates NAMPT.
a Chemical structure of NAT. b Dose-dependent activation of NAMPT by NAT. A triply-coupled enzyme assay was performed to monitor the conversion of NAM to NADH. The first enzyme, NAMPT, converted NAM to NMN. The second enzyme, NMNAT1, converted NMN to NAD. The third enzyme, ADH, converted NAD to NADH. The reactions were carried out at room temperature for 20 min in the presence of increasing concentrations of NAT. Fluorescence of NADH was measured at Ex340/Em445 (y-axis). Progress curves of the enzyme reactions were plotted and data were analyzed with GraphPad Prism. Data are represented as means ± SEM from three replicates in a representative experiment. n = 3 independent experiments. c Effect of NAT on the NAMPT enzyme kinetics in the direct NAMPT assay. Michaelis–Menten curves for NAMPT reactions were plotted in the presence or absence of 10 μM NAT. The velocity of NMN production is shown on the y-axis as a function of substrate concentration (x-axis). Upper panel: Michaelis–Menten curves to determine the kinetic parameters for substrate NAM. Reactions contained the indicated concentrations of NAM and 10 μM PRPP. Lower panel: Michaelis–Menten curves to determine the kinetic parameters for substrate PRPP. Reactions contained the indicated concentrations of PRPP and 5 μM NAM. Vmax, maximum reaction rate; Km, substrate affinity. All error bars represent SEM from three replicates. Two-tailed t-test, *P < 0.05, **P < 0.01. d Binding of NAT to recombinant NAMPT as measured by isothermal titration calorimetry (ITC). A total of 200 μM recombinant NAMPT was titrated into the sample cell containing 20 μM NAT. The data shown here is a representative figure from three independent experiments. Top panel, the integrated heat signatures. Bottom panel, the fitted curves using one-site mode. KD, the dissociation constant; ΔG, change in Gibbs energy of binding; ΔH enthalpy; -TΔS, the entropy contribution to Gibbs energy; N, stoichiometry. Data were analyzed with MicroCal PEAQ-ITC Analysis software.
Fig. 2
Fig. 2. X-ray crystal structure of purified, recombinant NAMPT bound to the NAT chemical.
a The 2Fo-Fc electron density map for NAT and its surrounding molecules at 2.2 Å resolution. The contour level is at 1 σ. b A surface display for the NAT-binding at the dimer interface of NAMPT. NAT is shown as sticks in gray. Two monomers of NAMPT are colored in yellow and rose, respectively. c Comparison of the binding site of NAT on NAMPT with that of NAM and PRPP. NAT and the corresponding NAMPT protein structure are shown in gray. NAM, rose; PRPP, green. d Ribbon diagram showing the NAT-binding site of NAMPT. NAT is shown as sticks in gray with hydrogen bonds represented as dashed lines. The water molecules are shown as small red spheres. The nearby residues are shown as sticks in green. The two NAMPT monomers are colored yellow and pink, respectively. e, f Sensitivity of the wild-type NAMPT and mutants to NAT. Enzyme activity was measured by the direct NAMPT assay. 0.1 μM recombinant protein of wild type NAMPT or mutant Y188A was incubated with the indicated concentrations of NAT (e). The enzyme activities of wild-type or the indicated NAMPT mutants were assayed in the absence or presence of 3 μM NAT (f).
Fig. 3
Fig. 3. Identification of NAT-5r led by a hit-to-lead optimization effort.
a Generalized structure of NATs with three regions denoted. b Dose-dependent activation of NAMPT by NAT and NAT-5r, but not NAT-1a. A triply-coupled NAMPT assay was performed in the presence of the indicated concentration of the compounds. Reaction rates were normalized to the vehicle control. Data were analyzed and dose-response curves were plotted with GraphPad Prism software. All error bars represent SEM from three replicates. c, d NATs relieve the cytotoxicity mediated by a NAMPT inhibitor FK866. c U2OS cells were treated with increasing concentrations of NAT, NAT-1a, or NAT-5r for 2 h prior to incubation with 10 nM FK866 for 72 h (n = 3 biological replicates). Cell viability is calculated by comparing the cell survival of each sample with that of DMSO-treated control. d Scatterplot reveals a significant correlation between the protective activity of 82 NAT compounds from FK866-mediated toxicity and their ability to activate NAMPT. The activity in both assays is represented by the relative Area Under Curve (AUC) of the dose-response curve of each test compound compared to that of NAT. Pearson correlation coefficient (r) and two-tailed P-value were determined by GraphPad Prism and Spearman Rank Correlation software. See also Supplementary information, Table S2. The binding affinity of NAT-1a (e) or NAT-5r (f) to recombinant NAMPT was measured using ITC as described in Fig. 1d. g Schematic drawing of the interactions between NAT-5r and NAMPT. Two-dimensional ligand-interaction diagrams of the induced fit docking model of NAMPT bound to NAT-5r were generated using Schrodinger Maestro software. Negatively charged residues are colored orange, positively charged residues are colored blue or gray, polar residues are colored light blue, hydrophobic residues are colored green, and water molecules are colored light gray. H-bond interactions to the amino acid side chain or main chain are shown as pink arrows, pointing towards the H-bond acceptor. ITC analysis of binding between NAT-5r and NAMPT-K189R (h) or NAMPT-K189A (i). ITC analysis of binding between NAT and NAMPT-K189A (j) or NAMPT-K189R (k). Top, raw data. Bottom, the integrated heat signatures and fitted curves. KD, the binding constant; ΔG, change in Gibbs energy of binding; ΔH enthalpy; −TΔS, the entropy contribution to Gibbs energy; N, stoichiometry. Data are analyzed with MicroCal PEAQ-ITC Analysis software.
Fig. 4
Fig. 4. NATs enhance NAD salvage and promote dynamic metabolic reprogramming.
a The effect of NATs on the flux of nicotinamide through the salvage pathway. HepG2 cells were pretreated with 5 μM NAT or NAT-5r for 24 h, followed by 4 h treatment with 14C-NAM. Metabolites were extracted and analyzed by thin-layer chromatography. A representative result from two independent experiments is shown. The first lane is the free 14C-NAM as a standard. Quantification of the relative intensities of NAD and NMN from the thin-layer chromatogram is shown in the right panel. b NAD-boosting effects of NAT-5r, NMN, and NR. HepG2 cells were treated with the indicated concentrations of NAT-5r, NMN, or NR for 2 h and 4 h. Cellular NAD was extracted with HCIO4 and measured with fluorometric NAD assay. All error bars represent SEM from three replicates. Two-tailed t-test, *P < 0.05, **P < 0.01, ***P < 0.005. c NAD enhancement induced by NAT-5r is dependent on NAMPT. Left panel, total cell lysates of WT HeLa and NAMPT-CRISPR HeLa were subjected to western blotting with an anti-NAMPT antibody. Actin served as a loading control. Right panel, WT HeLa and NAMPT-CRISPR HeLa cells were treated with DMSO or 10 μM NAT-5r for 6 h before cellular NAD was measured with fluorometric NAD assay. The change of cellular metabolic profile in HepG2 cells treated with NAT for 1.5 h (d–f), NAT for 6 h (g–i), or NAT-5r for 6 h (j). HepG2 cells in a 10-cm cell culture dish were treated with DMSO, 5 μM NAT or NAT-5r. In i, HepG2 cells were treated with either 5 μM NAT or 1 μM FK866 alone or both. Metabolites were extracted by frozen-thaw protocols and measured by mass spectrometry. Data were normalized to DMSO control and analyzed with GraphPad Prism. All error bars represent SEM from three replicates. Two-tailed t-test, *P < 0.05, **P < 0.01, ***P < 0.005. k Fluorescence imaging of fatty acid β-oxidation (FAO) activity in live HepG2 cells. The cells were treated with DMSO, 5 μM NAT for the indicated time before incubation with FAO probe for 30 min in HBS+ buffer at 37 °C. Scale bar, 20 μm. l Statistical analysis of FAO activity in HepG2 cells shown in k. The bar represents means ± SEM, n = 5 fields, **P < 0.01, ***P < 0.005. The OCR in NAT-5r-treated HepG2 cells. The real-time OCR of HepG2 cells treated with the indicated concentration of NAT-5r for 1 h (m) or 3 h (n). Each time point represents 8 replicates with means ± SEM.
Fig. 5
Fig. 5. NATs promote proliferation and maintain the self-renewal of NSCs.
a–d The effects of NATs, P7C3-A20, and NMN on the differentiation and proliferation of NSCs. NSCs were treated with the indicated concentrations of NAT-1a, NAT, P7C3-A20, NMN, or NAT-5r, and cultured in the growth factors drop-out medium for 3 days. a Representative images of NSCs in the differentiation assays. Newly formed neurons are identified as Tuj1+ cells and glial cells as GFAP+ cells. Scale bar, 200 μm. b Quantification of the proportion of Tuj1+ cells. c Quantification of the proportion of GFAP+ cells. d The relative cell number in each sample compared to that of DMSO-treated control. All data are presented as means ± SEM (n = 3 biological replicates, two-tailed t-test). *P < 0.05; **P < 0.01; ***P < 0.005. e NSCs treated with NAT or P7C3-A20 were subjected to RNA-seq analysis for differential expression of genes compared with vehicle control. The Venn chart summarizes the findings as common genes whose expression was significantly changed by both NAT and P7C3-A20 (P < 0.01). f Heatmap of the common genes in e. (n = 3 biological replicates). g GO Enrichment analysis of the common genes in e. h qRT-PCR validation of several genes (Slc3a2, Slc6a8, Btg2, Daam2, Dag1, Enc1, and Ogdhl) from eg. NSCs were treated with DMSO, 3 μM NAT-1a, or NAT (n = 3 biological replicates, two-tailed t-test). Error bars represent SEM. *P < 0.05; **P < 0.01; ***P < 0.005.
Fig. 6
Fig. 6. NAT protects peripheral sensory neurons from paclitaxel-(PTX) induced damage.
a Illustration of the experimental design of the CIPN model. b Mechanical withdrawal threshold of the hind paw of adult male C57BL/6 J mice determined from their response to von Frey filaments. Mice were treated with vehicle (DMSO) or 3 mg/kg, 10 mg/kg, or 30 mg/kg NAT (every day, intraperitoneal injection) for two weeks combined with vehicle or 18.3 mg/kg PTX (intraperitoneal injection) on day 9, 11, and 13. Data represent the mean sensitivity threshold. Bars represent mean ± SEM. Each symbol represents data from an individual mouse (n = 5–7). c Transmission electron microscopy (TEM) images of nerve fibers in the cross-sections of mouse sciatic nerves. Mice were treated with vehicle or 30 mg/kg NAT combined with vehicle or PTX. Red arrows indicate the injured nerve fiber. Scale bar, 10 μm. d Quantification of the density of the intact nerve fibers in the TEM images in c. Data represent mean fiber density. Bars represent means ± SEM. e TEM images of the cross-sections of mouse sciatic nerves. Mice were treated with vehicle or 30 mg/kg NAT, 3 mg/kg NAT-5r, or 30 mg/kg NAT-5r in combination with vehicle or PTX. Arrows indicate the injured nerve fiber. Scale bar, 10 μm. The upper images are the magnified TEM image from the indicated regions within the boxes on the corresponding lower images. f Quantification of the myelinated fiber density in the TEM images in e. Data represent mean fiber density. Bars represent means ± SEM. g Paw withdrawal threshold of adult male C57BL/6J mice treated as in e. Data represent the mean sensitivity threshold. Bars represent means ± SEM. Each symbol represents data from an individual mouse (n = 6–9). h Sciatic nerve conduction velocity (NCV) of adult male C57BL/6J mice treated with vehicle or 3 mg/kg NAT-5r in combination with vehicle or PTX. Left panel, representative recording of nerve action potentials. Right panel, the mean NCV. Each symbol represents data from an individual mouse (n = 6–8). Bars represent means ± SEM. i Tissue NAD levels of the sciatic nerves of adult male C57BL/6 J mice treated as in e. Data represent the mean NAD levels. Bars represent the means ± SEM. Each symbol represents data from an individual mouse (n = 6–9). *P < 0.05; **P < 0.01; ***P < 0.005; ****P < 0.001 vs PTX-only treatment group, determined by one-way ANOVA and Dunnett’s multiple comparisons test.

References

    1. Yang Y, Sauve AA. NAD(+) metabolism: bioenergetics, signaling and manipulation for therapy. Biochim. Biophys. Acta. 2016;1864:1787–1800. doi: 10.1016/j.bbapap.2016.06.014. - DOI - PMC - PubMed
    1. Verdin E. NAD(+) in aging, metabolism, and neurodegeneration. Science. 2015;350:1208–1213. doi: 10.1126/science.aac4854. - DOI - PubMed
    1. Preiss J, Handler P. Biosynthesis of diphosphopyridine nucleotide. I. Identification of intermediates. J. Biol. Chem. 1958;233:488–492. doi: 10.1016/S0021-9258(18)64789-1. - DOI - PubMed
    1. Bogan KL, Brenner C. Nicotinic acid, nicotinamide, and nicotinamide riboside: a molecular evaluation of NAD+ precursor vitamins in human nutrition. Annu. Rev. Nutr. 2008;28:115–130. doi: 10.1146/annurev.nutr.28.061807.155443. - DOI - PubMed
    1. Revollo JR, Grimm AA, Imai S. The NAD biosynthesis pathway mediated by nicotinamide phosphoribosyltransferase regulates Sir2 activity in mammalian cells. J. Biol. Chem. 2004;279:50754–50763. doi: 10.1074/jbc.M408388200. - DOI - PubMed

Publication types

MeSH terms