

In vitro measurements of radiation exposure with different modalities (computed tomography, cone beam computed tomography) for imaging the petrous bone with a pediatric anthropomorphic phantom
- PMID: 35460347
- PMCID: PMC9107409
- DOI: 10.1007/s00247-022-05308-8
In vitro measurements of radiation exposure with different modalities (computed tomography, cone beam computed tomography) for imaging the petrous bone with a pediatric anthropomorphic phantom
Abstract
Background: Various imaging modalities, such as multi-detector computed tomography (CT) and cone beam CT are commonly used in infants for the diagnosis of hearing loss and surgical planning of implantation hearing aid devices, with differing results.
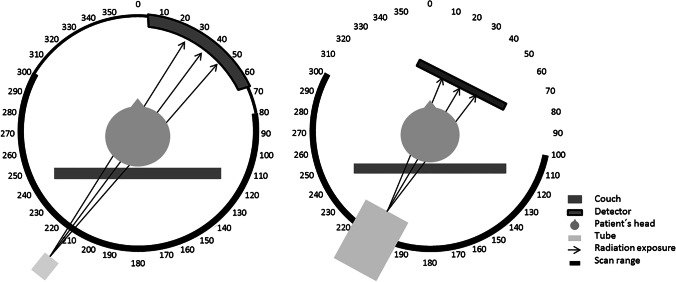
Objective: We compared three different imaging modalities available in our institution, including a high-class CT scanner, a mid-class CT scanner and an angiography system with a cone beam CT option, for image quality and radiation exposure in a phantom study.
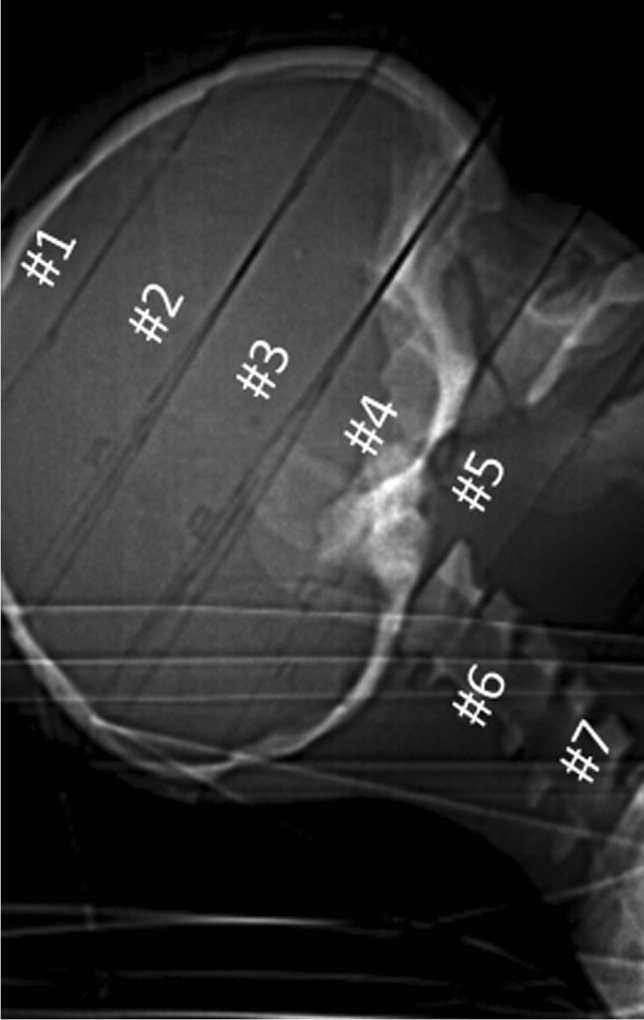
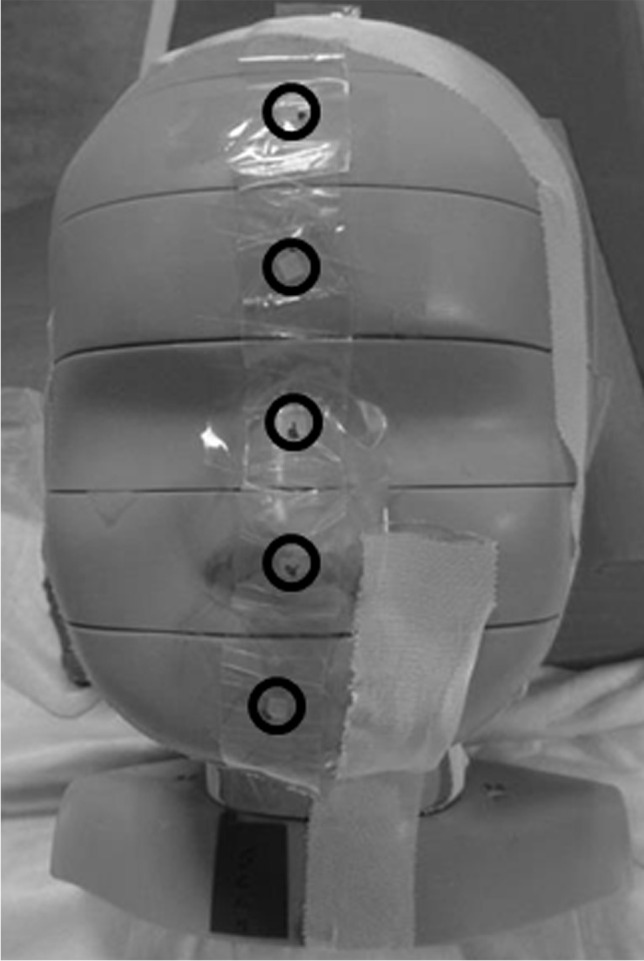
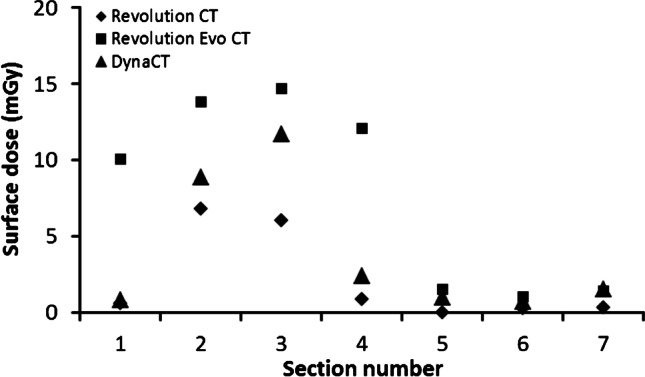
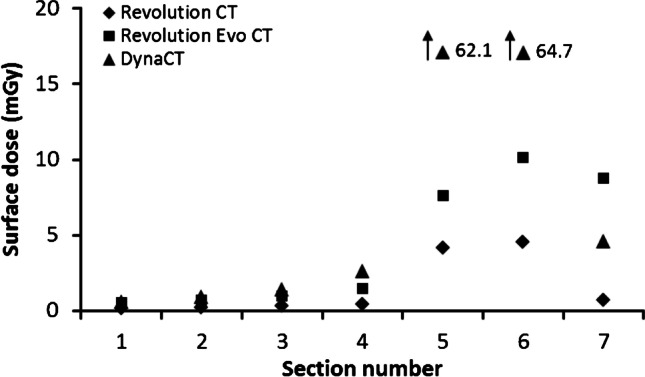
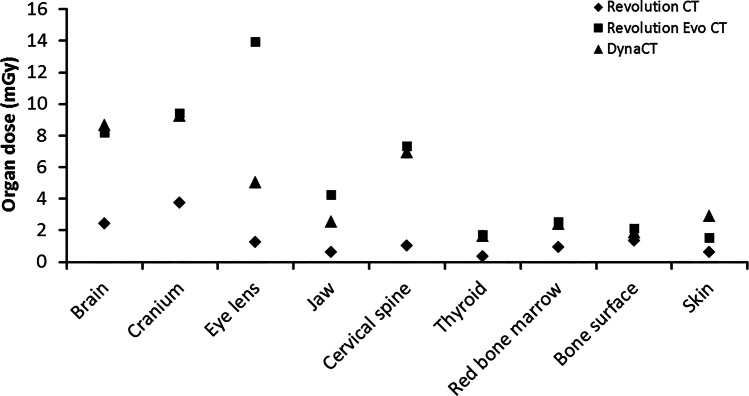
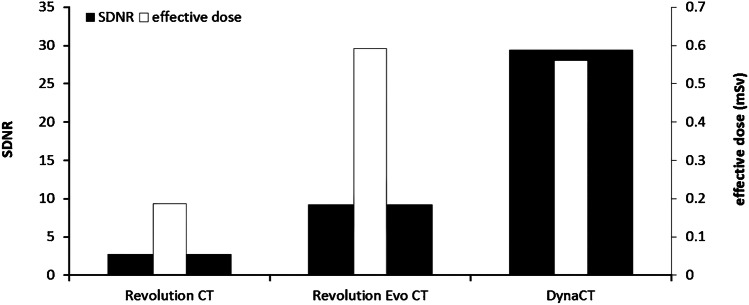
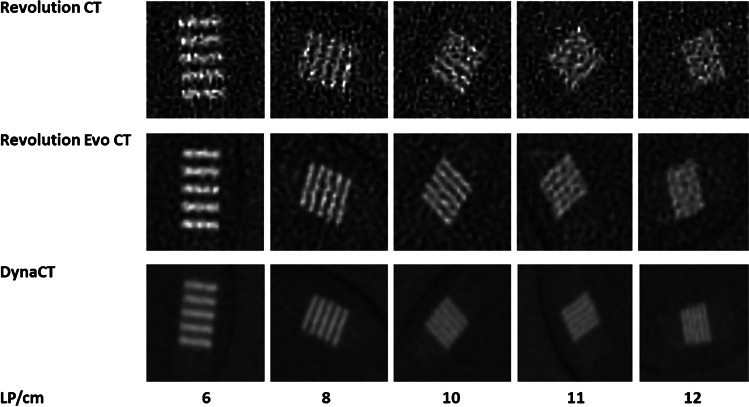
Materials and methods: While scanning an anthropomorphic phantom imitating a 1-year-old child with vendor-provided routine protocols, organ doses, surface doses and effective doses were determined for these three modalities with thermoluminescent dosimeters. The image quality was evaluated using the signal difference to noise ratio (SDNR) and the spatial resolution of a line-pair insert in the phantom head. The dose efficiency, defined as the ratio of SDNR and effective dose, was also compared.
Results: The organ and surface doses were lowest with the high-class CT protocol, but the image quality was the worst. Image quality was best with the cone beam CT protocol, which, however, had the highest radiation exposure in this study, whereas the mid-class CT was in between.
Conclusion: Based on our results, high-end CT should be used for surgical planning because it has the lowest dose, while the image quality is still sufficient for this purpose. However, if highest image quality is needed and required, e.g., by ENT surgeons, the other modalities should be considered.
Keywords: Children; Cochlear implantation; Computed tomography; Cone beam computed tomography; Petrous bone; Radiation exposure.
© 2022. The Author(s).
Conflict of interest statement
None
Figures


References
-
- Davidson HC (2002) Imaging of the temporal bone. Magn Reson Imaging Clin N Am 10:573–613 - PubMed
-
- General Electric Company W, USA (2017) Revolution™ CT, Revolution™ CT ES Technisches Referenzhandbuch. 5763055-1DE (provided by the company on request)
MeSH terms
LinkOut - more resources
Full Text Sources
Research Materials
Miscellaneous
