. 2022 Apr 11;39(4):msac076.
doi: 10.1093/molbev/msac076.

Disentangling Signatures of Selection Before and After European Colonization in Latin Americans

Affiliations

Disentangling Signatures of Selection Before and After European Colonization in Latin Americans

Javier Mendoza-Revilla et al. Mol Biol Evol. .

Abstract

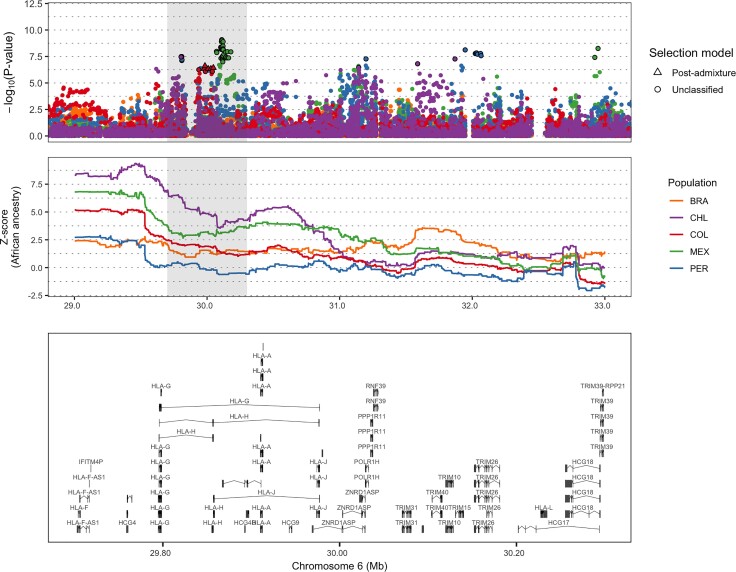
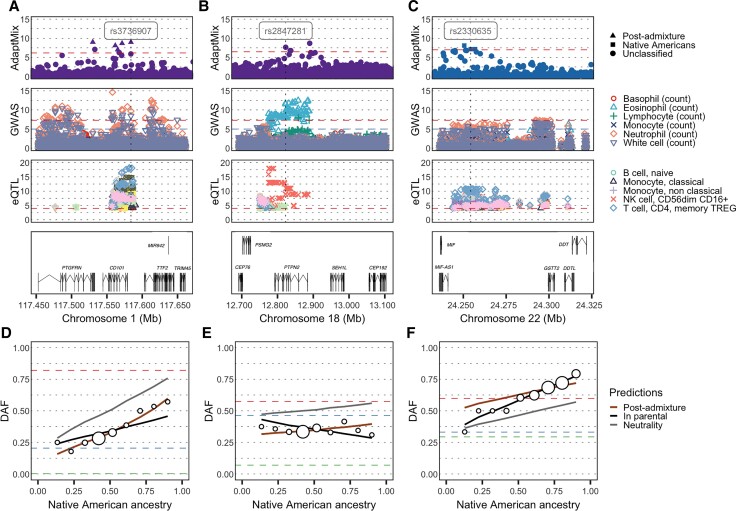
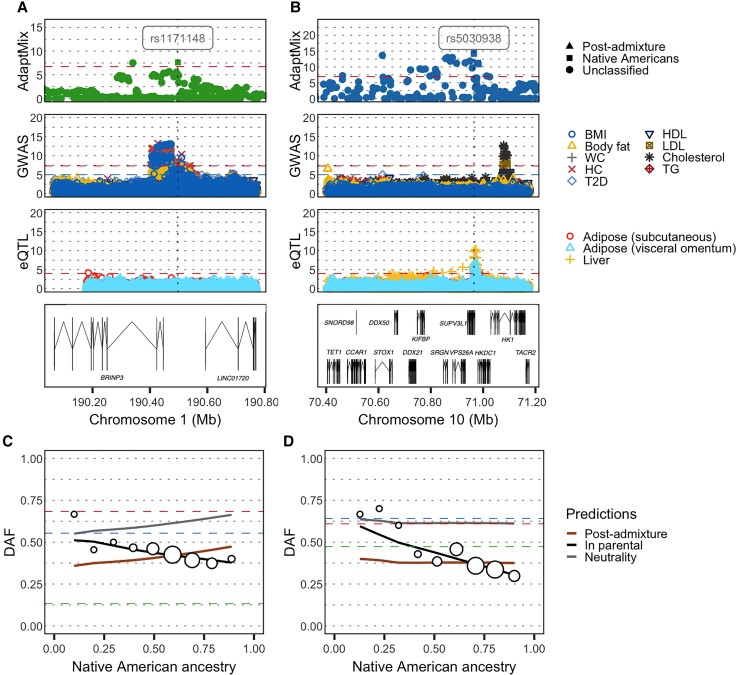
Throughout human evolutionary history, large-scale migrations have led to intermixing (i.e., admixture) between previously separated human groups. Although classical and recent work have shown that studying admixture can yield novel historical insights, the extent to which this process contributed to adaptation remains underexplored. Here, we introduce a novel statistical model, specific to admixed populations, that identifies loci under selection while determining whether the selection likely occurred post-admixture or prior to admixture in one of the ancestral source populations. Through extensive simulations, we show that this method is able to detect selection, even in recently formed admixed populations, and to accurately differentiate between selection occurring in the ancestral or admixed population. We apply this method to genome-wide SNP data of ∼4,000 individuals in five admixed Latin American cohorts from Brazil, Chile, Colombia, Mexico, and Peru. Our approach replicates previous reports of selection in the human leukocyte antigen region that are consistent with selection post-admixture. We also report novel signals of selection in genomic regions spanning 47 genes, reinforcing many of these signals with an alternative, commonly used local-ancestry-inference approach. These signals include several genes involved in immunity, which may reflect responses to endemic pathogens of the Americas and to the challenge of infectious disease brought by European contact. In addition, some of the strongest signals inferred to be under selection in the Native American ancestral groups of modern Latin Americans overlap with genes implicated in energy metabolism phenotypes, plausibly reflecting adaptations to novel dietary sources available in the Americas.

Keywords: Latin Americans; Native Americans; admixture; natural selection.


Figures

Fig. 1.
Fig. 1.
Schematic and intuition of the AdaptMix model. (A) For each CANDELA individual (columns), ADMIXTURE-inferred proportions of ancestry related to Native American, European, and African reference individuals. (B) Assuming only two admixing sources in this illustration for simplicity, the model assumes ancestral populations (A* and B*) contribute ancestry proportions αA and αB, respectively, to an admixed population (C) that is ancestral to the tested population (C). Assuming neutrality, the expected allele frequency (p0) of C is estimated using these proportions and the allele frequencies surrogate populations A and B related to A* and B*, respectively. The sampled allele frequency (p) of C is compared with p0, with large deviations indicative of selection (shown with an asterisk in the distribution). (c and d) The relationship between p0, the expected allele frequency in the admixed population under neutrality or selection, and αB, the ancestry proportion contributed from ancestral population B*. If selection occurred prior to admixture during the split between populations B* and its surrogate B (i.e., along the blue branch in [B]), this relationship increases linearly (blue lines), becoming more differentiated from neutrality (gray line) as the admixture from B* increases. In contrast, under selection post-admixture (i.e., along the purple branch in [B]), the expected allele frequency (purple lines) can deviate from neutrality even when the admixture from B* is near 0. The difference between the post-admixture and pre-admixture lines is more clear when allele frequencies in populations A and B are similar (top plot). The solid blue and red lines indicate the allele frequencies in the surrogate populations A and B, which are used to calculate p0.
Fig. 2.
Fig. 2.
Performance of AdaptMix to detect and classify selection in simulated Latin American populations. (A) Power to detect selection post-admixture, selection in Native Americans, or selection in Europeans in simulated populations mimicking the Latin American cohorts. Power is based on a P value cutoff that resulted in a false-positive rate of 5 × 10−5 in neutral simulations. The power estimated for a given selection coefficient is based on combining simulations using four different modes of selection (additive, dominant, multiplicative, recessive) occurring over 12 generations for the post-admixture simulations, over 50 generations for the selection in Native American simulations, and over 25 generations for the selection in European simulations. Each simulation for a given combination of parameters consisted of 10,000 advantageous SNPs with a starting allele frequency of the advantageous allele lower than 0.5. (B) The proportion of significant SNPs from (A) that were assigned to the correct simulated scenario of (left-to-right) post-admixture selection or selection in Native Americans or Europeans (using a likelihood ratio >1,000 to make a call; otherwise “Unclassified”). Rows give the true selection coefficient (legend at right), and the heatmap values give the classification rate. Rows with N.A. show instances with less than 50 selected SNPs for which the classification rate is poorly estimated.
Fig. 3.
Fig. 3.
Performance of AdaptMix compared with existing methods. (A) Power of AdaptMix and Ohana to detect selection occurring prior to admixture only in the Native American source of an admixed population. The gray line depicts Ohana’s power with K = 4 when testing for selection only in the ancestry component most representative of the Native American source, with the brown line testing under the general model. (B) Power of AdaptMix, Ohana, and two LAD approaches (RFMix, ELAI; Maples et al 2013, Guan 2014) to detect selection occurring in an admixed population directly following the admixture event. The purple line depicts Ohana’s power with K = 3 when testing for selection only in the ancestry component most representative of the admixed population, with the green line testing under the general model. See Methods section for a detailed explanation of the simulation parameters employed for each scenario. Power for (A) and (B) is based on a P value cutoff that resulted in a false-positive rate of 0.05 in neutral simulations.
Fig. 4.
Fig. 4.
Genome-wide selection scan in five Latin American cohorts. Manhattan plot showing the genomic regions identified as selected via AdaptMix in each Latin American cohort. The dashed horizontal lines indicate the P values cutoffs corresponding to a false-positive rate of 5 × 10−5 based on neutral simulations. Different shapes represent the most likely selection model. The names of genes associated with significant SNPs are shown.
Fig. 5.
Fig. 5.
Regional selection plot at the HLA region in five Latin American cohorts. The top plot shows the −log10(P values) of SNPs from AdaptMix, the middle plot shows Z-score values based on African LADs, and the bottom plot shows genes in the region shaded in gray. Genomic coordinates are in Mb (build hg19 as reference) and genes shown include transcripts.
Fig. 6.
Fig. 6.
Genetic loci with signals of selection at immune-related genes. (A), (B) and (C) Regional selection plot at three candidate regions of selection encompassing two immune-related genes in the Chilean and one immune-related gene in the Peruvian cohort. Each plot is composed of four panels (rows), consisting of −log10(P values) of SNPs: (row 1) from AdaptMix; (row 2) associated with immune-related cell counts via GWAS (Chen et al 2020); (row 3) associated (as expression quantitative trait loci [eQTLs]) with expression of genes CD101, PTPN2, and MIF for (A)–(C), respectively (Schmiedel et al. 2018); with (row 4) depicting genes in the region (in Mb, build hg19 as reference. The horizontal dashed lines give significance thresholds of (row 1) P value = 1 × 10−5 based on neutral simulations (row 2) P value = 1 × 10−5 (blue line) and P value = 5 × 10−8 (red line), and (row 3) P value = 1 × 10−4. (D), (E) and (F) Derived allele frequency (DAF) in admixed Latin Americans (white circles) stratified by proportion of inferred Native American ancestry, for the SNPs highlighted (vertical dashed line) in top row panels. The sizes of the circles are proportional to the number of individuals in that particular bin. The lines give expected DAF under neutrality (gray), post-admixture selection (brown), or selection in the Native source (black). The horizontal dashed red, blue, and green lines depict DAF for surrogates to Native American, European, and African sources, respectively. AdaptMix’s conclusions for these SNPs are selection that is (D) post-admixture, (E) unclassified, and (F) pre-admixture in the Native American source.
Fig. 7.
Fig. 7.
Genetic loci with signals of selection at metabolic-related genes. (A) and (B) Regional selection plot at two candidate regions of selection encompassing metabolic-related genes in the Mexican and Peruvian cohorts, respectively. Each plot is composed of four panels consisting of −log10(P values) of SNPs: (row 1) from AdaptMix; (row 2) from the UK Biobank GWAS; (row 3) associated (as eQTLs) with expression of BRINP3 and HKDC1 for (A)–(B), respectively, (GTEx eQTL study); with (row 4) depicting genes in the region (in Mb, build hg19 as reference). The horizontal dashed lines give significance thresholds of (row 1) P value = 1 × 10−5 based on neutral simulations (row 2) P value = 1 × 10−5 (blue line) and P value = 5 × 10−8 (red line), and (row 3) P value = 1 × 10−4. (C) and (D) Derived allele frequency (DAF) in admixed Latin Americans (white circles) stratified by the proportion of inferred Native American ancestry, for the SNPs highlighted (vertical dashed line) in top row panels, both of which were classified as reflecting selection in the Native American source. The sizes of the circles are proportional to the number of individuals in that particular bin. The lines give expected DAF under neutrality (gray), post-admixture selection (brown), or selection in the Native American source (black). The horizontal dashed red, blue, and green lines depict DAF for surrogates to Native American, European, and African sources, respectively. AdaptMix's conclusions for these SNPs are selection that is pre-admixture in the Native American source for (C) and (D).

References

    1. Cavalli-Sforza LL editor.; 1969.
    1. The 1000 Genomes Project Consortium . 2015. A global reference for human genetic variation. Nature 526:68–74. - PMC - PubMed
    1. Acuña-Alonzo V, Flores-Dorantes T, Kruit JK, Villarreal-Molina T, Arellano-Campos O, Hünemeier T, Moreno-Estrada A, Ortiz-López MG, Villamil-Ramírez H, León-Mimila P, et al. . 2010. A functional ABCA1 gene variant is associated with low HDL-cholesterol levels and shows evidence of positive selection in Native Americans. Hum Mol Genet. 19:2877–2885. - PMC - PubMed
    1. Akaike H. 1974. A new look at the statistical model identification. IEEE Trans Automatic Control 19:716–723.
    1. Alexander DH, Novembre J, Lange K. 2009. Fast model-based estimation of ancestry in unrelated individuals. Genome Res. 19:1655–1664. - PMC - PubMed

Publication types