

Imaging biomarkers of TERT or GABPB1 silencing in TERT-positive glioblastoma
- PMID: 35460557
- PMCID: PMC9629440
- DOI: 10.1093/neuonc/noac112
Imaging biomarkers of TERT or GABPB1 silencing in TERT-positive glioblastoma
Abstract
Background: TERT promoter mutations are observed in 80% of wild-type IDH glioblastoma (GBM). Moreover, the upstream TERT transcription factor GABPB1 was recently identified as a cancer-specific therapeutic target for tumors harboring a TERT promoter mutation. In that context, noninvasive imaging biomarkers are needed for the detection of TERT modulation.
Methods: Multiple GBM models were investigated as cells and in vivo tumors and the impact of TERT silencing, either directly or by targeting GABPB1, was determined using 1H and hyperpolarized 13C magnetic resonance spectroscopy (MRS). Changes in associated metabolic enzymes were also investigated.
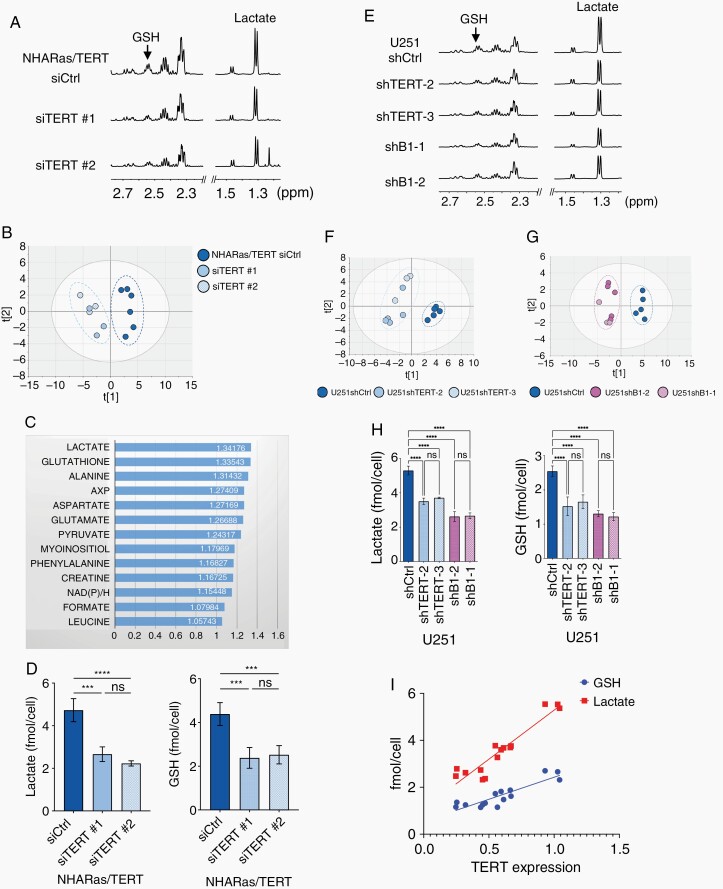
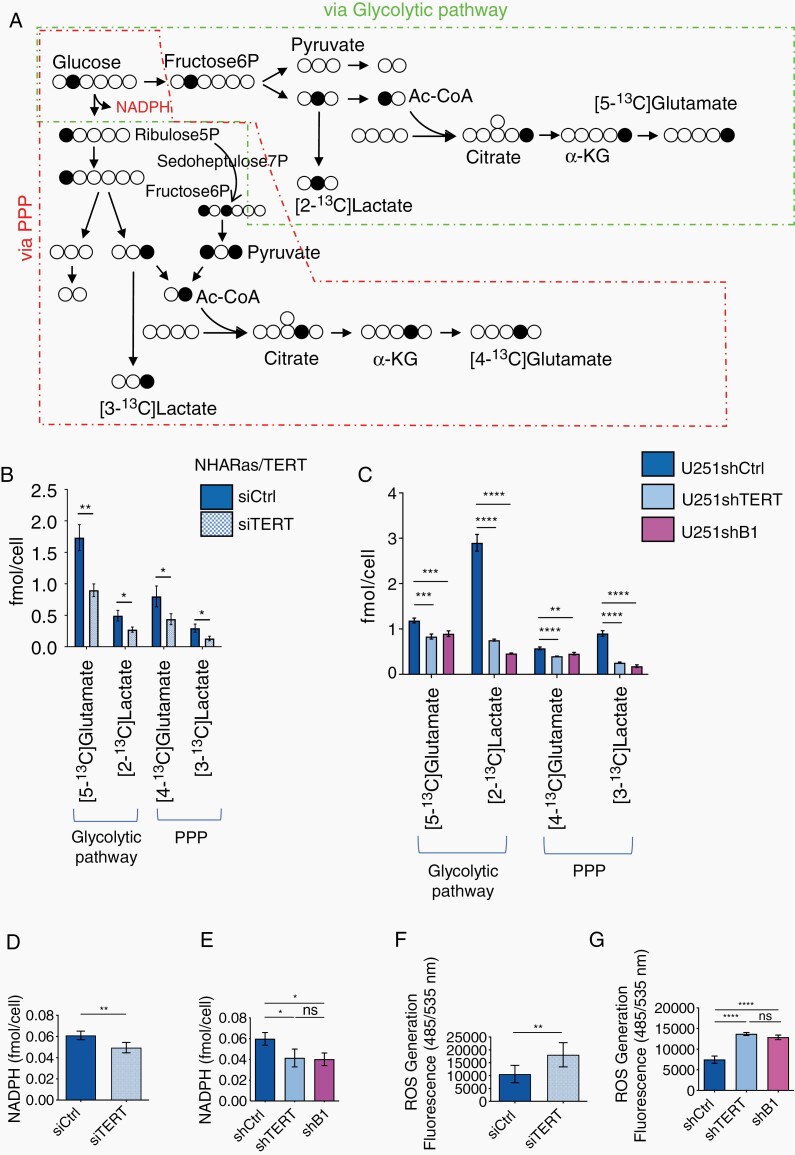
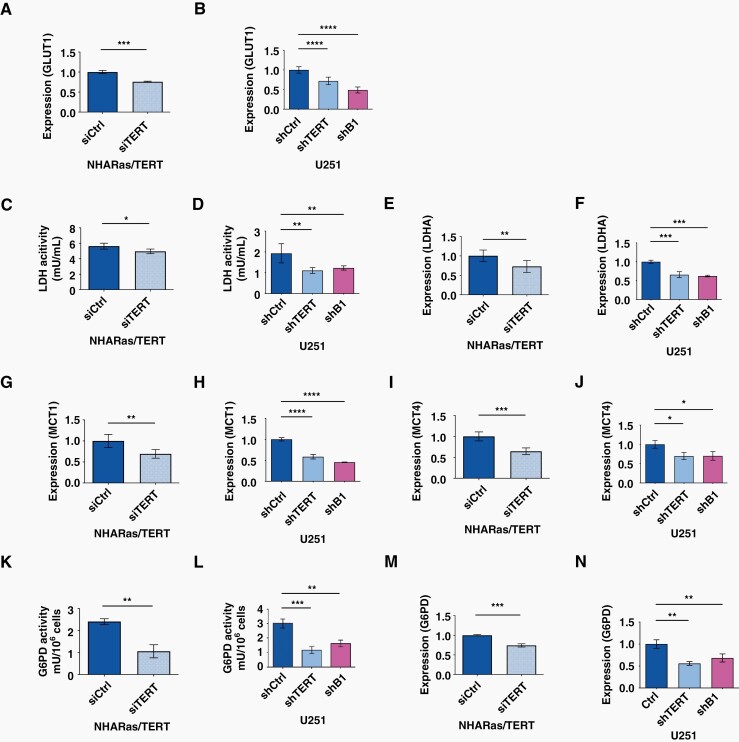
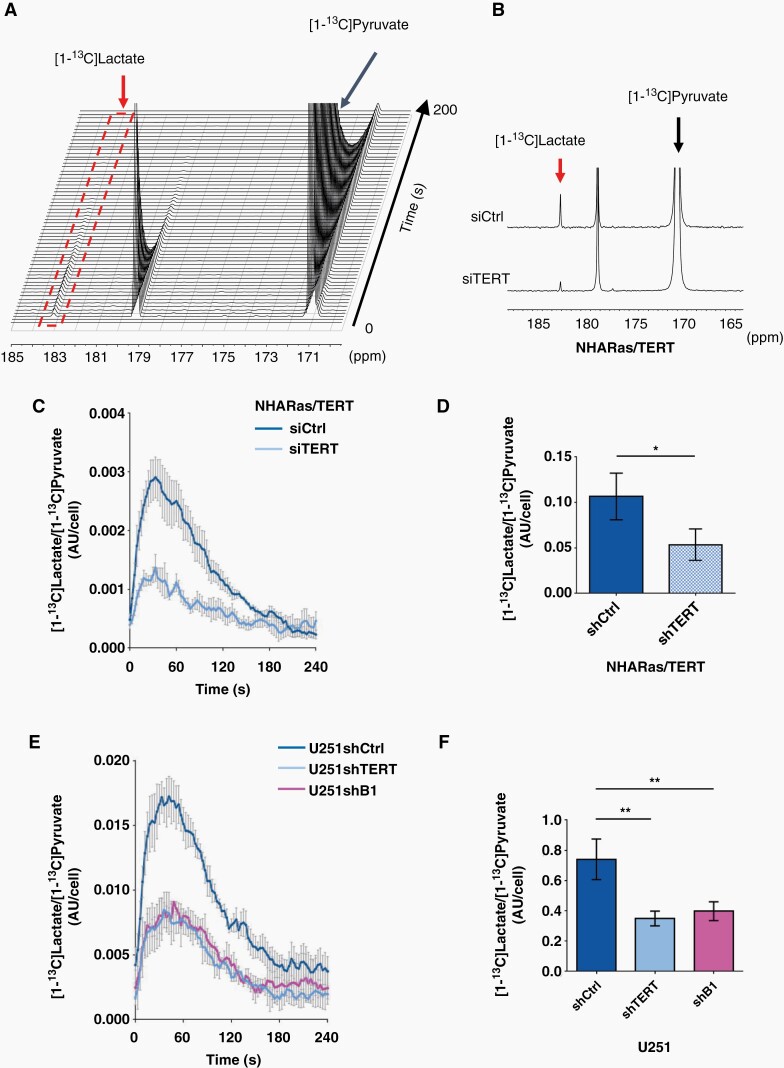
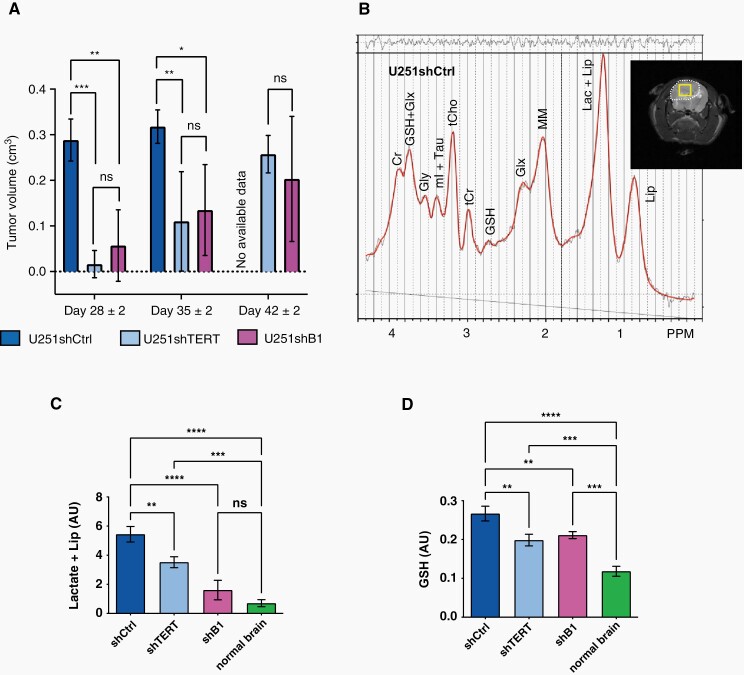
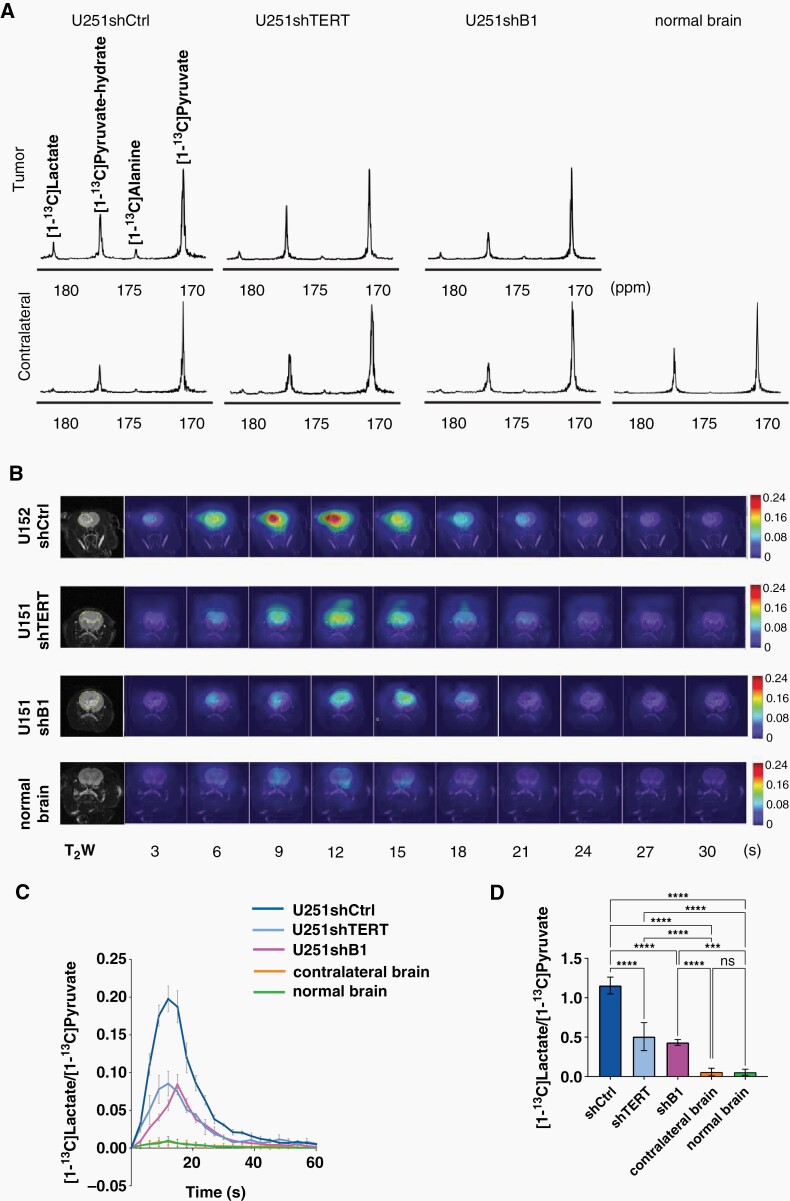
Results: 1H-MRS revealed that lactate and glutathione (GSH) were the most significantly altered metabolites when either TERT or GABPB1 was silenced, and lactate and GSH levels were correlated with cellular TERT expression. Consistent with the drop in lactate, 13C-MRS showed that hyperpolarized [1-13C]lactate production from [1-13C]pyruvate was also reduced when TERT was silenced. Mechanistically, the reduction in GSH was associated with a reduction in pentose phosphate pathway flux, reduced activity of glucose-6-phosphate dehydrogenase, and reduced NADPH. The drop in lactate and hyperpolarized lactate were associated with reductions in glycolytic flux, NADH, and expression/activity of GLUT1, monocarboxylate transporters, and lactate dehydrogenase A.
Conclusions: Our study indicates that MRS-detectable GSH, lactate, and lactate production could serve as metabolic biomarkers of response to emerging TERT-targeted therapies for GBM with activating TERT promoter mutations. Importantly these biomarkers are readily translatable to the clinic, and thus could ultimately improve GBM patient management.
Keywords: (MRS); glioblastoma; hyperpolarized 13C-MRS; imaging biomarkers; magnetic resonance spectroscopy; metabolism.
© The Author(s) 2022. Published by Oxford University Press on behalf of the Society for Neuro-Oncology. All rights reserved. For permissions, please e-mail: journals.permissions@oup.com.
Figures
Similar articles
-
Imaging the effects of treatment with TERT and EGFR inhibitors on glioblastoma: An MR study.Neurooncol Adv. 2025 Apr 17;7(1):vdaf078. doi: 10.1093/noajnl/vdaf078. eCollection 2025 Jan-Dec. Neurooncol Adv. 2025. PMID: 40463649 Free PMC article.
-
Hyperpolarized δ-[1- 13C]gluconolactone imaging visualizes response to TERT or GABPB1 targeting therapy for glioblastoma.Sci Rep. 2023 Mar 30;13(1):5190. doi: 10.1038/s41598-023-32463-1. Sci Rep. 2023. PMID: 36997627 Free PMC article.
-
Hyperpolarized (13)C MR imaging detects no lactate production in mutant IDH1 gliomas: Implications for diagnosis and response monitoring.Neuroimage Clin. 2016 Jun 23;12:180-9. doi: 10.1016/j.nicl.2016.06.018. eCollection 2016. Neuroimage Clin. 2016. PMID: 27437179 Free PMC article.
-
MR Molecular Imaging of Brain Cancer Metabolism Using Hyperpolarized 13C Magnetic Resonance Spectroscopy.Top Magn Reson Imaging. 2016 Oct;25(5):187-196. doi: 10.1097/RMR.0000000000000104. Top Magn Reson Imaging. 2016. PMID: 27748711 Free PMC article. Review.
-
Hyperpolarized MRI - An Update and Future Perspectives.Semin Nucl Med. 2022 May;52(3):374-381. doi: 10.1053/j.semnuclmed.2021.09.001. Epub 2021 Nov 14. Semin Nucl Med. 2022. PMID: 34785033 Review.
Cited by
-
Understanding the immunosuppressive microenvironment of glioma: mechanistic insights and clinical perspectives.J Hematol Oncol. 2024 May 8;17(1):31. doi: 10.1186/s13045-024-01544-7. J Hematol Oncol. 2024. PMID: 38720342 Free PMC article. Review.
-
Prediction of TERT mutation status in gliomas using conventional MRI radiogenomic features.Front Neurol. 2024 Jul 26;15:1439598. doi: 10.3389/fneur.2024.1439598. eCollection 2024. Front Neurol. 2024. PMID: 39131044 Free PMC article.
-
Single-cell RNA sequencing in human atherosclerotic plaques reveals a novel smooth muscle cell subtype that possesses multi differentiation potential and shapes the microenvironment.Clin Exp Med. 2025 Jul 16;25(1):251. doi: 10.1007/s10238-025-01735-7. Clin Exp Med. 2025. PMID: 40668312 Free PMC article.
-
[Research Progress in Imaging Investigation of TERT Promoter Mutations in Gliomas].Sichuan Da Xue Xue Bao Yi Xue Ban. 2024 Nov 20;55(6):1350-1356. doi: 10.12182/20241160501. Sichuan Da Xue Xue Bao Yi Xue Ban. 2024. PMID: 39990854 Free PMC article. Review. Chinese.
-
Imaging the effects of treatment with TERT and EGFR inhibitors on glioblastoma: An MR study.Neurooncol Adv. 2025 Apr 17;7(1):vdaf078. doi: 10.1093/noajnl/vdaf078. eCollection 2025 Jan-Dec. Neurooncol Adv. 2025. PMID: 40463649 Free PMC article.
References
-
- Vinagre J, Almeida A, Populo H, et al. . Frequency of TERT promoter mutations in human cancers. Nat Commun. 2013; 4:2185. - PubMed
-
- Arita H, Narita Y, Fukushima S, et al. . Upregulating mutations in the TERT promoter commonly occur in adult malignant gliomas and are strongly associated with total 1p19q loss. Acta Neuropathol. 2013; 126(2):267–276. - PubMed
-
- Korber V, Yang J, Barah P, et al. . Evolutionary trajectories of IDH(WT) glioblastomas reveal a common path of early tumorigenesis instigated years ahead of initial diagnosis. Cancer Cell. 2019; 35(4):692–704.e12. - PubMed
