. 2022 May 12;185(10):1728-1744.e16.
doi: 10.1016/j.cell.2022.03.044. Epub 2022 Apr 1.

Circular RNA vaccines against SARS-CoV-2 and emerging variants

Affiliations

Circular RNA vaccines against SARS-CoV-2 and emerging variants

Liang Qu et al. Cell. .

Abstract

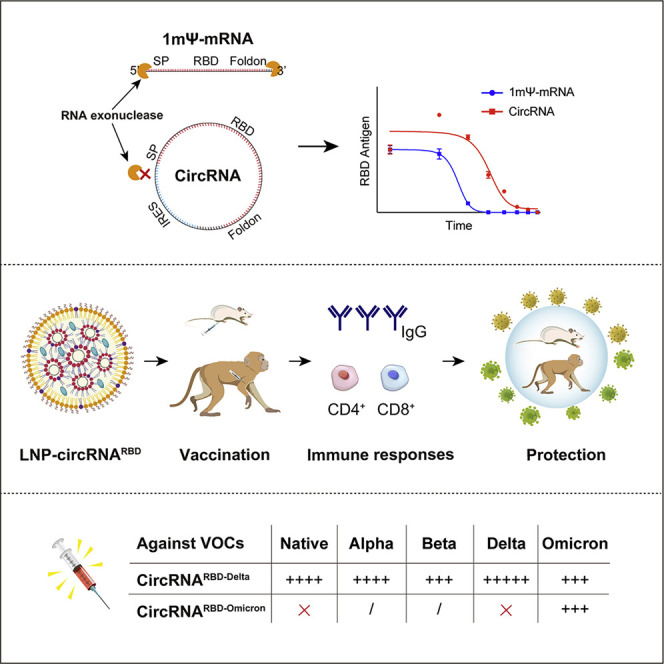
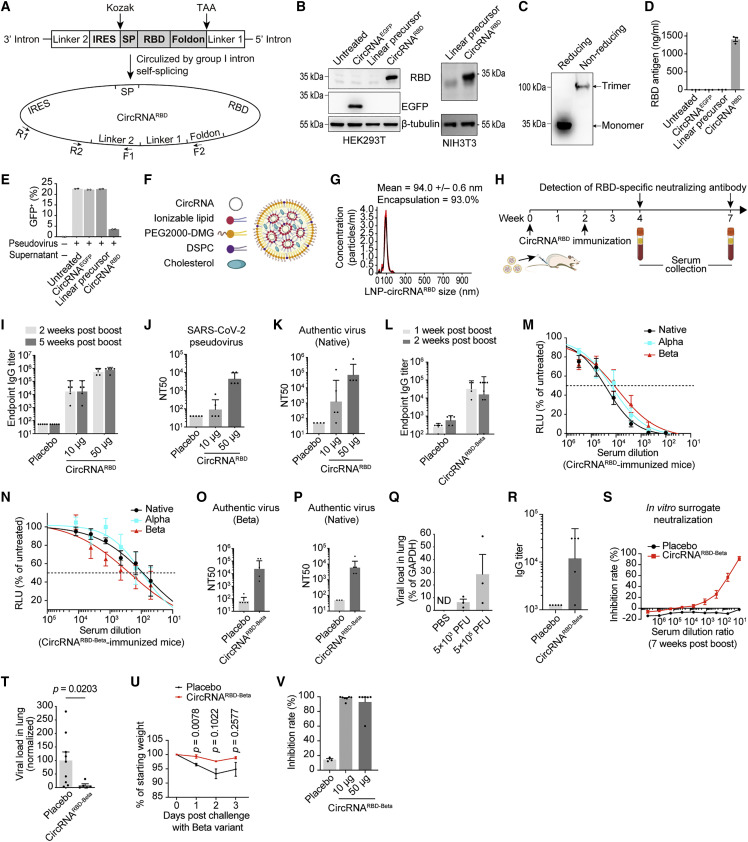
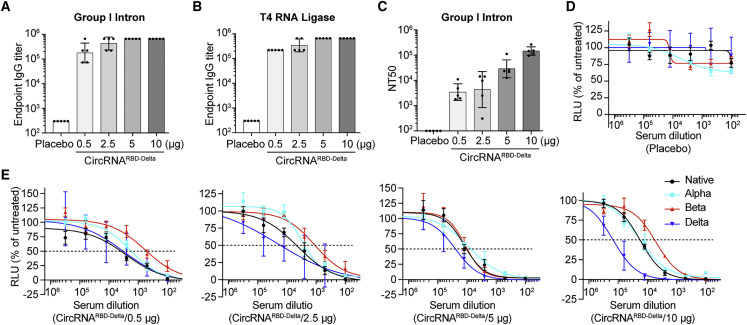
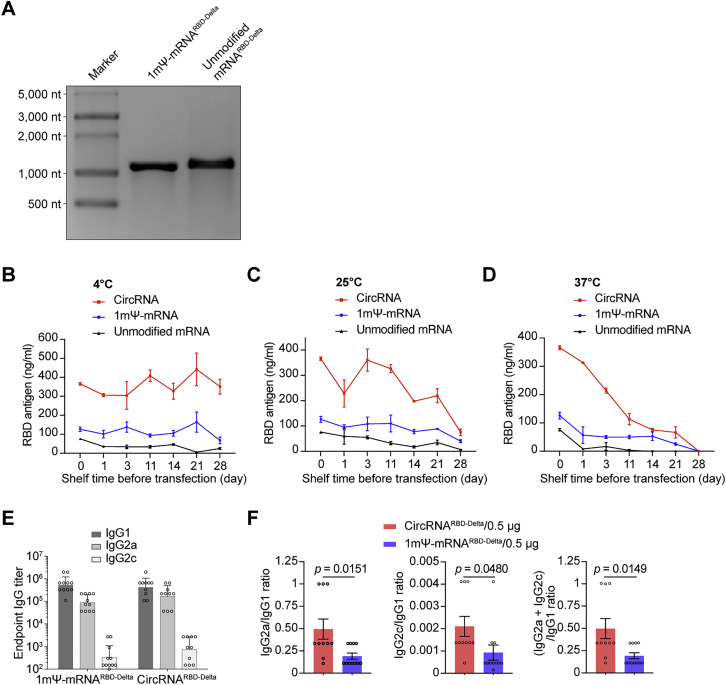
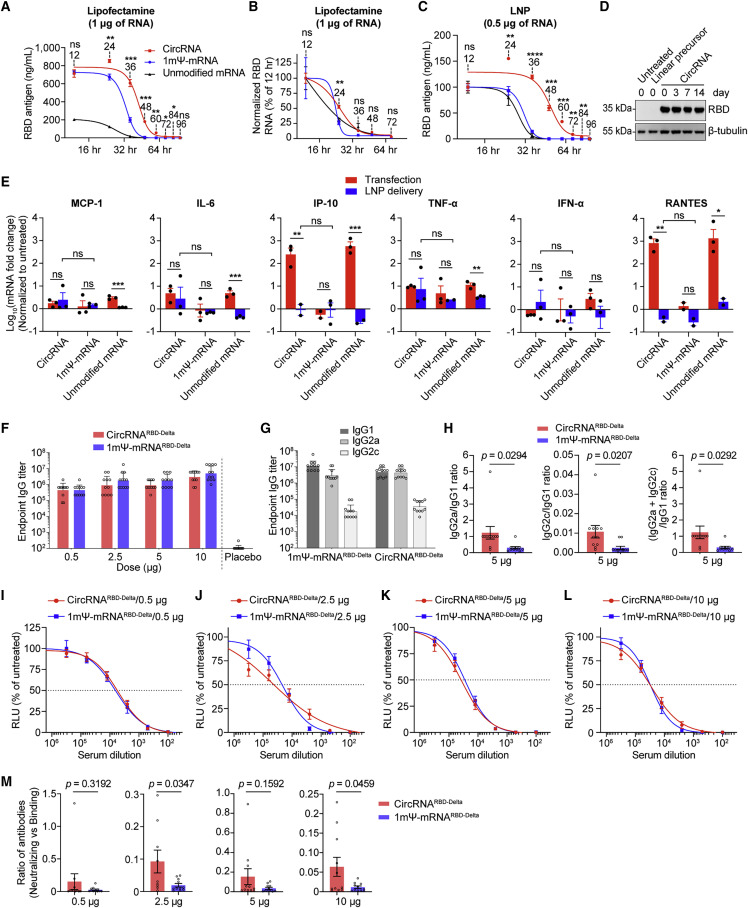
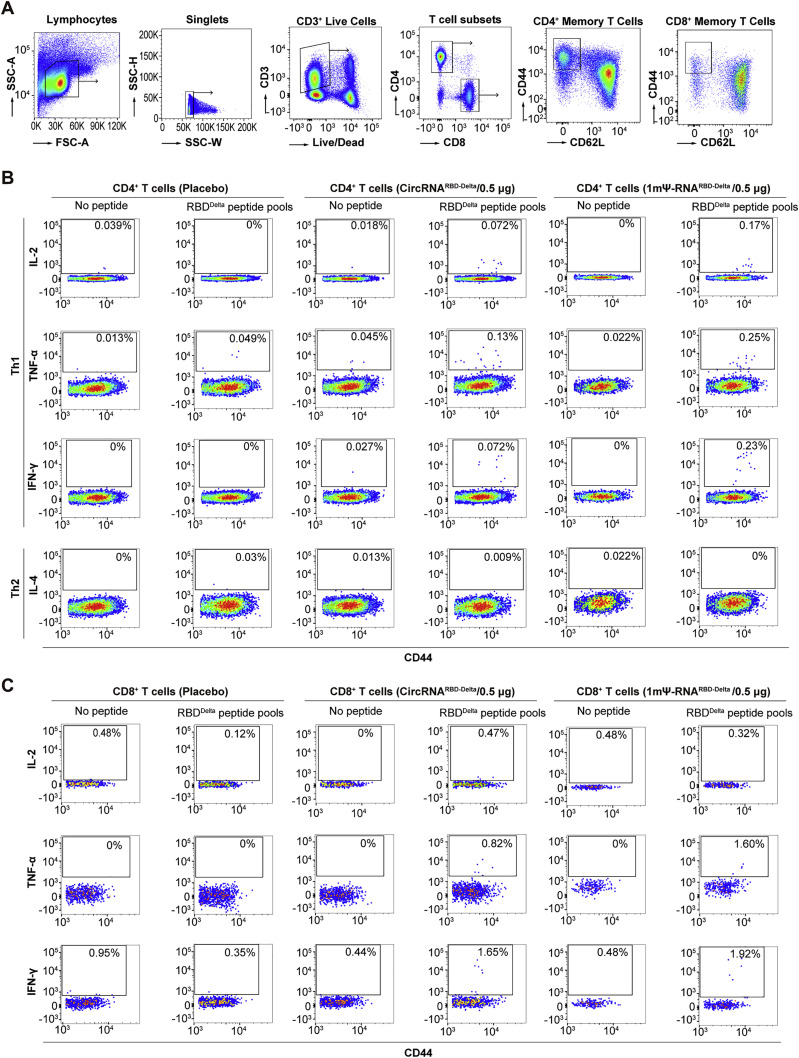
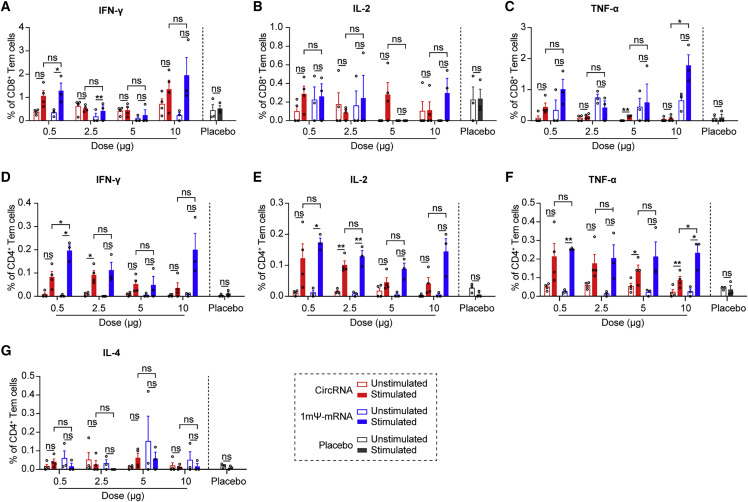
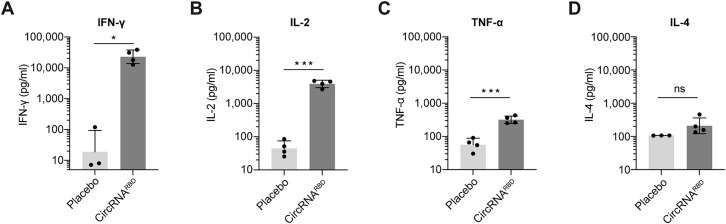
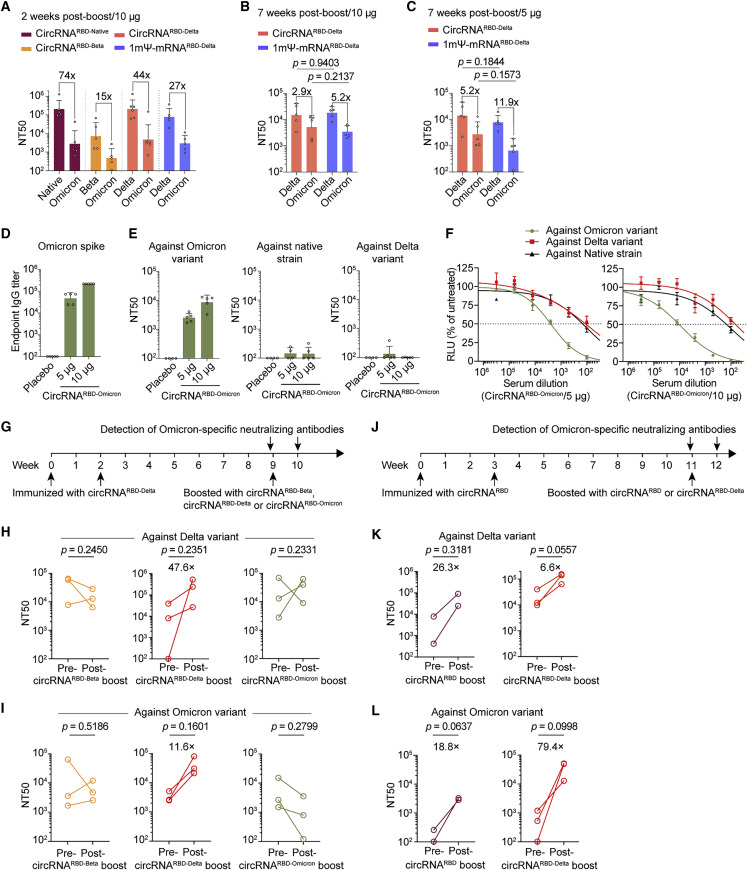
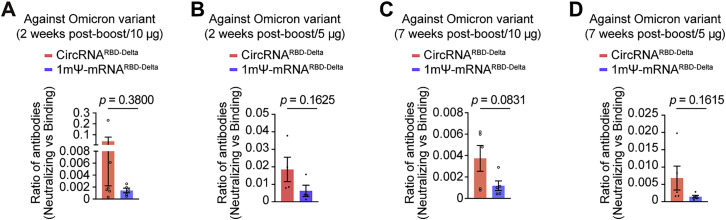
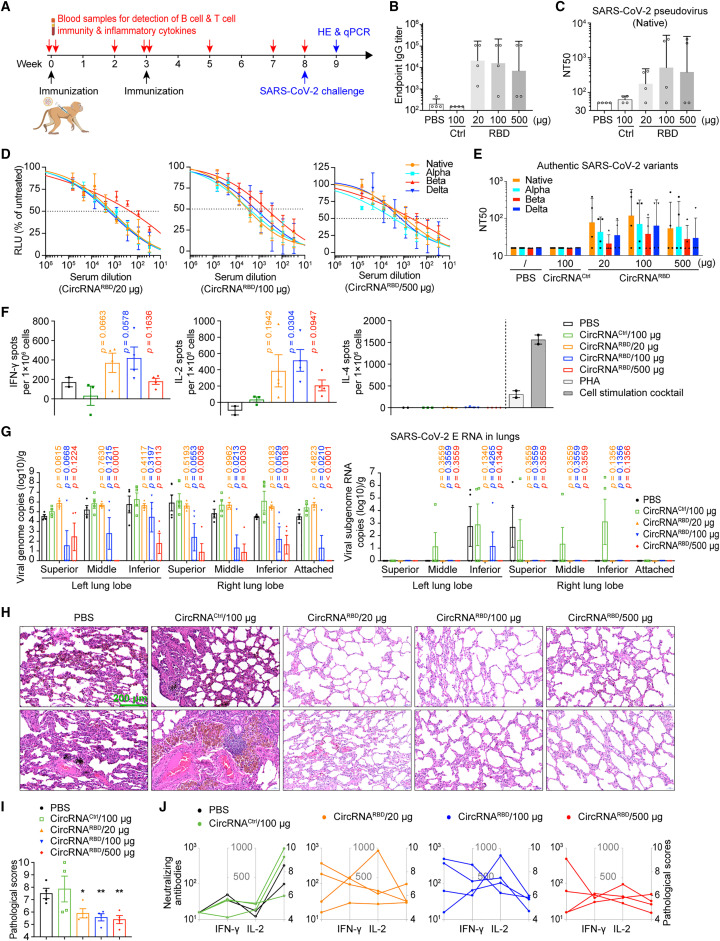
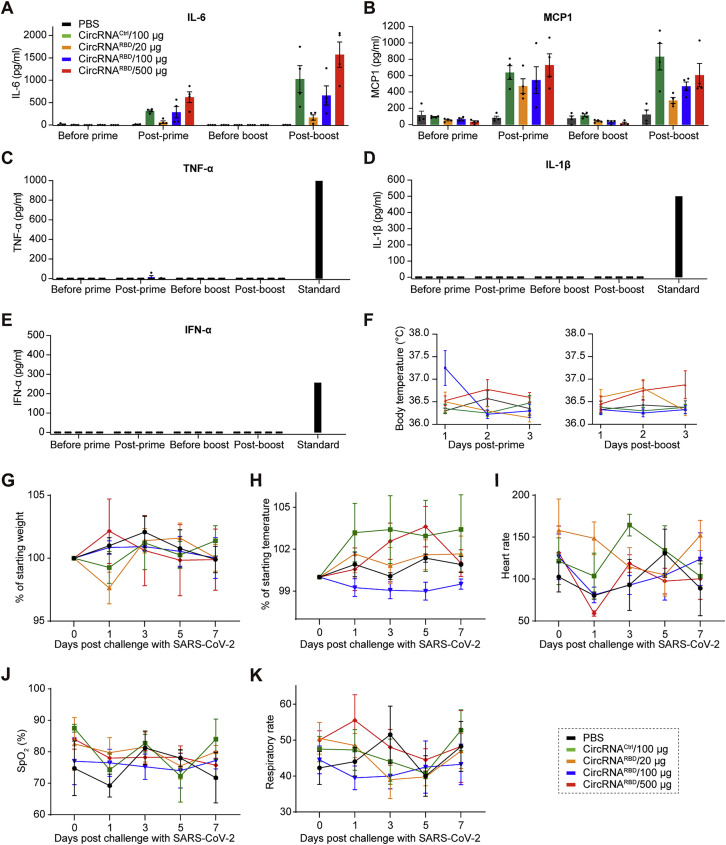
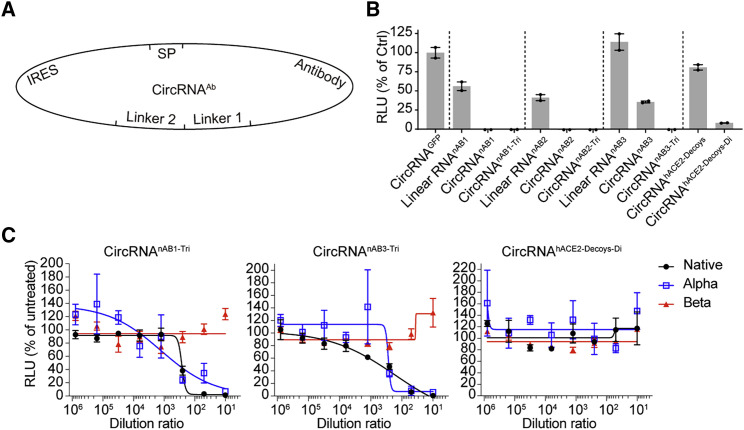
As the emerging variants of SARS-CoV-2 continue to drive the worldwide pandemic, there is a constant demand for vaccines that offer more effective and broad-spectrum protection. Here, we report a circular RNA (circRNA) vaccine that elicited potent neutralizing antibodies and T cell responses by expressing the trimeric RBD of the spike protein, providing robust protection against SARS-CoV-2 in both mice and rhesus macaques. Notably, the circRNA vaccine enabled higher and more durable antigen production than the 1mΨ-modified mRNA vaccine and elicited a higher proportion of neutralizing antibodies and distinct Th1-skewed immune responses. Importantly, we found that the circRNARBD-Omicron vaccine induced effective neutralizing antibodies against the Omicron but not the Delta variant. In contrast, the circRNARBD-Delta vaccine protected against both Delta and Omicron or functioned as a booster after two doses of either native- or Delta-specific vaccination, making it a favorable choice against the current variants of concern (VOCs) of SARS-CoV-2.

Keywords: COVID-19; Delta; Omicron; SARS-CoV-2; circRNA vaccine; circular RNA; mRNA vaccine; vaccine; variant of concern.


Conflict of interest statement

Declaration of interests Patents related to the data presented have been filed. W.W. is the founder of Therorna, Inc.

Figures

None
Graphical abstract
Figure 1
Figure 1
Immunogenicity and protection of circRNA vaccines against SARS-CoV-2 in mice (A) Schematic diagram of circRNARBD circularization by group I intron autocatalysis. SP, signal peptide sequence of human tPA. Foldon, the trimerization domain from bacteriophage T4 fibritin. The arrows indicate the design of primers for PCR analysis. (B) Western blot showing the expression level of RBD in the supernatant of HEK293T or NIH3T3 cells transfected with circRNARBD. The circRNAEGFP and linear RNA precursor were used as controls. (C) Western blot result under reducing conditions (with DTT) or nonreducing conditions (without DTT). (D) Measurement of the concentration of RBD in the supernatant of HEK293T cells by ELISA. (E) Competitive inhibition assay of SARS-CoV-2 pseudovirus infection by the circRNARBD-translated RBD antigens. (F) Schematic representation of the LNP-circRNA complex. (G) Representative intensity-size graph of LNP-circRNARBD by the dynamic light scattering method. (H) Schematic diagram of the circRNARBD vaccination and antibody analysis in BALB/c mice. (I) Measurement of the IgG antibody endpoint GMTs elicited by the circRNARBD vaccine. (J) Measurement of the NT50 of LNP-circRNARBD-immunized mouse sera using pseudoviruses. (K) Neutralization assay of SARS-CoV-2 authentic virus with the sera of mice immunized with circRNARBD vaccine. The serum samples were collected at 5 weeks after the boost. (L) Measurement of the SARS-CoV-2 (Beta) specific IgG endpoint GMTs elicited by the circRNARBD-Beta vaccine. (M and N) Sigmoidal curve diagram of the neutralization of vesicular stomatitis virus (VSV)-based D614G, Alpha, or Beta pseudovirus with the sera of mice immunized with circRNARBD (M) or circRNARBD-Beta (N). The sera were collected 1 week after the boost. (O and P) Neutralization assay of SARS-CoV-2 Beta (O) or D614G (P) authentic virus with the serum of mice immunized with circRNARBD-Beta vaccine. (Q) Measurement of the viral loads in the mouse lung tissues. The SARS-CoV-2 RNA copies were normalized to GAPDH. (R) Measurement of the SARS-CoV-2 RBD-Beta-specific IgG endpoint GMTs. (S) Sigmoidal curve diagram of the inhibition rate by sera from immunized mice with surrogate virus neutralization assay. In (R) and (S), the sera were collected 3 days before challenge. (T) Viral loads in the lung tissues of challenged mice. (U) The weight change of immunized or placebo mice after challenge. (V) Measurement of the neutralizing activity of sera from mice immunized with circRNARBD-Beta vaccine. The circRNAs were encapsulated with LNPs (Precision Nanosystems) instead of the lab-prepared LNPs. In (D) and (E), data are shown as the mean ± SEM (n = 2 or 3). In (I)–(L), (O), (P), and (R), data are shown as the geometric mean ± geometric SD (n = 3–6). In (M), (N), (Q), and (S)–(V), data are shown as the mean ± SEM (n = 3–7). Each symbol represents an individual mouse. Unpaired two-sided Student’s t test was performed for comparison, as indicated. See also Figures S1 and S2.
Figure S1
Figure S1
Optimization of the group I intron-based circRNA production approach and manufacturing of high-purity circRNAs via HPLC, related to Figure 1 (A) Agarose-gel RNA electrophoresis to test the effects of T7 RNA polymerase, rNTP, or reaction time of in vitro transcription on the circularization efficiency of Anabaena group I-based circRNARBD production. (B) HPLC chromatogram of circRNARBD via an Agilent 1260 HPLC instrument. (C) Agarose-gel RNA electrophoresis of the collected fractions in (B). (D) HPLC chromatogram of circRNARBD via Thermo UltiMate 3000 HPLC at the manufacturing level. The latter half of the main peak was collected to produce high-purity circRNARBD. (E) Agarose-gel RNA electrophoresis results for the linear RNA precursor, unpurified circRNARBD, and purified circRNARBD. The linear precursor was generated by mutating the 3′ intron of the circRNA precursor as reference band in electrophoresis. (F) Agarose-gel electrophoresis result of nicked RNARBD and circRNARBD treated with RNase R for 5 or 15 min. Nicked RNARBD and IVT-produced linear RNAs share the same length and sequence to circRNARBD. (G) Formaldehyde-agarose denaturing gel electrophoresis of linear precursor RNAs, nicked RNARBD, and circRNARBD. Linear precursor and nicked RNARBD served as the reference bands in electrophoresis. (H) Urea-PAGE denaturing gel electrophoresis of linear precursor RNAs, nicked RNARBD, and circRNARBD. The time of Urea-PAGE denaturing gel electrophoresis was about 3 h, using Urea-PAGE denaturing gels (Thermo). (I) Measurement of the purity of circRNARBD with gray scan and integral calculus analysis. (J) Agarose-gel electrophoresis result of PCR analysis. Linear RNA precursor and circRNARBD were reverse transcribed to cDNA, followed by PCR amplification with the specific primers shown in Figure 1A. (K) Sanger sequencing result of the PCR products in (J). (L) Schematic diagram of RNase H assay. Linear precursor, nicked RNARBD, or circRNARBD was incubated with RNase H and a 15-nt ssDNA antisense probe (complementary to the above three kinds of RNAs) or 15-nt ssDNA sense probe (complementary to the antisense probe). (M) Agarose-gel electrophoresis of linear precursor RNAs, nicked RNARBD, and circRNARBD after the RNase H incubation reactions.
Figure S2
Figure S2
Expression of SARS-CoV-2 RBD antigens with circRNAs produced via T4 RNA ligase-based circularization, related to Figure 1 (A) Schematic diagram of circRNARBD circularization by T4 RNA ligase. SP, signal peptide sequence of human tPA protein. Foldon, the trimerization domain from bacteriophage T4 fibritin protein. RBD, the receptor-binding domain of the SARS-CoV-2 spike protein. (B) Sanger sequencing result of the DNA products produced by divergent PCR. (C) Western blot analysis showing the expression level of RBD antigens in the supernatant of HEK293T cells transfected with circRNARBD circularized by the T4 RNA ligase. The circRNAEGFP and linear RNA precursor were used as controls. (D) Quantitative ELISA measurement of the concentration of RBD antigens in the supernatant. Data are shown as the mean ± SEM (n = 3).
Figure 2
Figure 2
Humoral immune responses elicited by circRNARBD-Delta vaccines in mice (A) Measurement of the SARS-CoV-2 Delta-specific IgG endpoint GMTs elicited by circRNARBD-Delta vaccine generated by group I intron. (B) Measurement of the SARS-CoV-2 Delta-specific IgG endpoint GMTs elicited by circRNARBD-Delta vaccine generated by T4 RNA ligases. (C) Neutralization assay of VSV-based SARS-CoV-2 (Delta) pseudovirus with the sera of mice immunized with circRNARBD-Delta vaccines. (D and E) Sigmoidal curve diagram of the neutralization assay. In (A)–(C), data are shown as the geometric mean ± geometric SD (n = 5), and each symbol represents an individual mouse. In (D) and (E), data are shown as the mean ± SEM (n = 5).
Figure S3
Figure S3
Measuring the expression level of RBD-Delta antigens under different storage conditions and the specific IgG2a/IgG1, IgG2c/IgG1, and (IgG2a + IgG2c)/IgG1 ratios, related to Figure 3 (A) Agarose-gel RNA electrophoresis of 1mΨ-RNARBD-Delta and unmodified mRNARBD-Delta. (B–D) Quantitative ELISA was used to measure the expression of RBD-Delta antigens in the supernatant of HEK293T cells transfected with LNP-circRNARBD-Delta, LNP-1mΨ-mRNARBD-Delta, and LNP-unmodified-mRNARBD-Delta and stored at 4°C (B), 25°C (C), or 37°C (D). The LNP-RNAs were stored at different temperatures and transfected at different time points. Data are shown as the mean ± SEM (n = 3). (E) Measurement of RBD-Delta-specific IgG1/IgG2a/IgG2c endpoint GMTs elicited by 0.5 μg of circRNARBD-Delta vaccine or 1mΨ-mRNARBD-Delta vaccine in mice. Data are shown as the geometric mean ± geometric SD (n = 10 or 11), and each symbol represents an individual mouse. (F) Measurement of the specific IgG2a/IgG1, IgG2c/IgG1, and (IgG2a + IgG2c)/IgG1 ratios in serum from mice immunized with 0.5 μg of circRNARBD-Delta or 1mΨ-mRNARBD-Delta. Data are shown as the mean ± SEM (n = 10 or 11), and each symbol represents an individual mouse. Unpaired two-sided Student’s t test was performed for comparison, as indicated in the figures.
Figure 3
Figure 3
CircRNA vaccine elicited higher average proportions of neutralizing antibodies and distinct Th1-biased T cell immune responses than mRNA vaccine (A) Comparison of the antigen expression levels of circRNARBD-Delta, 1mΨ-mRNARBD-Delta, and unmodified mRNARBD-Delta through Lipofectamine MessengerMax transfection in HEK293T cells. (B) The dynamic change in RNA levels in (A). (C) The antigen expression levels of LNP-circRNARBD-Delta, LNP-1mΨ-mRNARBD-Delta, and LNP-unmodified-mRNARBD-Delta in HEK293T cells. In (A)–(C), data are shown as the mean ± SEM (n = 3). (D) Western blot showing the expression level of RBD in the supernatant of HEK293T cells transfected with circRNARBD. (E) The mRNA abundance of cytokines (MCP-1, IL-6, IP-10, TNF-α, IFN-α, and RANTES) induced by circRNARBD-Delta, 1mΨ-mRNARBD-Delta, and unmodified mRNARBD-Delta via RT-qPCR analysis in HEK293T cells. The circRNA, 1mΨ-mRNA, or unmodified mRNA was delivered into HEK293T cells via MessengerMax or LNP. The mRNA levels were normalized by GAPDH. The mRNA fold changes were normalized using the untreated HEK293T cells. Data are shown as the mean ± SEM (n = 2 or 3). (F) Measurement of the RBD-Delta-specific IgG endpoint GMTs in mice. (G) Measurement of RBD-Delta-specific IgG1/IgG2a/IgG2c endpoint GMTs in mice. In (F) and (G), data are shown as the geometric mean ± geometric SD (n = 11–12). (H) Measurement of the specific IgG2a/IgG1, IgG2c/IgG1, and (IgG2a + IgG2c)/IgG1 ratios. (I–L) Sigmoidal curve diagram of neutralization rate of VSV-based SARS-CoV-2 (Delta) pseudovirus with the sera from mice immunized with 0.5 μg (I), 2.5 μg (J), 5 μg (K), or 10 μg (L) of circRNA or 1mΨ-mRNA vaccines. (M) The ratio of (neutralizing Ab)/(binding Ab) elicited by 0.5, 2.5, 5, or 10 μg of the circRNA or 1mΨ-mRNA vaccine. The ratio of (NT50)/(endpoint GMT) of each mouse was calculated. In (H)–(M), data are shown as the mean ± SEM (n = 10–12). Unpaired two-sided Student’s t test was performed for comparison, as indicated in the figures, p < 0.05; ∗∗p < 0.01; ∗∗∗p < 0.001; ∗∗∗∗p < 0.0001; ns, not significant. Each symbol represents an individual mouse. See also Figure S3.
Figure S4
Figure S4
Flow panel and gating strategy to quantify SARS-CoV-2-RBD-specific T cells in mice, related to Figure 4 (A) The plots show the gating strategy of single and viable T cells in splenocytes. CD4+ or CD8+ Tem cells (CD44+CD62L) were further analyzed to detect the expression of cytokines stimulated by corresponding RBD-Delta peptide pools. (B and C) Represented unvaccinated and vaccinated cohorts are shown for specific CD4+ T cell responses (B) and CD8+ T cell responses (C).
Figure 4
Figure 4
T cell immune responses elicited by SARS-CoV-2 circRNARBD-Delta or mRNARBD-Delta vaccines in mice (A–C) FACS analysis results showing the percentages of CD8+ Tem cells secreting IFN-γ (A), IL-2 (B), or TNF-α (C) after stimulation with RBD-Delta peptide pools. (D–G) FACS analysis results showing the percentages of CD4+ Tem cells secreting IFN-γ (D), IL-2 (E), TNF-α (F), or IL-4 (G) after stimulation. Empty LNP was used as the control. In (A)–(G), data are presented as the mean ± SEM (n = 3 or 4), and each symbol represents an individual mouse. Paired Student’s t test was performed for comparison between the peptide pool-stimulated group and un-stimulated group as indicated; unpaired two-sided Student’s t test was performed for comparison between circRNARBD-Delta vaccines and mRNARBD-Delta vaccines as indicated; p < 0.05; ∗∗p < 0.01; ∗∗∗p < 0.001; ∗∗∗∗p < 0.0001; ns, not significant. See also Figures S4 and S5.
Figure S5
Figure S5
The ELISA results showing the cytokine levels in the supernatants of peptide pool-stimulated splenocytes, related to Figure 4 (A–D) Measurement of the level of IFN-γ (A), IL-2 (B), TNF-α (C), or IL-4 (D) in the supernatants of peptide pool-stimulated splenocytes with ELISA. The data are shown as the geometric mean ± geometric SD (n = 3 or 4), and each symbol represents an individual mouse. Unpaired two-sided Student’s t test was performed for the comparison, as indicated in the figures; p < 0.05; ∗∗p < 0.01; ∗∗∗p < 0.001; ∗∗∗∗p < 0.0001; ns, not significant.
Figure 5
Figure 5
CircRNARBD-Delta vaccine elicited high levels of neutralizing antibodies against both the Delta and Omicron variants (A) Neutralization assay of VSV-based SARS-CoV-2 pseudovirus with the sera of immunized mice. (B and C) Neutralization assay of VSV-based SARS-CoV-2 pseudovirus with the sera of mice immunized with 10 μg (B) or 5 μg (C) of circRNA or mRNA vaccines. (D) Measuring the Omicron-spike-specific IgG endpoint GMTs of circRNARBD-Omicron-immunized mouse sera. (E) Measurement of the NT50 of LNP-circRNARBD-Omicron-immunized mouse sera using VSV-based pseudoviruses. The serum samples were collected at 1 week after the boost dose. In (A)–(E), data are shown as the geometric mean ± geometric SD (n = 4 or 5). (F) Sigmoidal curve diagram of the neutralization assay in (E). Data are shown as the mean ± SEM (n = 4 or 5). (G) Schematic diagram of the circRNA boost and antibody detection in mice receiving two-dose prior circRNARBD-Delta vaccine. (H and I) Measurement of the NT50 value of mouse sera boosted with circRNA vaccine (5 μg) after receiving two-dose circRNARBD-Delta vaccine (5 μg) using VSV-based pseudoviruses of Delta (H) or Omicron (I). (J) Schematic diagram of the circRNA vaccination and antibody detection in mice receiving two-dose circRNARBD vaccine. (K and L) Measurement of the NT50 value of mouse sera boosted with circRNA vaccine (20 μg) after receiving two-dose circRNARBD vaccine (20 μg) using VSV-based pseudoviruses of Delta (K) or Omicron (L). In (B) and (C), unpaired two-sided Student’s t test was performed for comparison, as indicated. In (H), (I), (K), and (L), paired Student’s t test was performed for comparison, as indicated. Each symbol represents an individual mouse. See also Figure S6.
Figure S6
Figure S6
The circRNARBD-Delta vaccine elicited a high level of neutralizing antibodies against the Omicron variant, related to Figure 5 (A and B) Measurement of the ratio of (neutralizing antibodies)/(binding antibodies) elicited by 10 μg (A) or 5 μg (B) of circRNARBD-Delta vaccine or 1mΨ-mRNARBD-Delta vaccine in sera collected 2 weeks after the boost. The ratio of (NT50)/(endpoint GMT) of each mouse was calculated. (C and D) Measurement of the ratio of (neutralizing antibodies)/(binding antibodies) elicited by 10 μg (C) or 5 μg (D) of circRNARBD-Delta vaccine or 1mΨ-mRNARBD-Delta vaccine with the sera collected 7 weeks after the boost. The ratio of (NT50)/(endpoint GMT) of each mouse was calculated. In (A)–(D), data are presented as the mean ± SEM (n = 4–6), and each symbol represents an individual mouse. The unpaired two-sided Student’s t test was performed for comparison, as indicated in the figures.
Figure 6
Figure 6
CircRNA vaccine elicits immunogenicity and protection against SARS-CoV-2 infection in rhesus macaques (A) Schematic diagram of the circRNARBD vaccination in rhesus macaques. (B) Measurement of the SARS-CoV-2 RBD-specific IgG endpoint GMTs of the plasma from the rhesus macaques immunized with circRNARBD vaccine, or circRNACtrl (circRNA without the RBD-encoding sequence), or PBS control. (C) Measurement of the NT50 of the plasma of immunized rhesus macaques. (D) Sigmoidal curve diagram of neutralization rate of VSV-based SARS-CoV-2 native, Alpha, Beta, and Delta pseudoviruses using the plasma of immunized rhesus macaques. (E) Neutralization assay of authentic SARS-CoV-2 native, Alpha, Beta, and Delta viruses using the plasma of immunized rhesus macaques. (F) ELISpot assay measurement of the SARS-CoV-2 RBD-specific IFN-γ, IL-2, and IL-4 responses of PBMCs from rhesus macaques immunized with circRNA vaccines. Data are shown as the mean ± SEM (n > 2). (G) Measurement of the viral loads (N gene) and subgenome RNA loads (E gene) in the lung tissues of challenged rhesus macaques. Data are shown as the mean ± SEM (n = 4). (H) H&E staining of pathological sections using the lung tissues from immunized rhesus macaques at 7 days after challenge. (I) Pathological score of pneumonia based on the lung tissues from immunized rhesus macaques at 7 days after challenge. The data are shown as the mean ± SEM (n = 4). (J) Correlation of the B cell response, T cell response, and pathological score in each immunized rhesus macaque. Each symbol represents an individual macaque and symbol of the same rhesus macaque is connected by line. B cell responses are shown by neutralizing antibody production as a value of NT50 against authentic SARS-CoV-2 virus. T cell responses are shown as spots per 106 PBMCs detected in an IFN-γ and IL-2 ELISpot assay. Pathological scores are the same as in (I). In (B), (C) and (E), data are shown as the geometric mean ± geometric SD (n = 4). In (D), (F), (G), and (I), data are shown as the mean ± SEM (n = 2–4). Unpaired two-sided Student’s t test was performed for comparison, as indicated in the figures; p < 0.05; ∗∗p < 0.01; ∗∗∗p < 0.001; ∗∗∗∗p < 0.0001; ns, not significant. Each symbol represents an individual rhesus macaque. See also Figure S7.
Figure S7
Figure S7
CircRNA vaccine caused no obvious clinical signs of illness in rhesus macaques, related to Figure 6 (A–E) Measurement of the IL-6 (A), MCP-1 (B), TNF-α (C), IL-1β (D), and IFN-α (E) level in the plasma of immunized rhesus macaques. (F) Monitoring the body temperature of rhesus macaques. Body temperature was monitored within 3 days after the prime and boost doses. In (A)–(F), data are shown as the mean ± SEM (n = 4). (G–K) The body weight (G), temperature (H), heart rate (I), oxygen saturation (J), and respiratory rate (K) were monitored after challenge with SARS-CoV-2. Data are shown as the mean ± SEM (n = 4).
Figure 7
Figure 7
Expression of SARS-CoV-2 neutralizing nanobodies or hACE2 decoys via a circRNA platform (A) Schematic diagram of circRNAnAB or circRNAhACE2 decoys circularization by group I intron. (B) Lentivirus-based pseudovirus neutralization assay with the supernatant from cells transfected with circRNA encoding nAB1, nAB1-Tri, nAB2, nAB2-Tri, nAB3, and nAB3-Tri or ACE2 decoys. The nAB1-Tri, nAB2-Tri, and nAB3-Tri represent the trimers of nAB1, nAB2, and nAB3, respectively. The luciferase value was normalized to that of the circRNAEGFP control. (C) Sigmoidal curve diagram of neutralization of VSV-based SARS-CoV-2 D614G, Alpha, or Beta pseudovirus using the supernatant of cells transfected with nAB1-Tri, nAB3-Tri, or ACE2 decoys encoded by the corresponding circRNAs. Data are shown as the mean ± SEM (n = 2 or 3).

Similar articles

Cited by

References

    1. Alameh M.G., Tombácz I., Bettini E., Lederer K., Sittplangkoon C., Wilmore J.R., Gaudette B.T., Soliman O.Y., Pine M., Hicks P., et al. Lipid nanoparticles enhance the efficacy of mRNA and protein subunit vaccines by inducing robust T follicular helper cell and humoral responses. Immunity. 2021;54:2877–2892.e7. - PMC - PubMed
    1. Bangaru S., Ozorowski G., Turner H.L., Antanasijevic A., Huang D., Wang X., Torres J.L., Diedrich J.K., Tian J.H., Portnoff A.D., et al. Structural analysis of full-length SARS-CoV-2 spike protein from an advanced vaccine candidate. Science. 2020;370:1089–1094. - PMC - PubMed
    1. Barnes C.O., Jette C.A., Abernathy M.E., Dam K.A., Esswein S.R., Gristick H.B., Malyutin A.G., Sharaf N.G., Huey-Tubman K.E., Lee Y.E., et al. SARS-CoV-2 neutralizing antibody structures inform therapeutic strategies. Nature. 2020;588:682–687. - PMC - PubMed
    1. Boutros C., Tarhini A., Routier E., Lambotte O., Ladurie F.L., Carbonnel F., Izzeddine H., Marabelle A., Champiat S., Berdelou A., et al. Safety profiles of anti-CTLA-4 and anti-PD-1 antibodies alone and in combination. Nat. Rev. Clin. Oncol. 2016;13:473–486. - PubMed
    1. Bouwman K.M., Tomris I., Turner H.L., van der Woude R., Shamorkina T.M., Bosman G.P., Rockx B., Herfst S., Snijder J., Haagmans B.L., et al. Multimerization- and glycosylation-dependent receptor binding of SARS-CoV-2 spike proteins. PLoS Pathog. 2021;17:e1009282. - PMC - PubMed

Publication types

Supplementary concepts