. 2022 Apr 23;13(4):402.
doi: 10.1038/s41419-022-04824-7.

Autophagy guards tendon homeostasis

Affiliations

Autophagy guards tendon homeostasis

Costanza Montagna et al. Cell Death Dis. .

Abstract

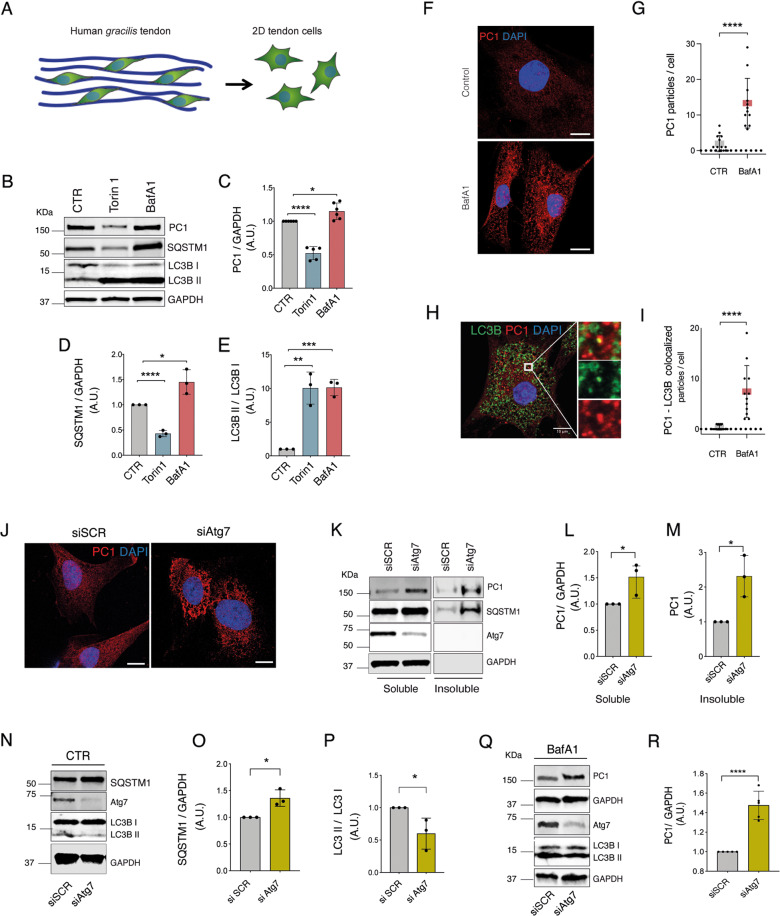
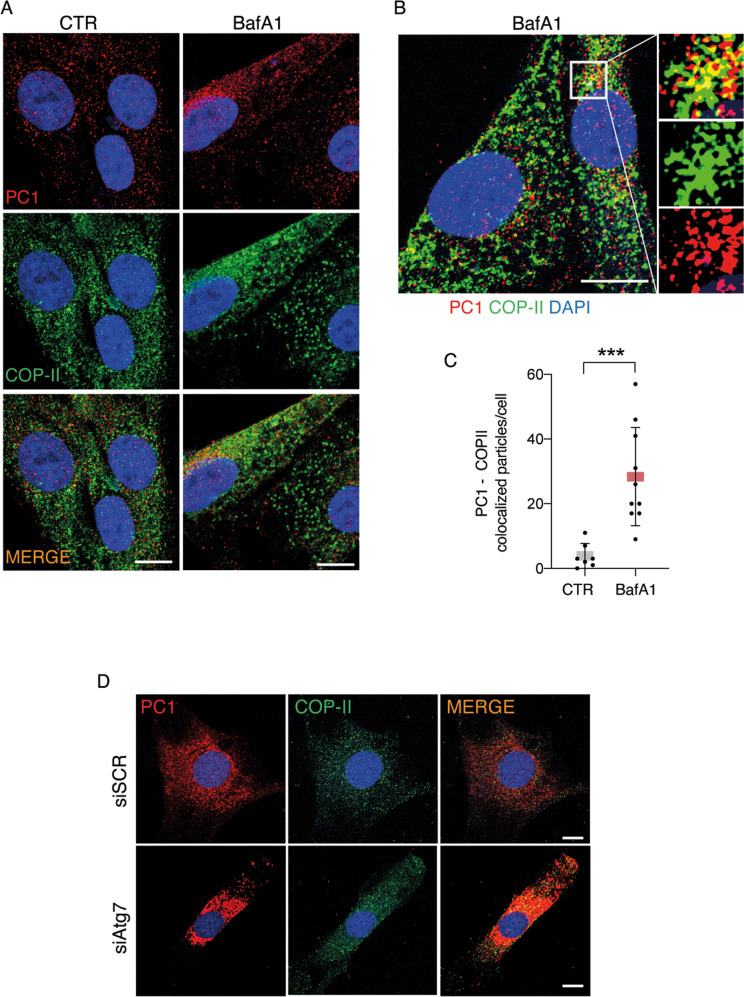
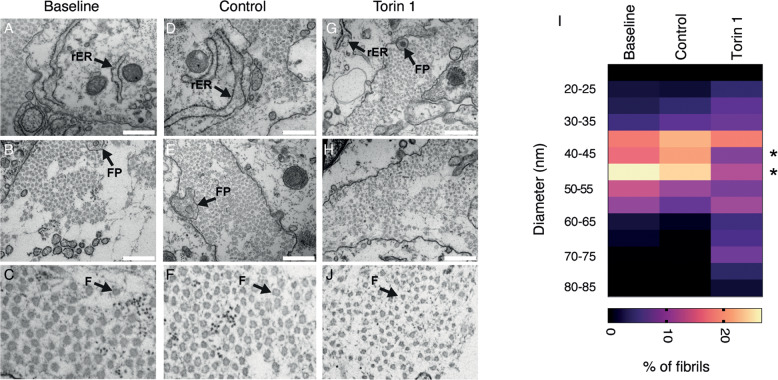
Tendons are vital collagen-dense specialized connective tissues transducing the force from skeletal muscle to the bone, thus enabling movement of the human body. Tendon cells adjust matrix turnover in response to physiological tissue loading and pathological overloading (tendinopathy). Nevertheless, the regulation of tendon matrix quality control is still poorly understood and the pathogenesis of tendinopathy is presently unsolved. Autophagy, the major mechanism of degradation and recycling of cellular components, plays a fundamental role in the homeostasis of several tissues. Here, we investigate the contribution of autophagy to human tendons' physiology, and we provide in vivo evidence that it is an active process in human tendon tissue. We show that selective autophagy of the endoplasmic reticulum (ER-phagy), regulates the secretion of type I procollagen (PC1), the major component of tendon extracellular matrix. Pharmacological activation of autophagy by inhibition of mTOR pathway alters the ultrastructural morphology of three-dimensional tissue-engineered tendons, shifting collagen fibrils size distribution. Moreover, autophagy induction negatively affects the biomechanical properties of the tissue-engineered tendons, causing a reduction in mechanical strength under tensile force. Overall, our results provide the first evidence that autophagy regulates tendon homeostasis by controlling PC1 quality control, thus potentially playing a role in the development of injured tendons.


Conflict of interest statement

The authors declare no competing interests.

Figures

Fig. 1
Fig. 1. Autophagy degrades PC1 in tendons.
A Representative images of LC3B puncta (autophagosomes) in human gracilis tendon. Human tendon tissues were immunolabeled for LC3B (green), nuclei stained with DAPI (blue) and analyzed by confocal microscopy. Scale bar = 10 μm. Inset shows a higher magnification of selected areas. B Representative images of human gracilis tendon immunolabeled for PC1 (red), Atg12 (green) and nuclei stained with DAPI (blue). Tissues were analyzed by confocal microscopy. Scale bars = 10 μm. The insets show higher magnification and single color channels of the boxed areas. C Representative images of murine Achilles tendons immunolabeled for PC1 (red), LC3B (green) and nuclei stained with DAPI (blue). Tissues were analyzed by confocal microscopy. Scale bars = 10 μm. The insets show higher magnification and single color channels of the boxed areas.
Fig. 2
Fig. 2. PC1 is an autophagy substrate in primary human tendon cells.
A Graphical representation of cells isolated from gracilis tendons harvested from patients that underwent reconstructive anterior cruciate ligament surgery. B Western blot analysis of PC1, LC3B, and SQSTM1/p62 in Control, Torin 1 and Bafilomycin A1 (BafA1) treated cells for 4 h. GAPDH was used as a loading control. Quantification of the PC1 (C), SQSTM1/p62 proteins level (D) LC3BII/LC3BI ratio (E) western blot data. Data are representative of five (PC1) or three (SQSTM1/p62 and LC3BII/LC3BI) independent experiments made with cells from five or three different human donors. *p < 0.05, ****p < 0.0001, unpaired t-test. F Human tendon cells control and treated with BafA1 for 16 h were immunolabeled for PC1 (red), nuclei stained with DAPI (blue) and analyzed by confocal microscopy. Scale bar = 10 μm. G Quantification of PC1 particles per cell. ****p < 0.0001, unpaired t-test. H Cells treated with BafA1 for 16 h were immunolabeled for PC1 (red), LC3B (green) and nuclei stained with DAPI (blue). Scale bars = 10 μm. The insets show higher magnification and single color channels of the boxed area. I Quantification of PC1-LC3B colocalized particles per cell. ****p < 0.0001, unpaired t-test. J Control cells treated with scrambled siRNA (siSCR) of siAtg7 siRNAs were immunolabeled for PC1 (red), nuclei stained with DAPI (blue) and analyzed by confocal microscopy. Scale bar = 10 μm. K Western blot analysis of PC1, SQSTM1/p62, and Atg7 in control (siSCR) and siAtg7 siRNA-treated cells. Cell lysates were separated into soluble and insoluble fractions. GAPDH was used as a loading control. Quantification of normalized PC1 protein level in soluble (L) and insoluble (M) fractions. Data are representative of three independent experiments made with cells from three different human donors. *p < 0.05, unpaired t-test. N Western blot analysis of SQSTM1/p62, Atg7, and LC3B in siSCR and siAtg7 cells. GAPDH was used as a loading control. Quantification of SQSTM1/p62 (O) and LC3BII/LC3BI ratio (P). Q Western blot analysis of PC1 Col-I, Atg7, and LC3B in siSCR and siAtg7 cells treated with BafA1. R Quantification of the normalized PC1 Col-I protein. Data are representative of five independent experiments made with cells from five different human donors. ****p < 0.0001, unpaired t-test.
Fig. 3
Fig. 3. Inhibition of autophagy results in accumulation of PC1 in the ER exit sites in primary human tendon cells.
A Human tendon cells control and treated with BafA1 for 16 h were immunolabeled for PC1 (red), COPII (green), and nuclei stained with DAPI (blue) and analyzed by confocal microscopy. Scale bar = 10 μm. B Cells treated with BafA1 for 16 h were immunolabeled for PC1 (red), COP-II (green), and nuclei stained with DAPI (blue) and analyzed by confocal microscopy. The insets show higher magnification and single color channels of the boxed area. Scale bars = 10 μm. C Quantification of PC1-COP-II colocalized particles per cell. ***p < 0.001, unpaired t-test. D Confocal microscopy images of control and siAtg7-treated cells immunolabeled for PC1 (red), COP-II (green), nuclei stained with DAPI (blue). Scale bar = 10 μm.
Fig. 4
Fig. 4. Calnexin is involved in the degradation of PC1 in primary human tendon cells.
A Human tendon cells control and treated with BafA1 for 16 h were immunolabeled for PC1 (red), CANX (blue), and LC3B (green) and analyzed by confocal microscopy. The insets show higher magnification and single color channels of the boxed area. Scale bars = 10 μm. B Western blot analysis of CANX, PC1, SQSTM1/p62, and LC3B in control and Torin 1 (Tor)-treated cells for 1 and 4 h. GAPDH was used as a loading control. C Quantification of CANX western blot data. Data are representative of four independent experiments made with cells from four different human donors. **p < 0.01, ***p < 0.001, unpaired t-test. D Western blot analysis of PC1 and CANX, in siSCR and siCANX cells. GAPDH was used as a loading control. Quantification of the normalized PC1 (E) and CANX (F) proteins levels. Data are representative of eight independent experiments made with cells from three different human donors. *p < 0.05, ****p < 0.0001, unpaired t-test. G Western blot analysis of PC1 and SQSTM1/p62, siSCR, and siCANX cells treated with Torin 1 for 1 and 4 h. GAPDH was used as a loading control. H Quantification of the normalized PC1 protein levels. Data are representative of three independent experiments made with cells from three different human donors. *p < 0.05, unpaired t-test.
Fig. 5
Fig. 5. Calnexin is required for autophagy of PC1 in primary human tendon cells.
A Control and siCANX-treated human tendon cells treated with BafA1 for 16 h were immunolabeled for PC1 (red), LC3B (green), nuclei stained with DAPI (blue) and analyzed by confocal microscopy. The insets show higher magnification and single color channels of the boxed area. Scale bars = 10 μm. B Quantification of PC1-LC3B colocalized particles per cell. *p < 0.05, **p < 0.01, unpaired t-test.
Fig. 6
Fig. 6. Pharmacological inhibition of mTOR by Torin 1 has a negative effect on thickness of 3D tissue-engineered tendons.
A Experimental design of treatment of 3D tissue-engineered tendons from day 28 after cell seeding (Baseline), or treated with Torin 1 until day 35 (Torin1) or left as control until harvesting until day 35 (Control). B Representative transverse images showing cell morphology of 3D tissue-engineered tendons analyzed by TEM. Nuclei (n), mitochondria (white arrows), fibropositors (green arrows), autophagosomes (yellow arrows), and autophagolysosomes (red arrows) are indicated. Left scale bars = 1 μm; right scale bars = 2 μm. C Dry weight and cross-sectional area (CSA) (D), were determined in baseline, control and Torin1 samples. n = 3 tissue donors, with a minimum of 8 tissue-engineered tendons per cell preparation for each treatment for each parameter measured, *p < 0.05, **p < 0.01, unpaired t-test. E COL1A1 gene expression in baseline, control, and Torin1 samples. Data are representative of three independent experiments made with cells from three different human donors. *p < 0.05, paired t-test, Bonferroni corrected. F Collagen content, normalized on the dry weight, was also determined. n = 3 tissue donors, with a minimum of 8 tissue-engineered tendons per cell preparation for each treatment for each parameter measured, *p < 0.05, **p < 0.01, unpaired t-test.
Fig. 7
Fig. 7. Pharmacological inhibition of mTOR by Torin 1 impairs collagen fibrils morphology.
A–H Representative transverse images of 3D tissue-engineered tendons analyzed by TEM. Baseline and control samples showed fibrils with similar fibril diameter and regular shapes (A–F). Torin 1 samples, in contrast, showed irregular fibrils (G, H). rER rough endoplasmic reticulum, FP fibripositors, F collagen fibril. Scale bar = 500 nm. n = 3 tissue donors in each experimental group. I Heat map plot of the distribution of fibril diameters measured in TEM images of baseline, control and Torin1 3D tissue-engineered tendons. Measurements from at least 800 fibrils per sample measured. n = 3 tissue donors in each experimental group. *p < 0.05, unpaired t-test of Torin 1 vs control samples.
Fig. 8
Fig. 8. Pharmacological inhibition of mTOR by Torin 1 affects matrix quality.
A Graphical representation of the tensile force applied to the tissue-engineered tendons. Maximum stress (B), strain at maximum stress (C), and maximum modulus (D). n = 3 tissue donors, with a minimum of 7 tissue-engineered tendons per cell preparation for each treatment for each parameter measured, *p < 0.05, **p < 0.01, ****p < 0.0001, unpaired t-test.

Similar articles

Cited by

References

    1. Kjaer M. Role of extracellular matrix in adaptation of tendon and skeletal muscle to mechanical loading. Physiol Rev. 2004;84:649–98. doi: 10.1152/physrev.00031.2003. - DOI - PubMed
    1. Halper J, Kjaer M. Basic components of connective tissues and extracellular matrix: elastin, fibrillin, fibulins, fibrinogen, fibronectin, laminin, tenascins and thrombospondins. Adv Exp Med Biol. 2014;802:31–47. doi: 10.1007/978-94-007-7893-1_3. - DOI - PubMed
    1. Heinemeier KM, Schjerling P, Heinemeier J, Magnusson SP, Kjaer M. Lack of tissue renewal in human adult Achilles tendon is revealed by nuclear bomb (14)C. FASEB J. 2013;27:2074–9. doi: 10.1096/fj.12-225599. - DOI - PMC - PubMed
    1. Miller BF, Olesen JL, Hansen M, Døssing S, Crameri RM, Welling RJ, et al. Coordinated collagen and muscle protein synthesis in human patella tendon and quadriceps muscle after exercise. J Physiol. 2005;567:1021–33. doi: 10.1113/jphysiol.2005.093690. - DOI - PMC - PubMed
    1. Heinemeier KM, Schjerling P, Øhlenschlæger TF, Eismark C, Olsen J, Kjær M. Carbon‐14 bomb pulse dating shows that tendinopathy is preceded by years of abnormally high collagen turnover. FASEB J. 2018;32:4763–75. doi: 10.1096/fj.201701569R. - DOI - PubMed

Publication types