. 2022 Apr 23;12(1):6672.
doi: 10.1038/s41598-022-10653-7.

A superior loading control for the cellular thermal shift assay

Affiliations

A superior loading control for the cellular thermal shift assay

Alexandré Delport et al. Sci Rep. .

Abstract

The cellular thermal shift assay (CETSA), as a method to determine protein-ligand interaction and cellular protein modification, has rapidly become routine laboratory practice. However, current options to determine that (1) sample was loaded in each lane of the analysed western blot and (2) the amount loaded was equal, are suboptimal. Here, we report that the αC-terminal fragment of the amyloid precursor protein (APP-αCTF), detected in several wild-type mammalian cell lines, is a highly stable, soluble protein equally present from 4 to 95 °C. We demonstrate that the level of traditional loading controls (vinculin, GAPDH, β-actin, heat-shock chaperone 70 and superoxide dismutase-1) are all temperature sensitive. Additionally, both APP-CTFs (α and β) behaved similarly upon temperature exposure while APP-βCTF levels were not influenced by the presence of a binding ligand either. This emphasises that these proteins can be used as a loading control in the unlikely event of off-target binding during ligand screening. A working example is also presented for mitogen-activated protein kinase kinase in the presence of two inhibitors, PD184352 and U0126, where APP-αCTF was used to normalise the data across experimental replicates. A reduction in data variance and standard deviations was observed after normalisation. Conclusively, APP-αCTF is a superior CETSA loading control that can be used as a standard for this technique.


Conflict of interest statement

The authors declare no competing interests.

Figures

Figure 1
Figure 1
The detection of APP-αCTF in relation to protein concentration, and in five common mammalian cell lines. (A) Western blot analysis of HEK293 cell lysate with APP-αCTF detection as total protein concentration increases (2.5–25 µg) as compared to amido black total protein stain (TPS) with corresponding standardised optical density plots as analysed for APP-αCTF (open purple triangle) and TPS (open red square) as mean ± SD showing R2 and slope for each (n = 3). (B) Western blot analysis of cell lysates from HEK293, Hela, MDA-MB-231, A375 and SH-SY5Y cell lines showing detection of APP-αCTF (10 µg total protein loaded/well). Cropped western blots are shown—see supplementary information file, raw data images for full-length western blots.
Figure 2
Figure 2
Cellular protein stability, over a 45–85 °C temperature range, of two commonly used protein loading controls (Vinculin (filled blue circle) and GAPDH (filled green triangle)) and temperature stable proteins, heat shock protein 70 (HSP70 (filled red square)) and superoxide dismutase-1 (SOD-1) in comparison to APP-αCTF (open purple inverted triangle). (A) A representative cropped western blot of each analysed protein in the soluble fraction from HEK293 cell lysate after temperature exposure with (B) the corresponding relative band intensity sigmoidal curves as mean ± SD used to determine the Tagg for each, calculated by setting the highest intensity for each data set as 100% and the curve generated using the Boltzmann sigmoidal equation (n ≥ 3). Also refer to Figs. S1 and S2 (see supplementary information file, raw data images for full-length western blots).
Figure 3
Figure 3
The detection of soluble and insoluble APP-αCTF and HSP70, including 4.0 °C and room temperature (RT) controls. (A) A representative cropped western blot of APP-αCTF in the soluble (open purple inverted triangle) and insoluble fraction (filled purple inverted triangle) from HEK293 cell lysate after temperature exposure (4 °C, RT, 40–95 °C) and (B) a representative western blot of HSP70 in the soluble (filled red square) and insoluble (open red square) fraction from HEK293 cell lysate after temperature exposure (4 °C, RT, 40–95 °C) with (C) the corresponding relative band intensity sigmoidal curves, for both soluble (left y-axis) and insoluble (right y-axis) protein, as mean ± SD calculated by setting the highest intensity for each data set as 100% and each curve generated using the Boltzmann sigmoidal equation (n = 3). Multiple paired t-test was performed for soluble APP-αCTF (purple line) where ns, not significant. See supplementary information file, raw data images for full-length western blots.
Figure 4
Figure 4
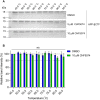
The APP-βCTF binding ligand, CHF5074, has no impact on protein level and stability. (A) A representative cropped western blot of APP-βCTF in the soluble fraction from APP-overexpressing HEK293 stable cell line after treatment with 5 and 10 µM CHF5074 for 4 h and subsequent temperature exposure (broad range: 45–85 °C) as compared to a DMSO vehicle control with (B) a comparative relative band intensity graph of DMSO (blue) and 10 µM CHF5074 (green) calculated by setting the 45 °C as 100%, as mean ± SD (n = 3). Multiple paired t-test was performed where ns, not significant. See supplementary information file, raw data images for full-length western blots.
Figure 5
Figure 5
The cellular thermal shift assay of MEK in the presence of inhibitors, PD184352 and U0126 showcasing the use of APP-αCTF as a temperature insensitive loading control. (A) A representative cropped western blot of MEK in the soluble fraction from HEK293 cell lysate after treatment with 5 µM inhibitor (PD184352 (open red square) or U0126 (open green triangle)) for 4 h and subsequent temperature exposure (initial broad range 45–85 °C followed by final narrow range 40–65 °C) as compared to a DMSO vehicle control (open blue circle). The corresponding sigmoidal curves (mean ± SD) as determined by relative band intensity (B) or normalised (N) relative band intensity, to APP-αCTF loading ([formula image]) (C), calculated by setting the highest intensity for each data set as 100% and the curve generated using the Boltzmann sigmoidal equation are shown with (D) the mean aggregation temperature (Tagg) ± SD, pre-normalised (open symbol) vs normalised (N—solid symbol) (n = 3). One-way ANOVA with Tukey’s post-hoc was performed where ns, not significant; **p ≤ 0.01; ****p ≤ 0.0001. See supplementary information file, raw data images for full-length western blots.

Similar articles

Cited by

References

    1. Molina DM, et al. Monitoring drug target engagement in cells and tissues using the cellular thermal shift assay. Science. 2013;341:84–87. doi: 10.1126/science.1233606. - DOI - PubMed
    1. Molina DM, Nordlund P. The cellular thermal shift assay: A novel biophysical assay for in situ drug target engagement and mechanistic biomarker studies. Annu. Rev. Pharmacol. Toxicol. 2016;56:141–161. doi: 10.1146/annurev-pharmtox-010715-103715. - DOI - PubMed
    1. Jafari R, et al. The cellular thermal shift assay for evaluating drug target interactions in cells. Nat. Protoc. 2014;9:2100–2122. doi: 10.1038/nprot.2014.138. - DOI - PubMed
    1. Drake WR, Hou C-W, Zachara NE, Grimes CL. New use for CETSA: Monitoring innate immune receptor stability via post-translational modification by OGT. J. Bioenergy Biomembr. 2018;50:231–240. doi: 10.1007/s10863-018-9754-z. - DOI - PMC - PubMed
    1. Becher I, et al. Pervasive protein thermal stability variation during the cell cycle. Cell. 2018;173:1495–1507.e1418. doi: 10.1016/j.cell.2018.03.053. - DOI - PMC - PubMed

Publication types

Substances