. 2022 Jul;163(1):239-256.
doi: 10.1053/j.gastro.2022.04.013. Epub 2022 Apr 21.

Estrogen-Related Receptor γ Maintains Pancreatic Acinar Cell Function and Identity by Regulating Cellular Metabolism

Affiliations

Estrogen-Related Receptor γ Maintains Pancreatic Acinar Cell Function and Identity by Regulating Cellular Metabolism

Jinhyuk Choi et al. Gastroenterology. 2022 Jul.

Erratum in

  • Correction.
    [No authors listed] [No authors listed] Gastroenterology. 2023 Feb;164(2):313. doi: 10.1053/j.gastro.2022.11.028. Epub 2022 Dec 1. Gastroenterology. 2023. PMID: 36464508 No abstract available.

Abstract

Background & aims: Mitochondrial dysfunction disrupts the synthesis and secretion of digestive enzymes in pancreatic acinar cells and plays a primary role in the etiology of exocrine pancreas disorders. However, the transcriptional mechanisms that regulate mitochondrial function to support acinar cell physiology are poorly understood. Here, we aim to elucidate the function of estrogen-related receptor γ (ERRγ) in pancreatic acinar cell mitochondrial homeostasis and energy production.

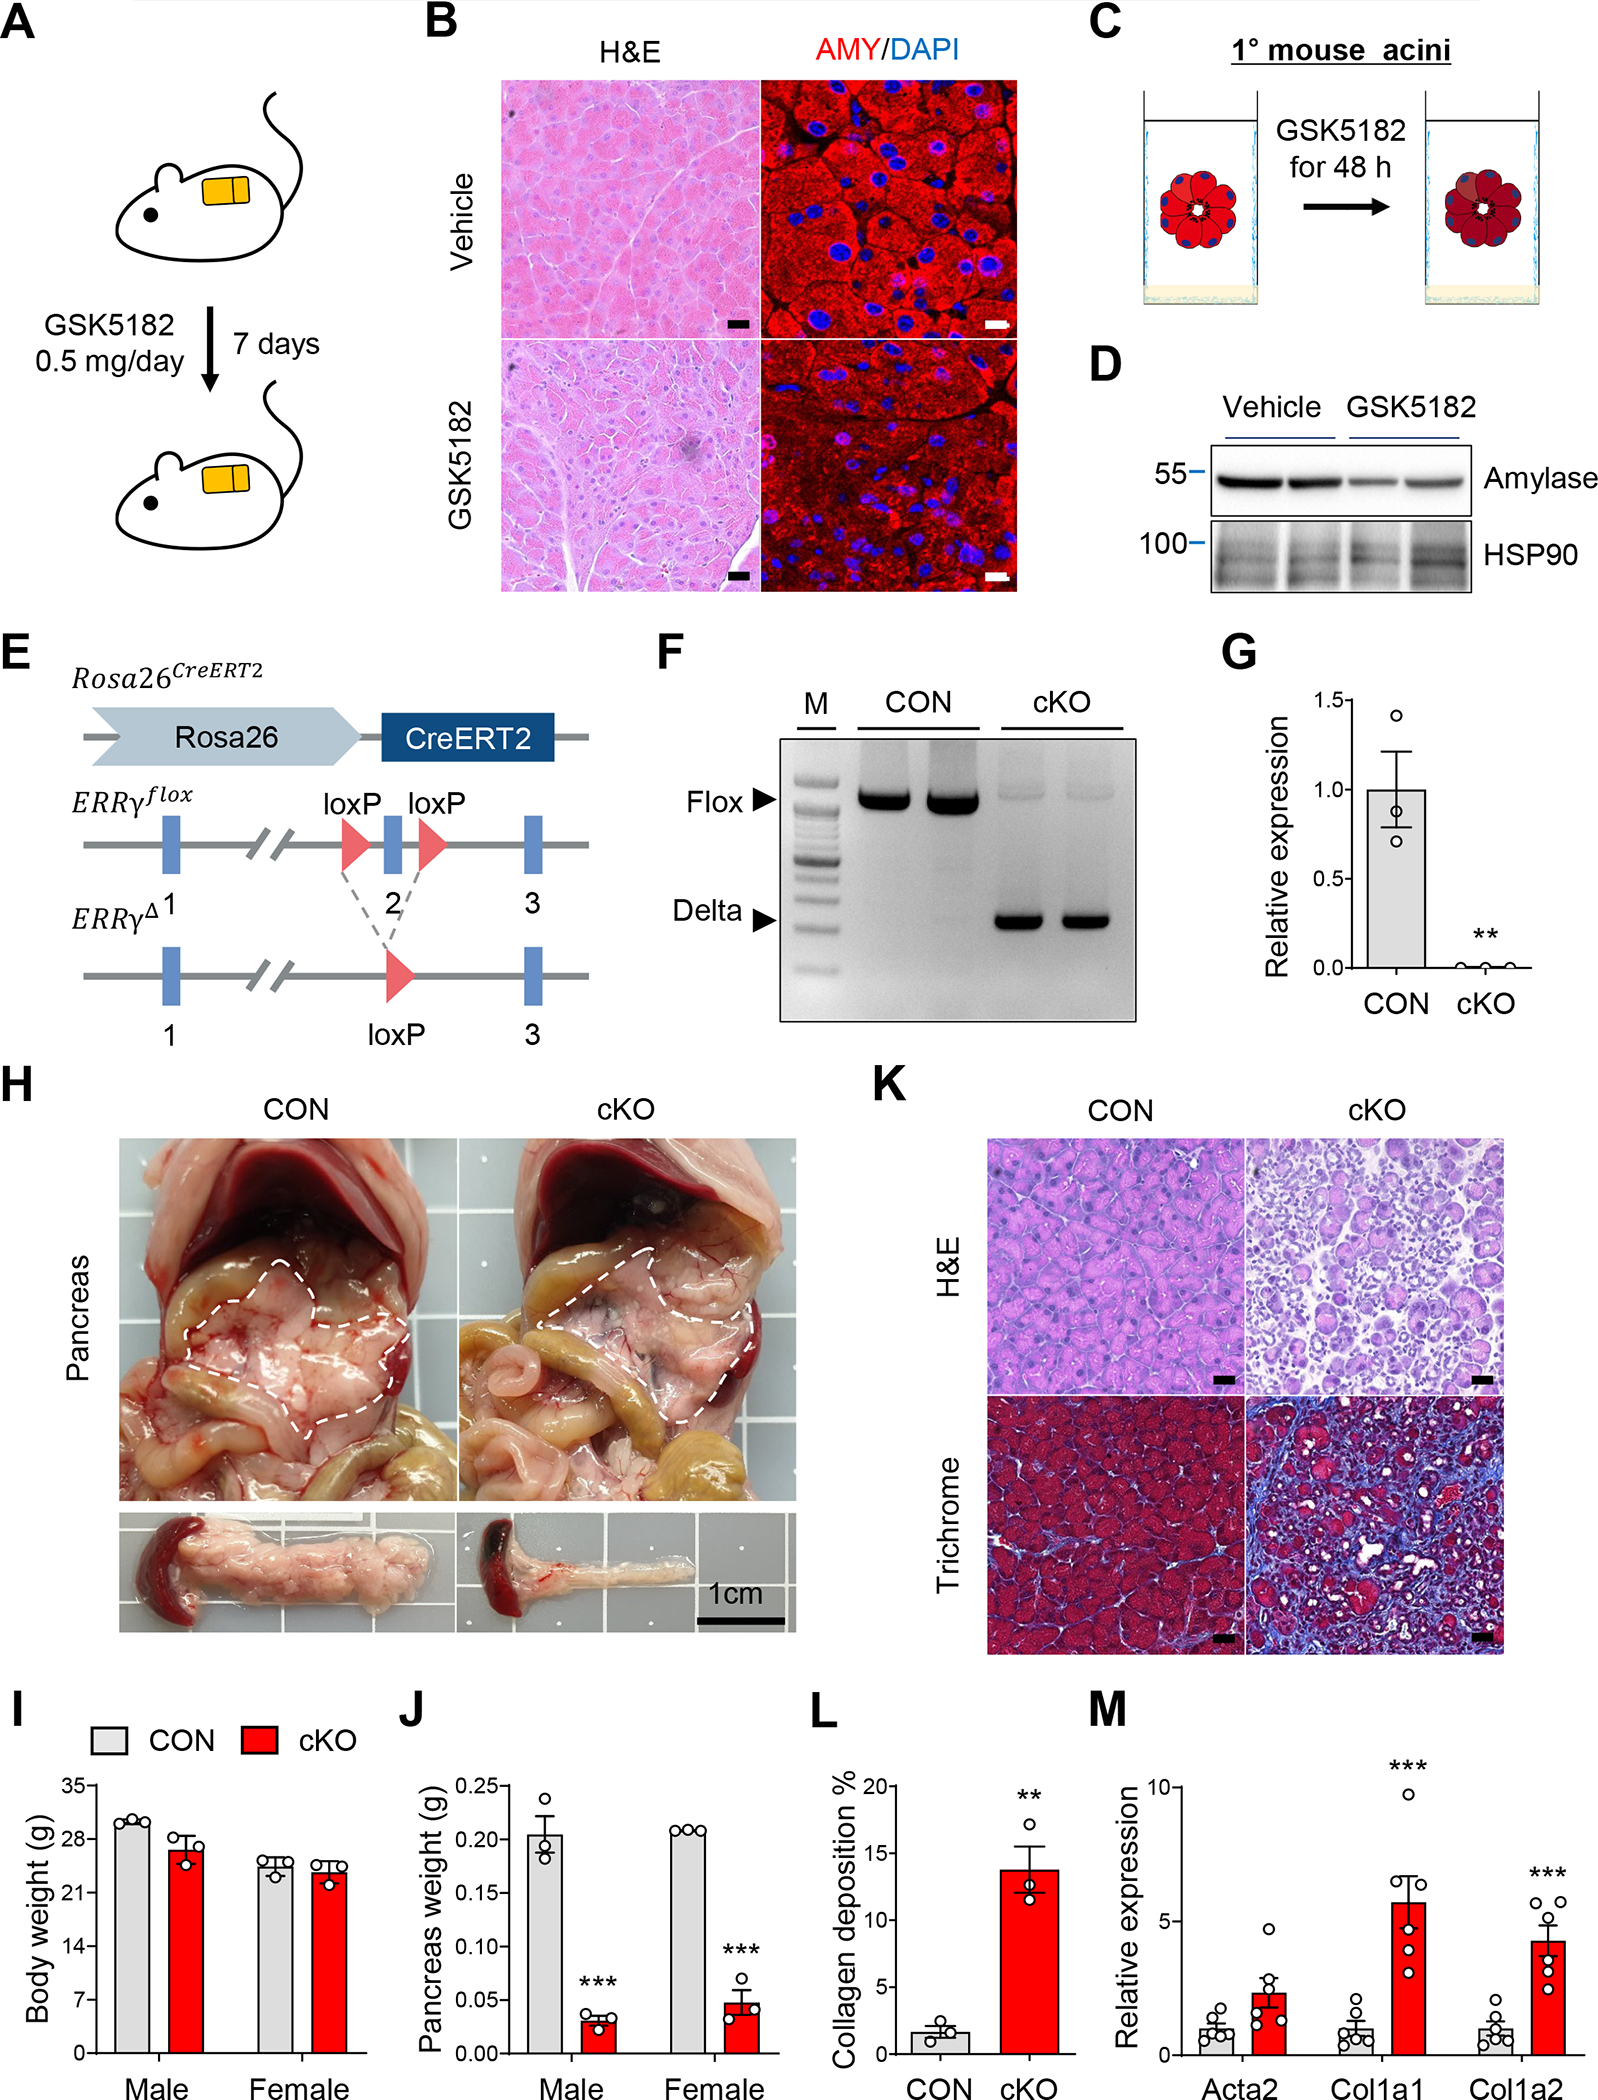
Methods: Two models of ERRγ inhibition, GSK5182-treated wild-type mice and ERRγ conditional knock-out (cKO) mice, were established to investigate ERRγ function in the exocrine pancreas. To identify the functional role of ERRγ in pancreatic acinar cells, we performed histologic and transcriptome analysis with the pancreas isolated from ERRγ cKO mice. To determine the relevance of these findings for human disease, we analyzed transcriptome data from multiple independent human cohorts and conducted genetic association studies for ESRRG variants in 2 distinct human pancreatitis cohorts.

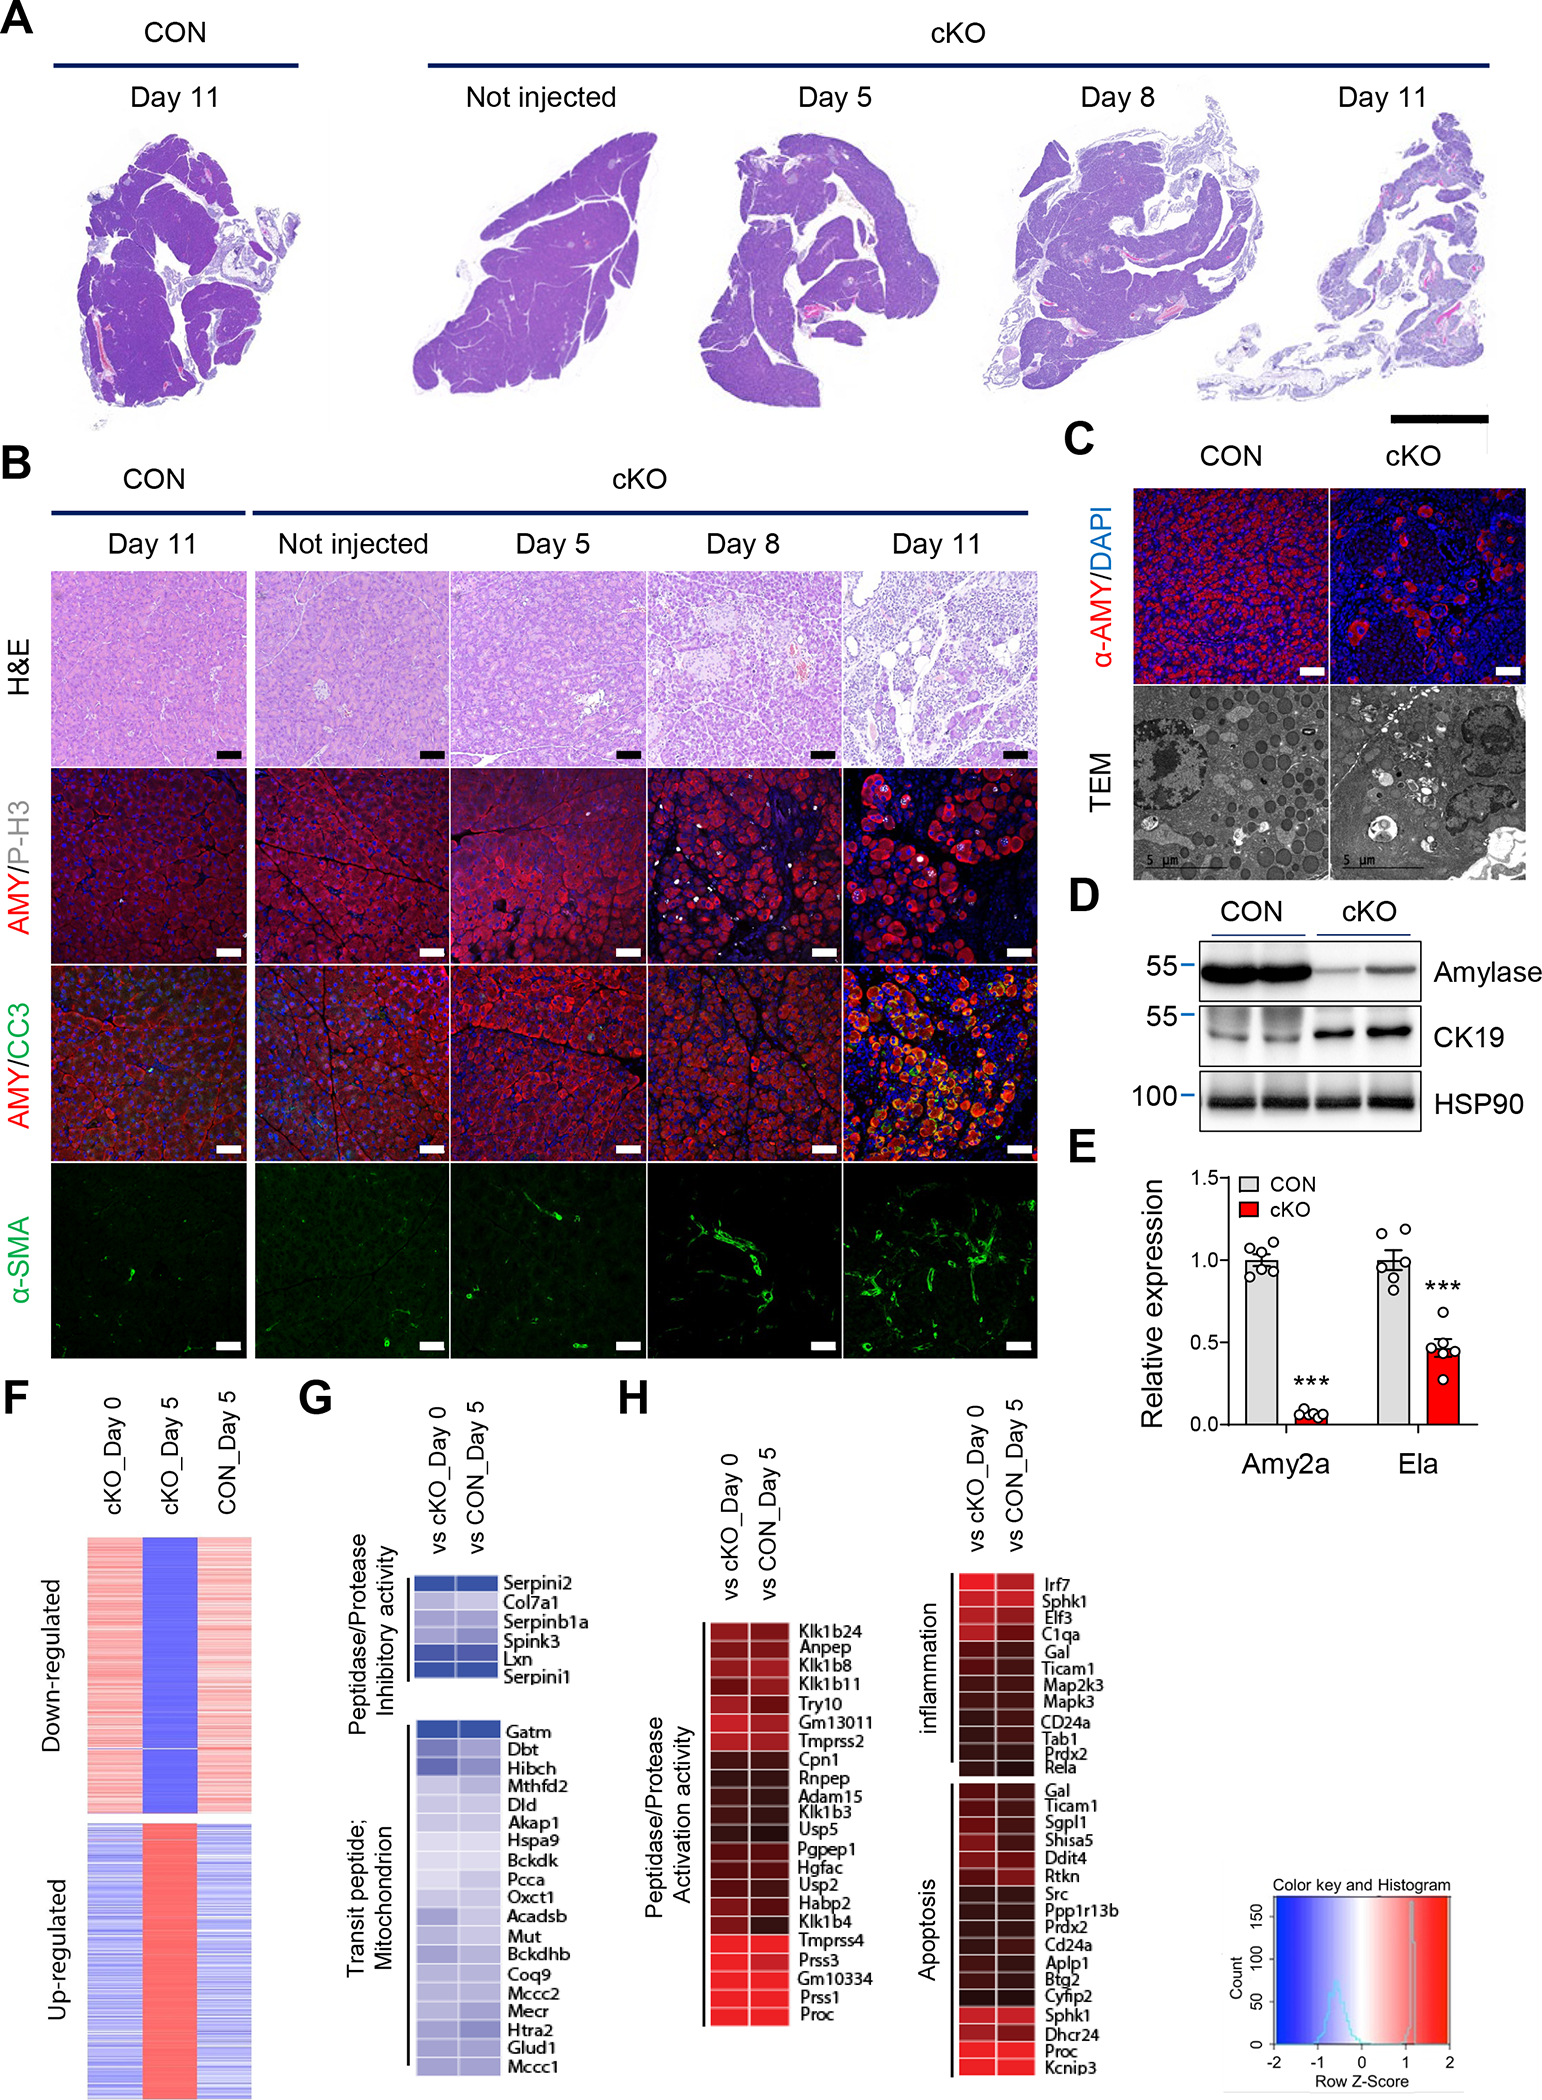
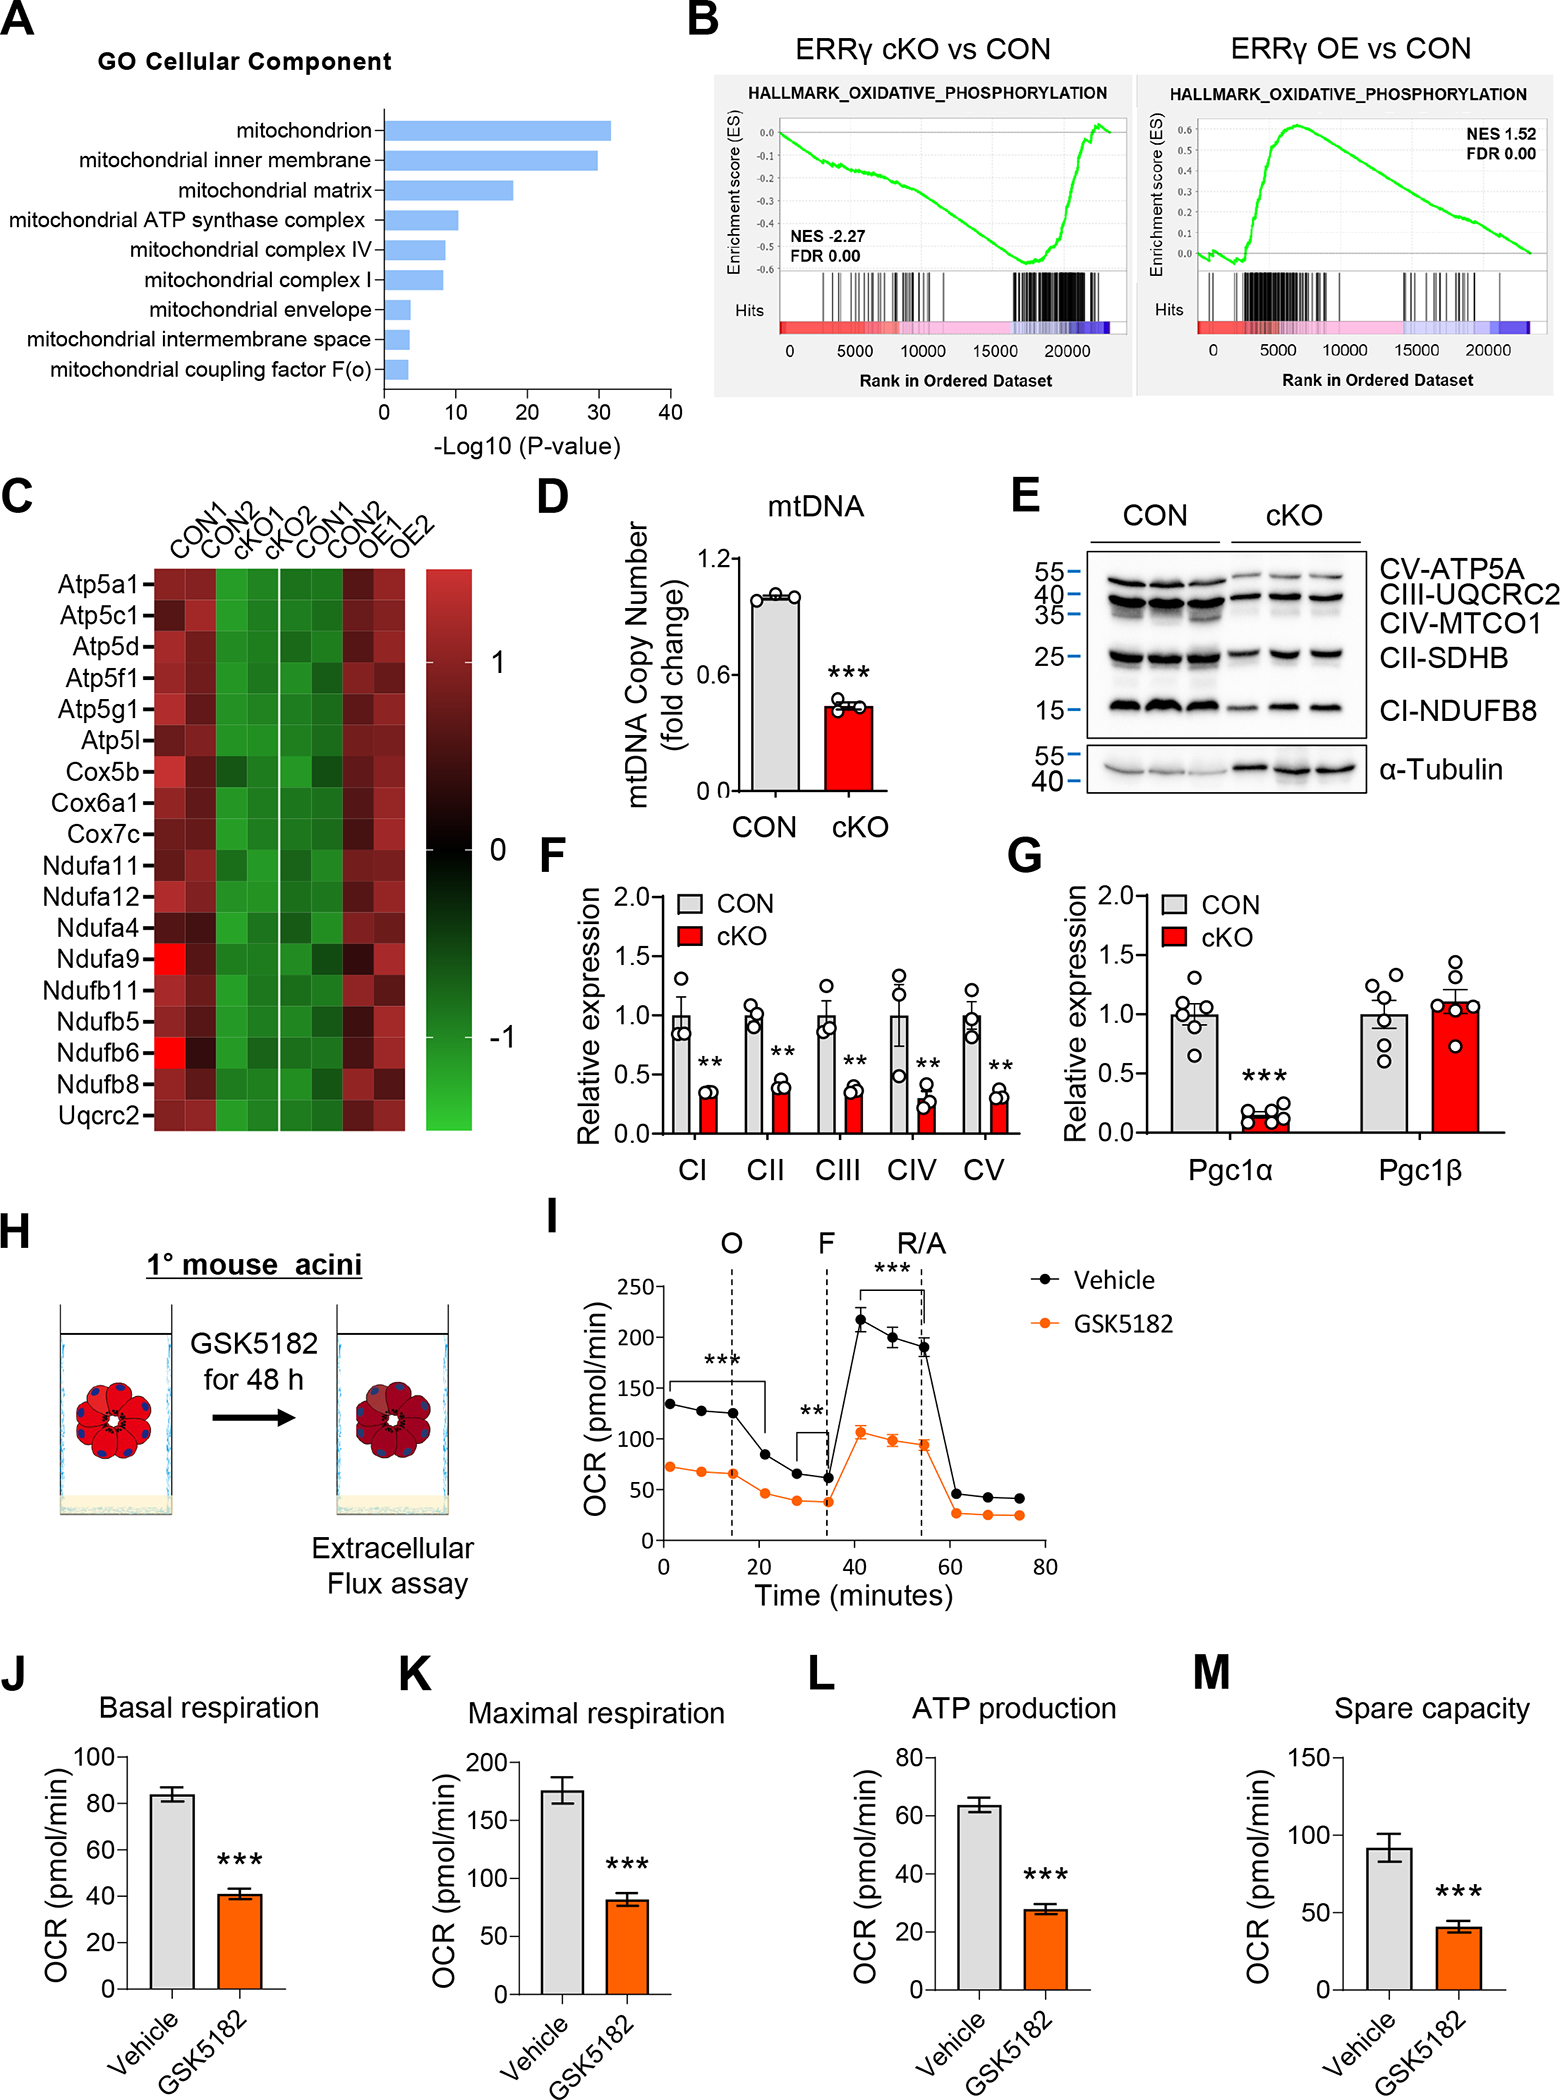
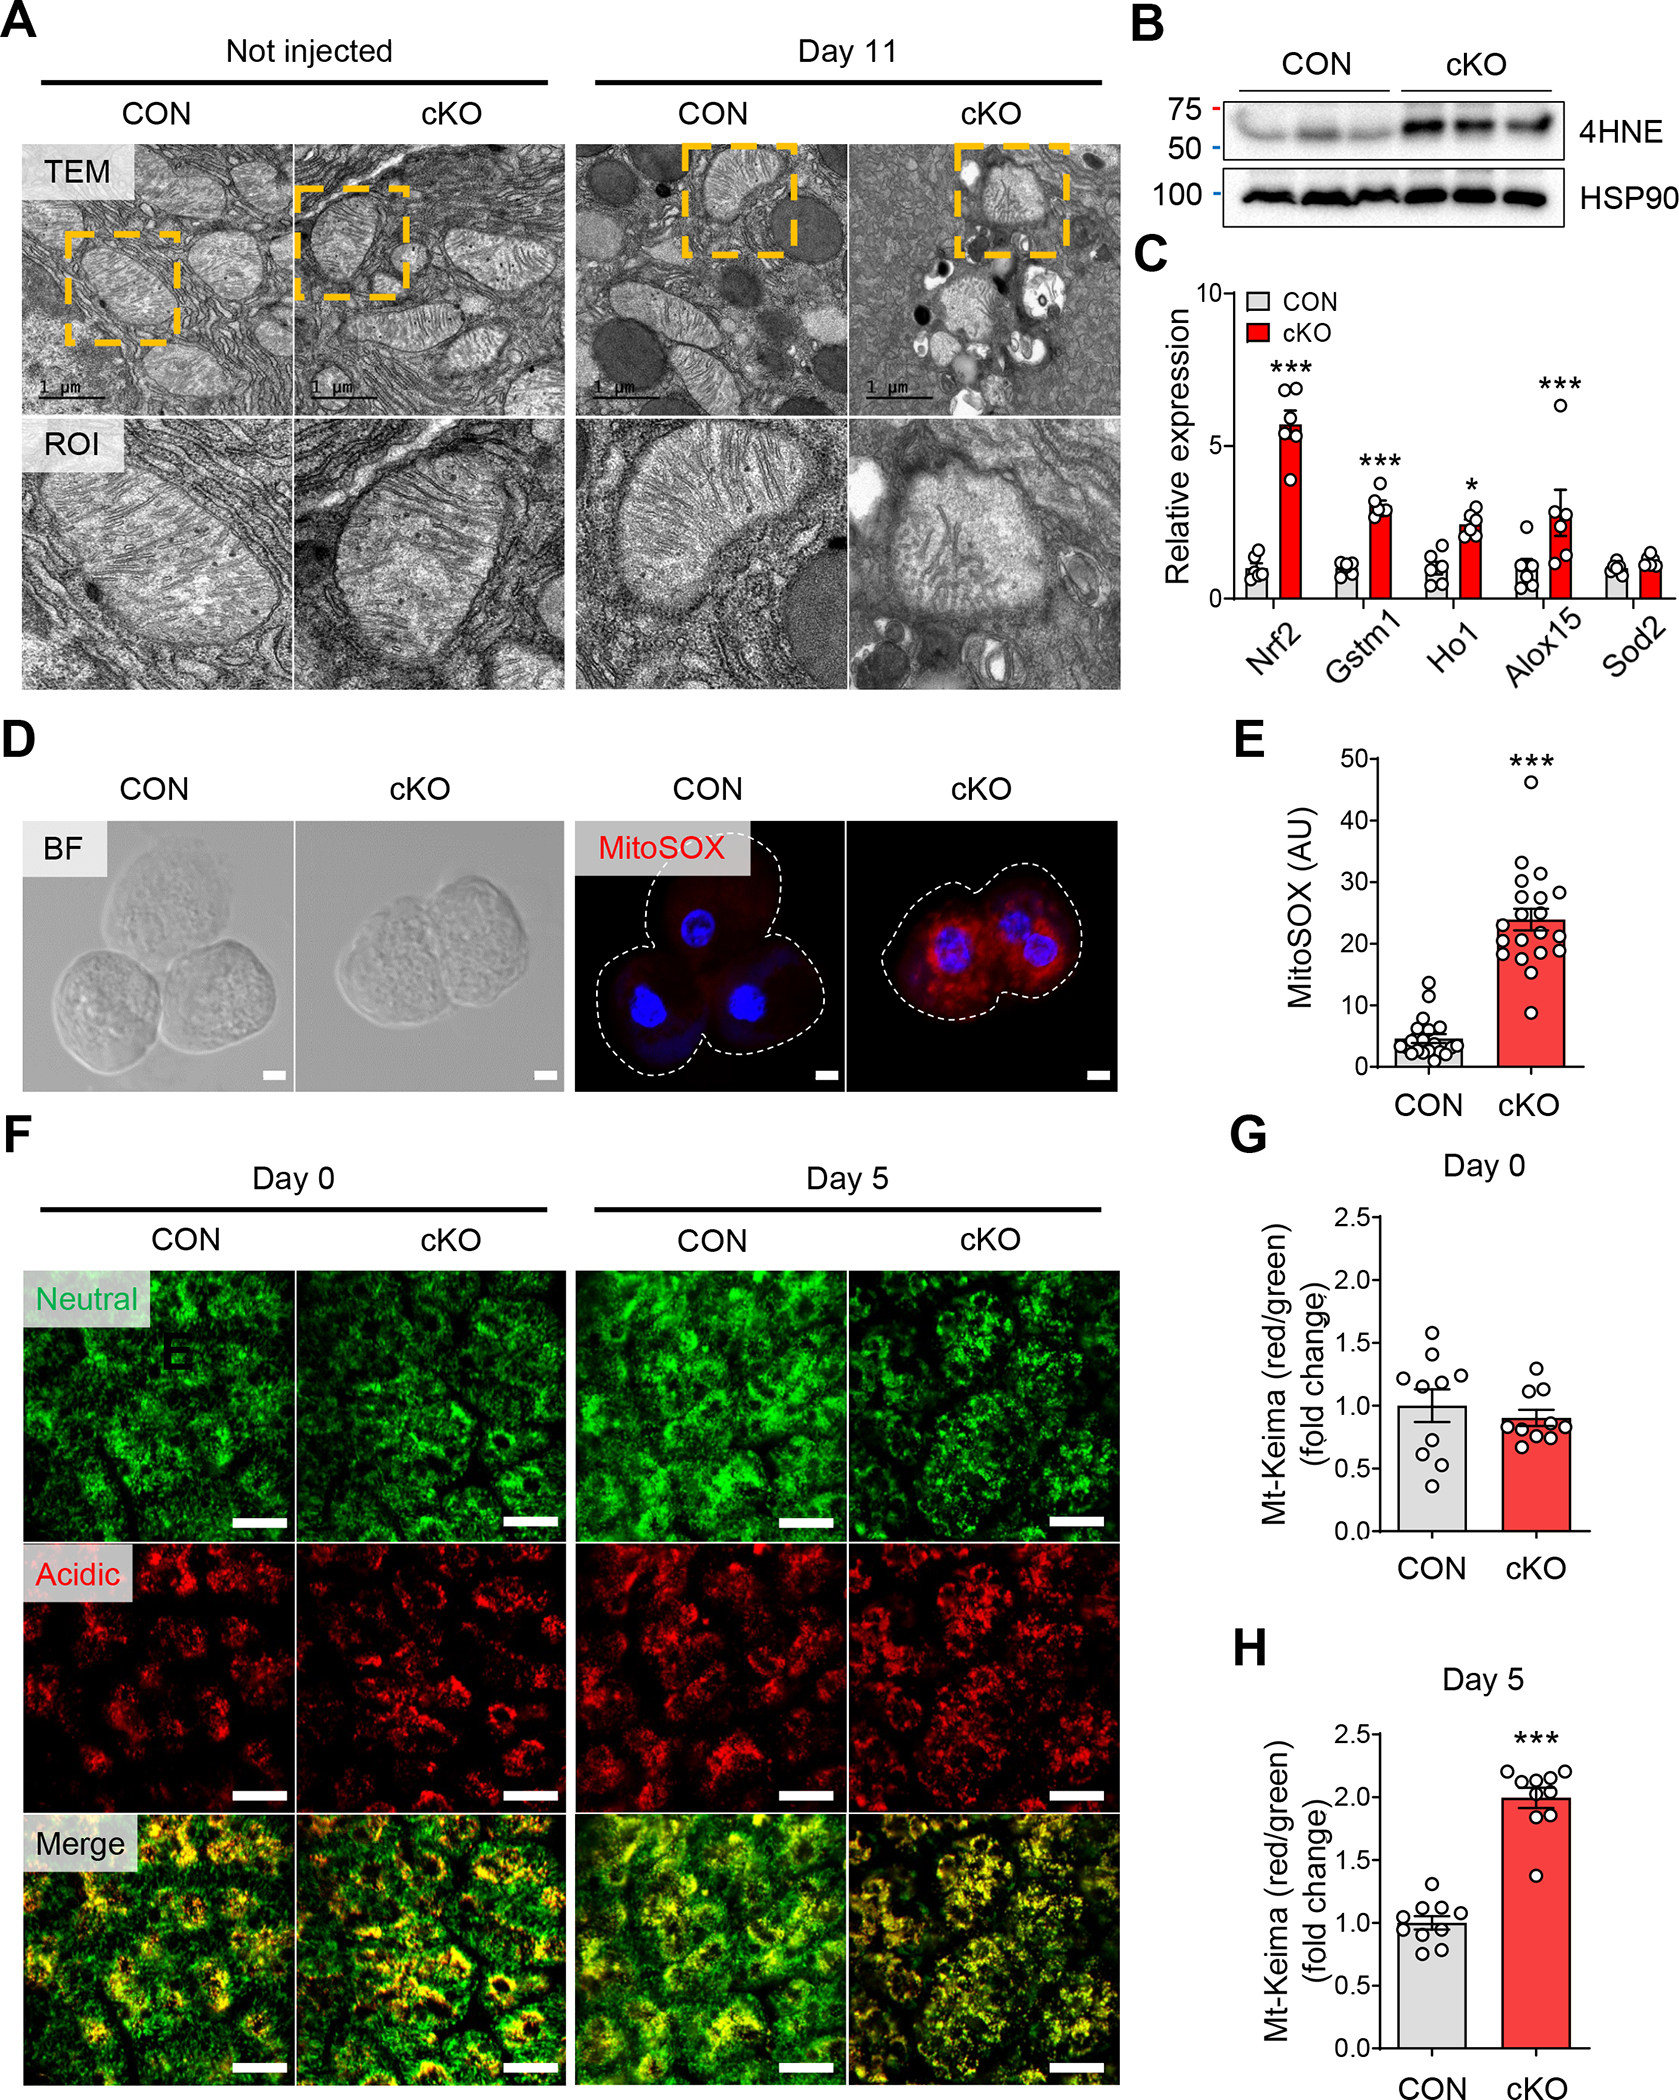
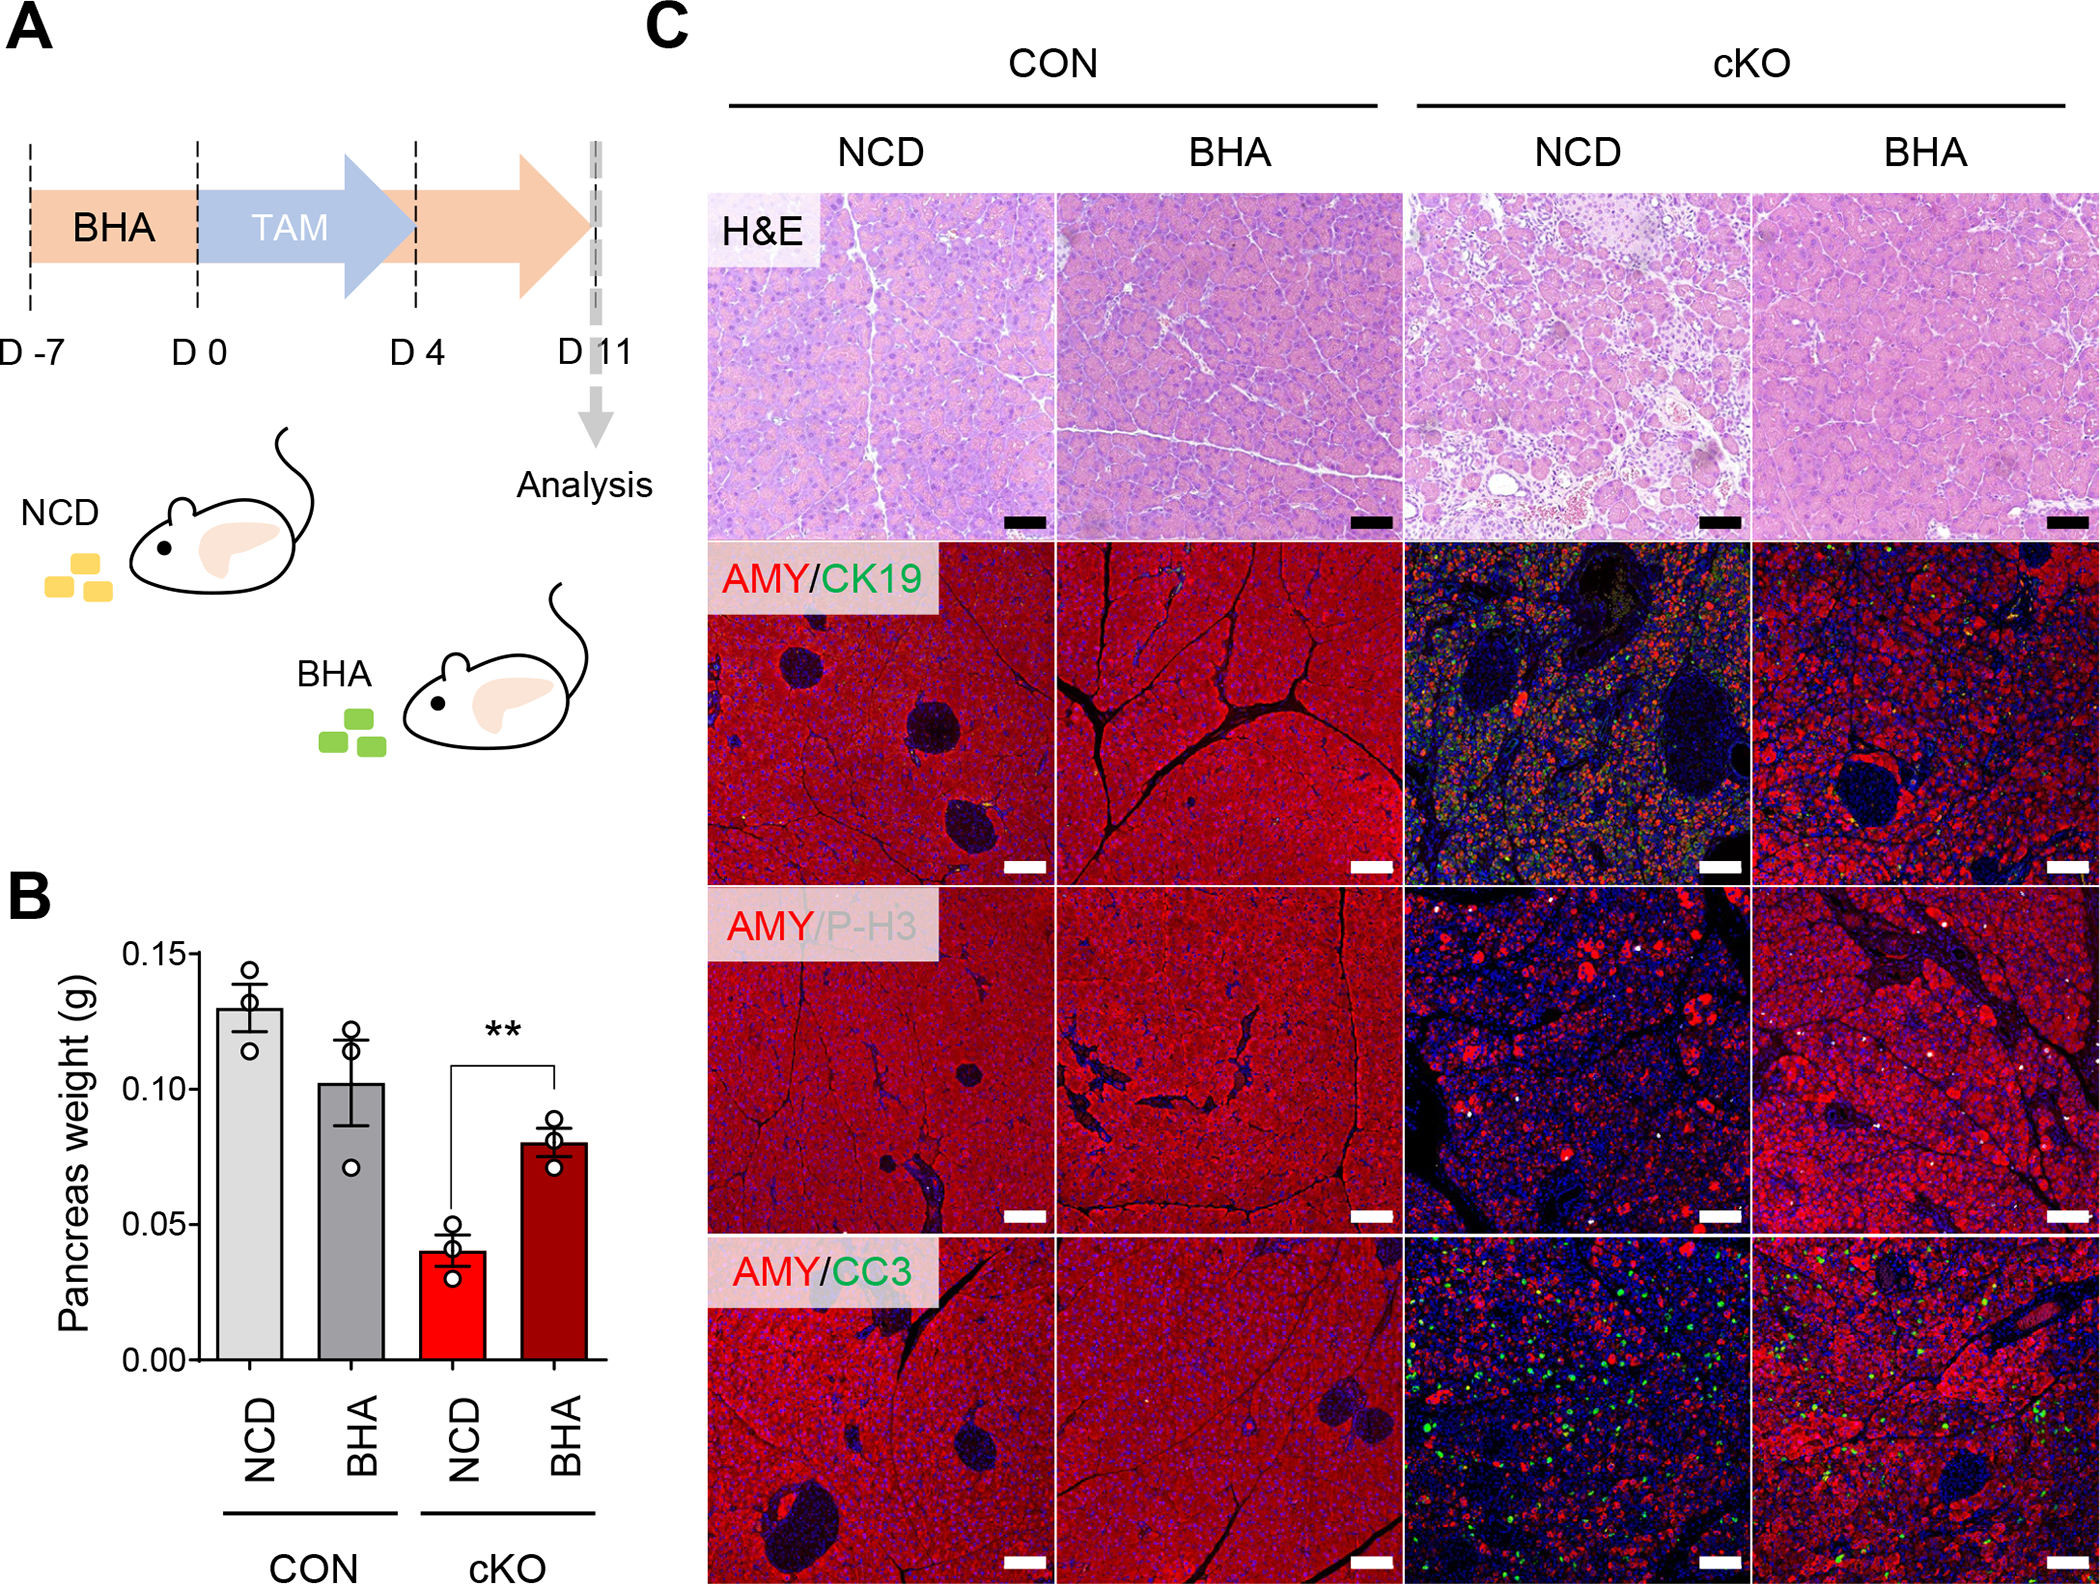
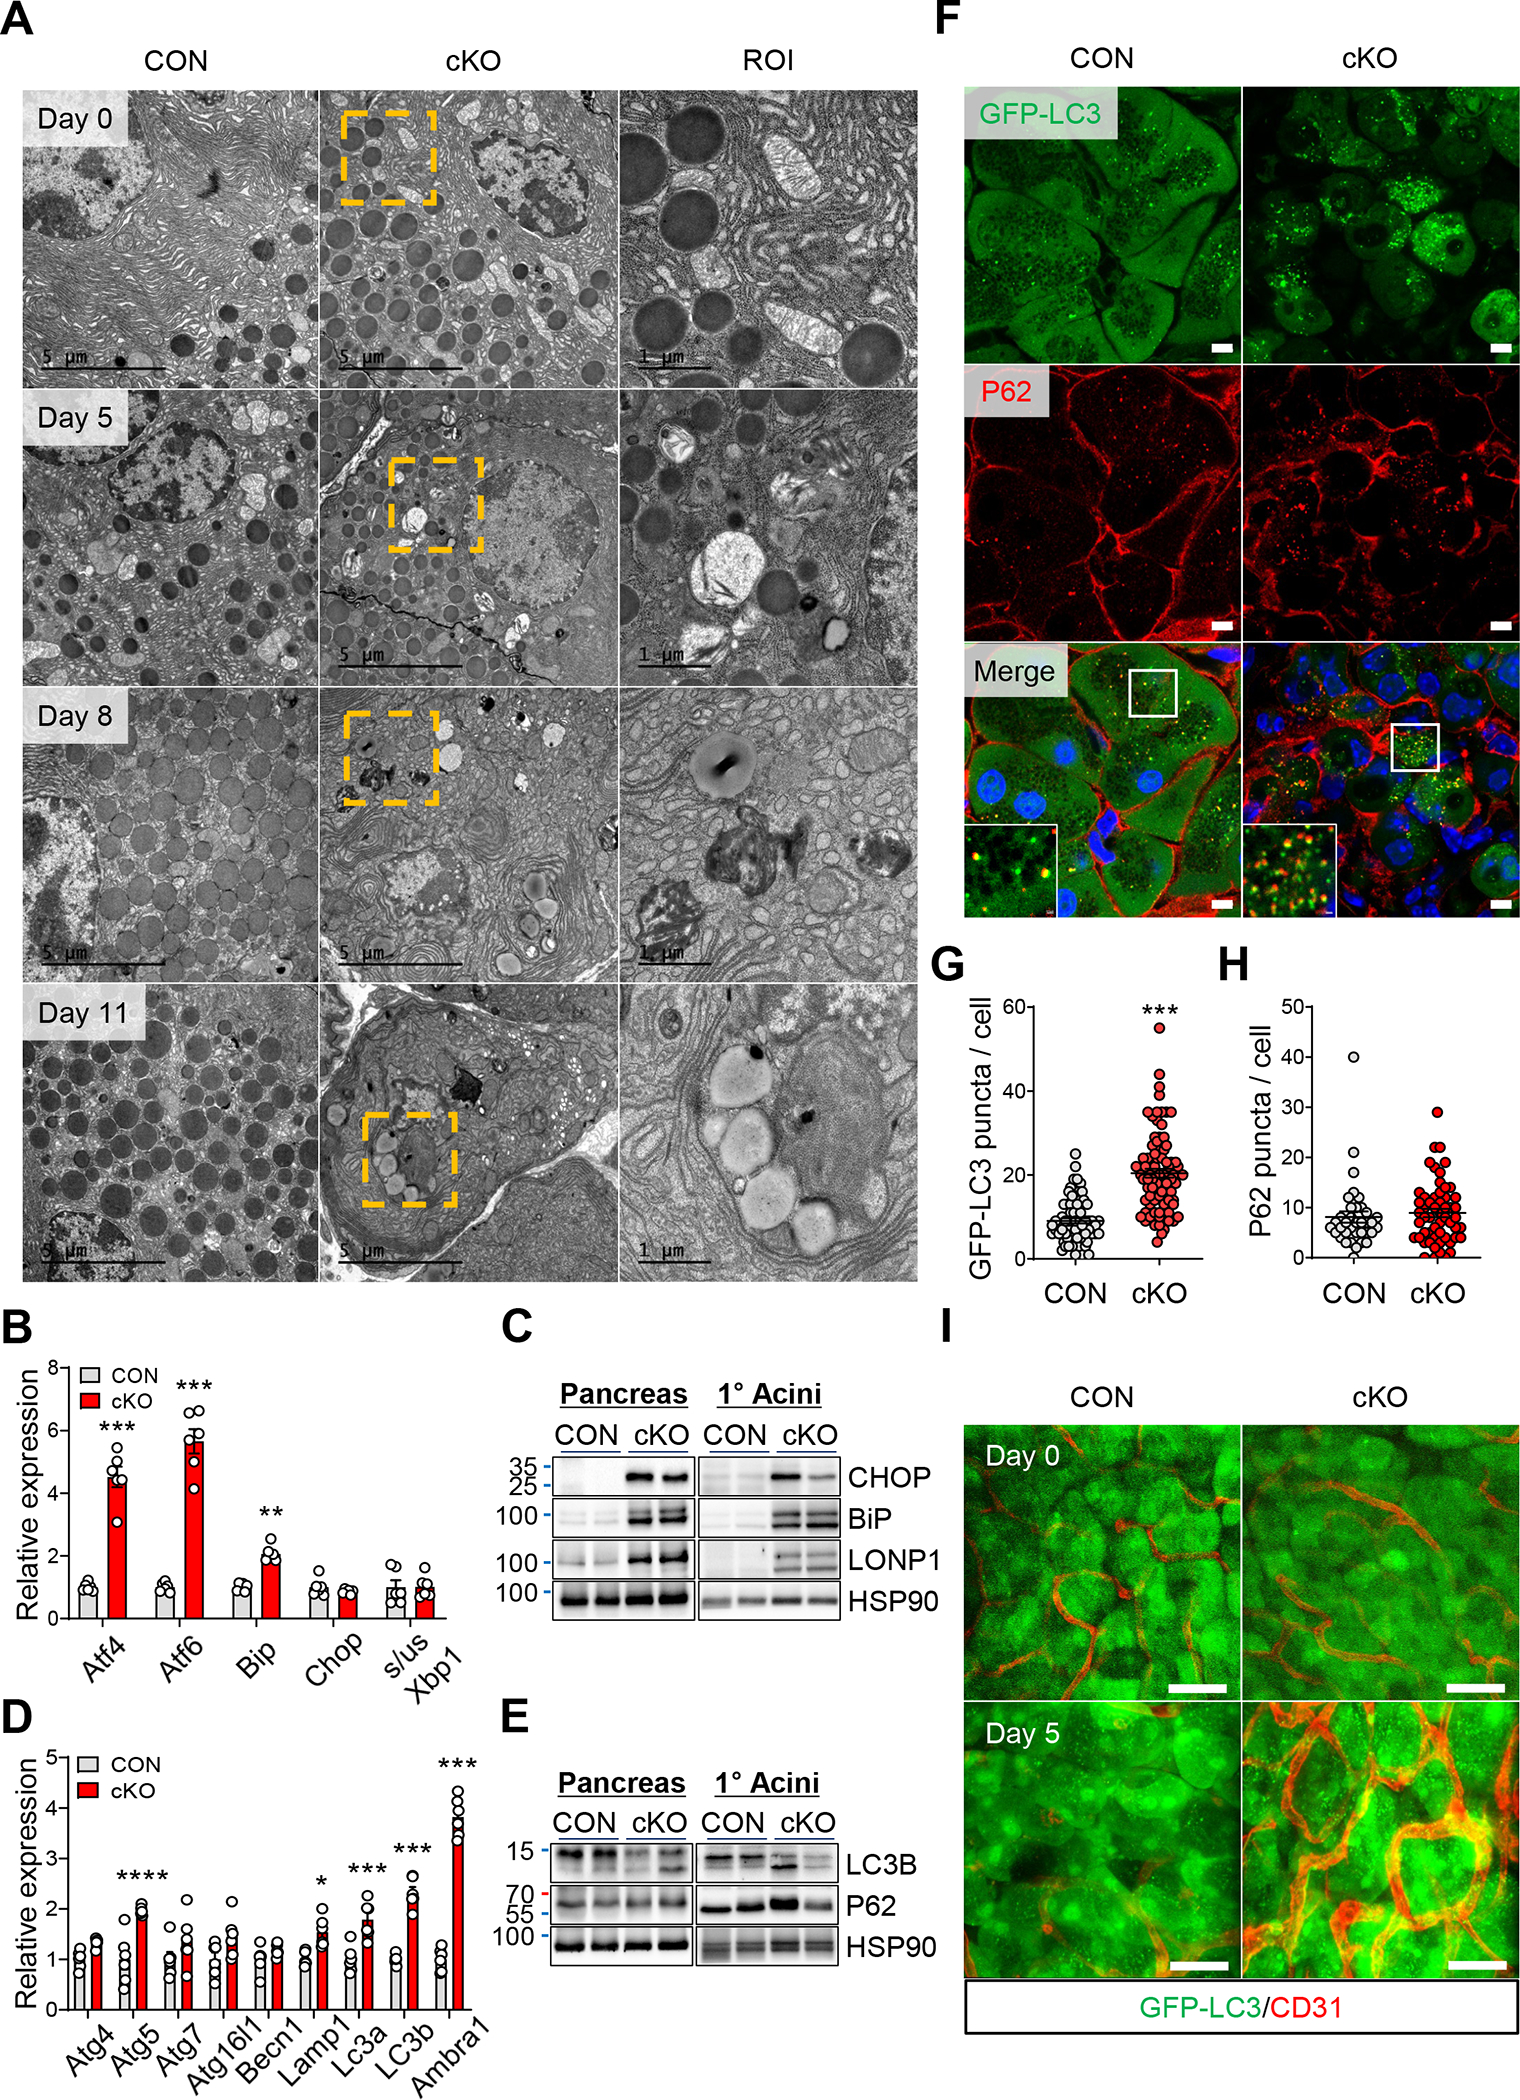
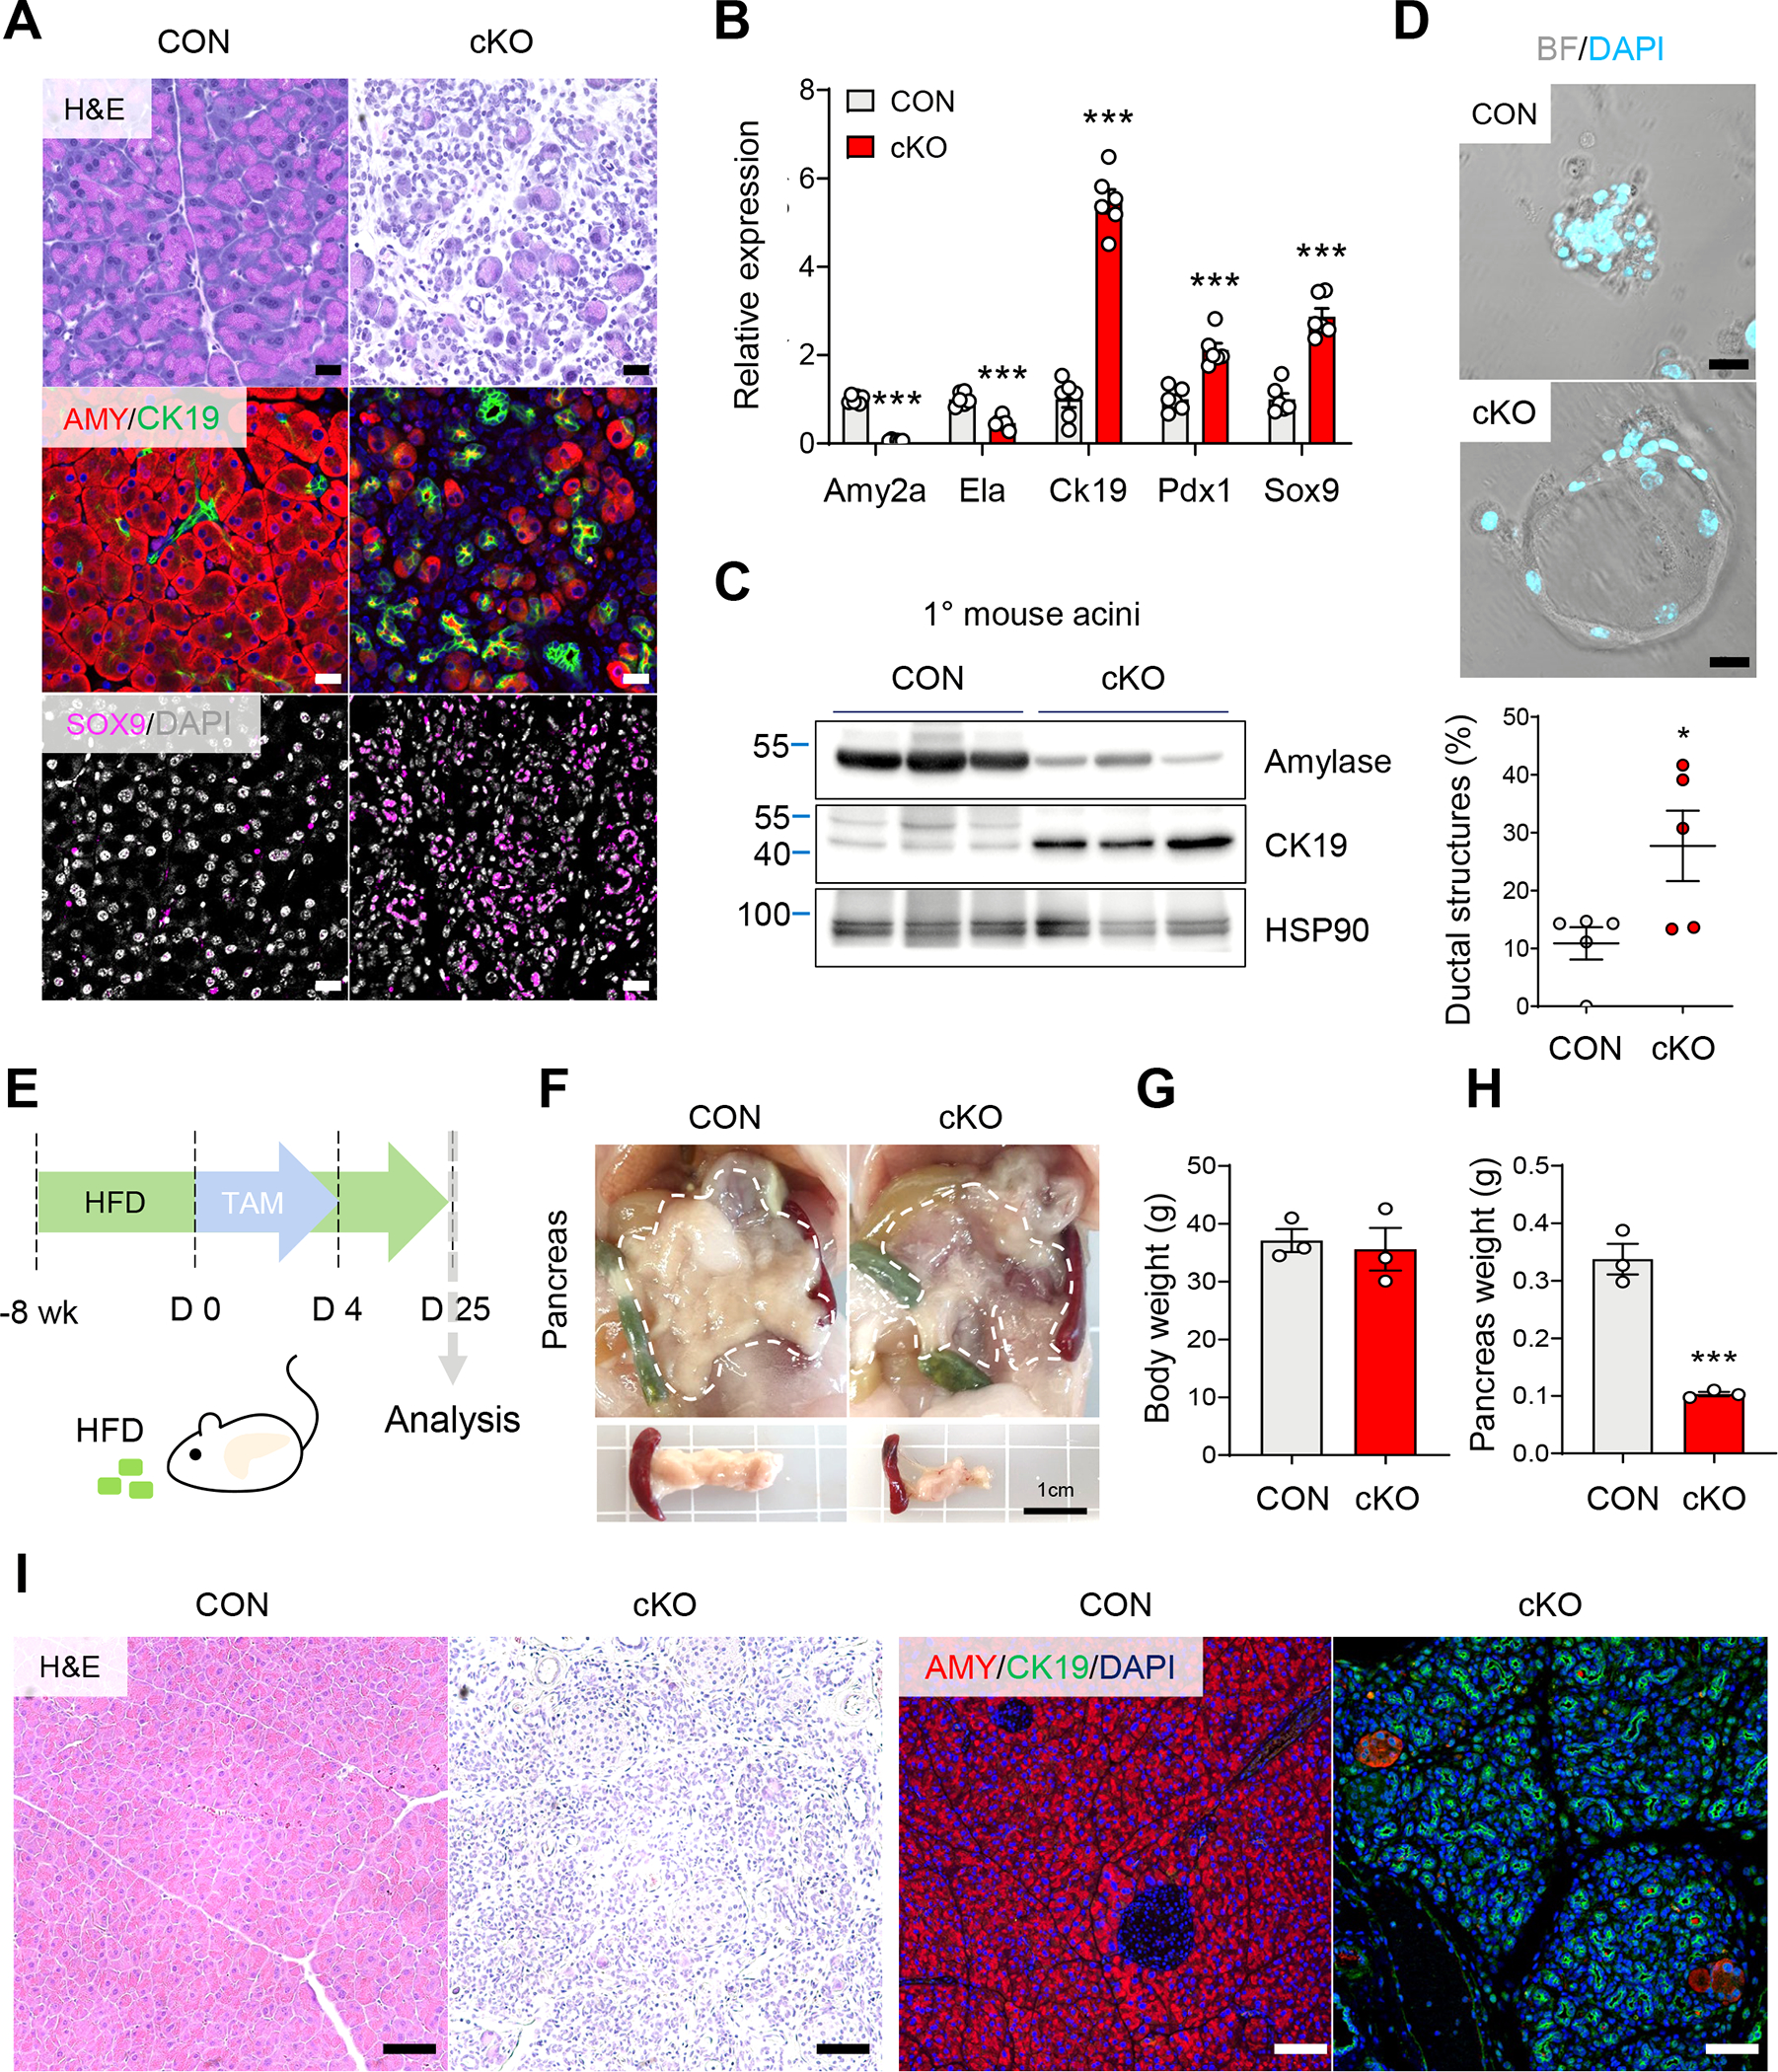
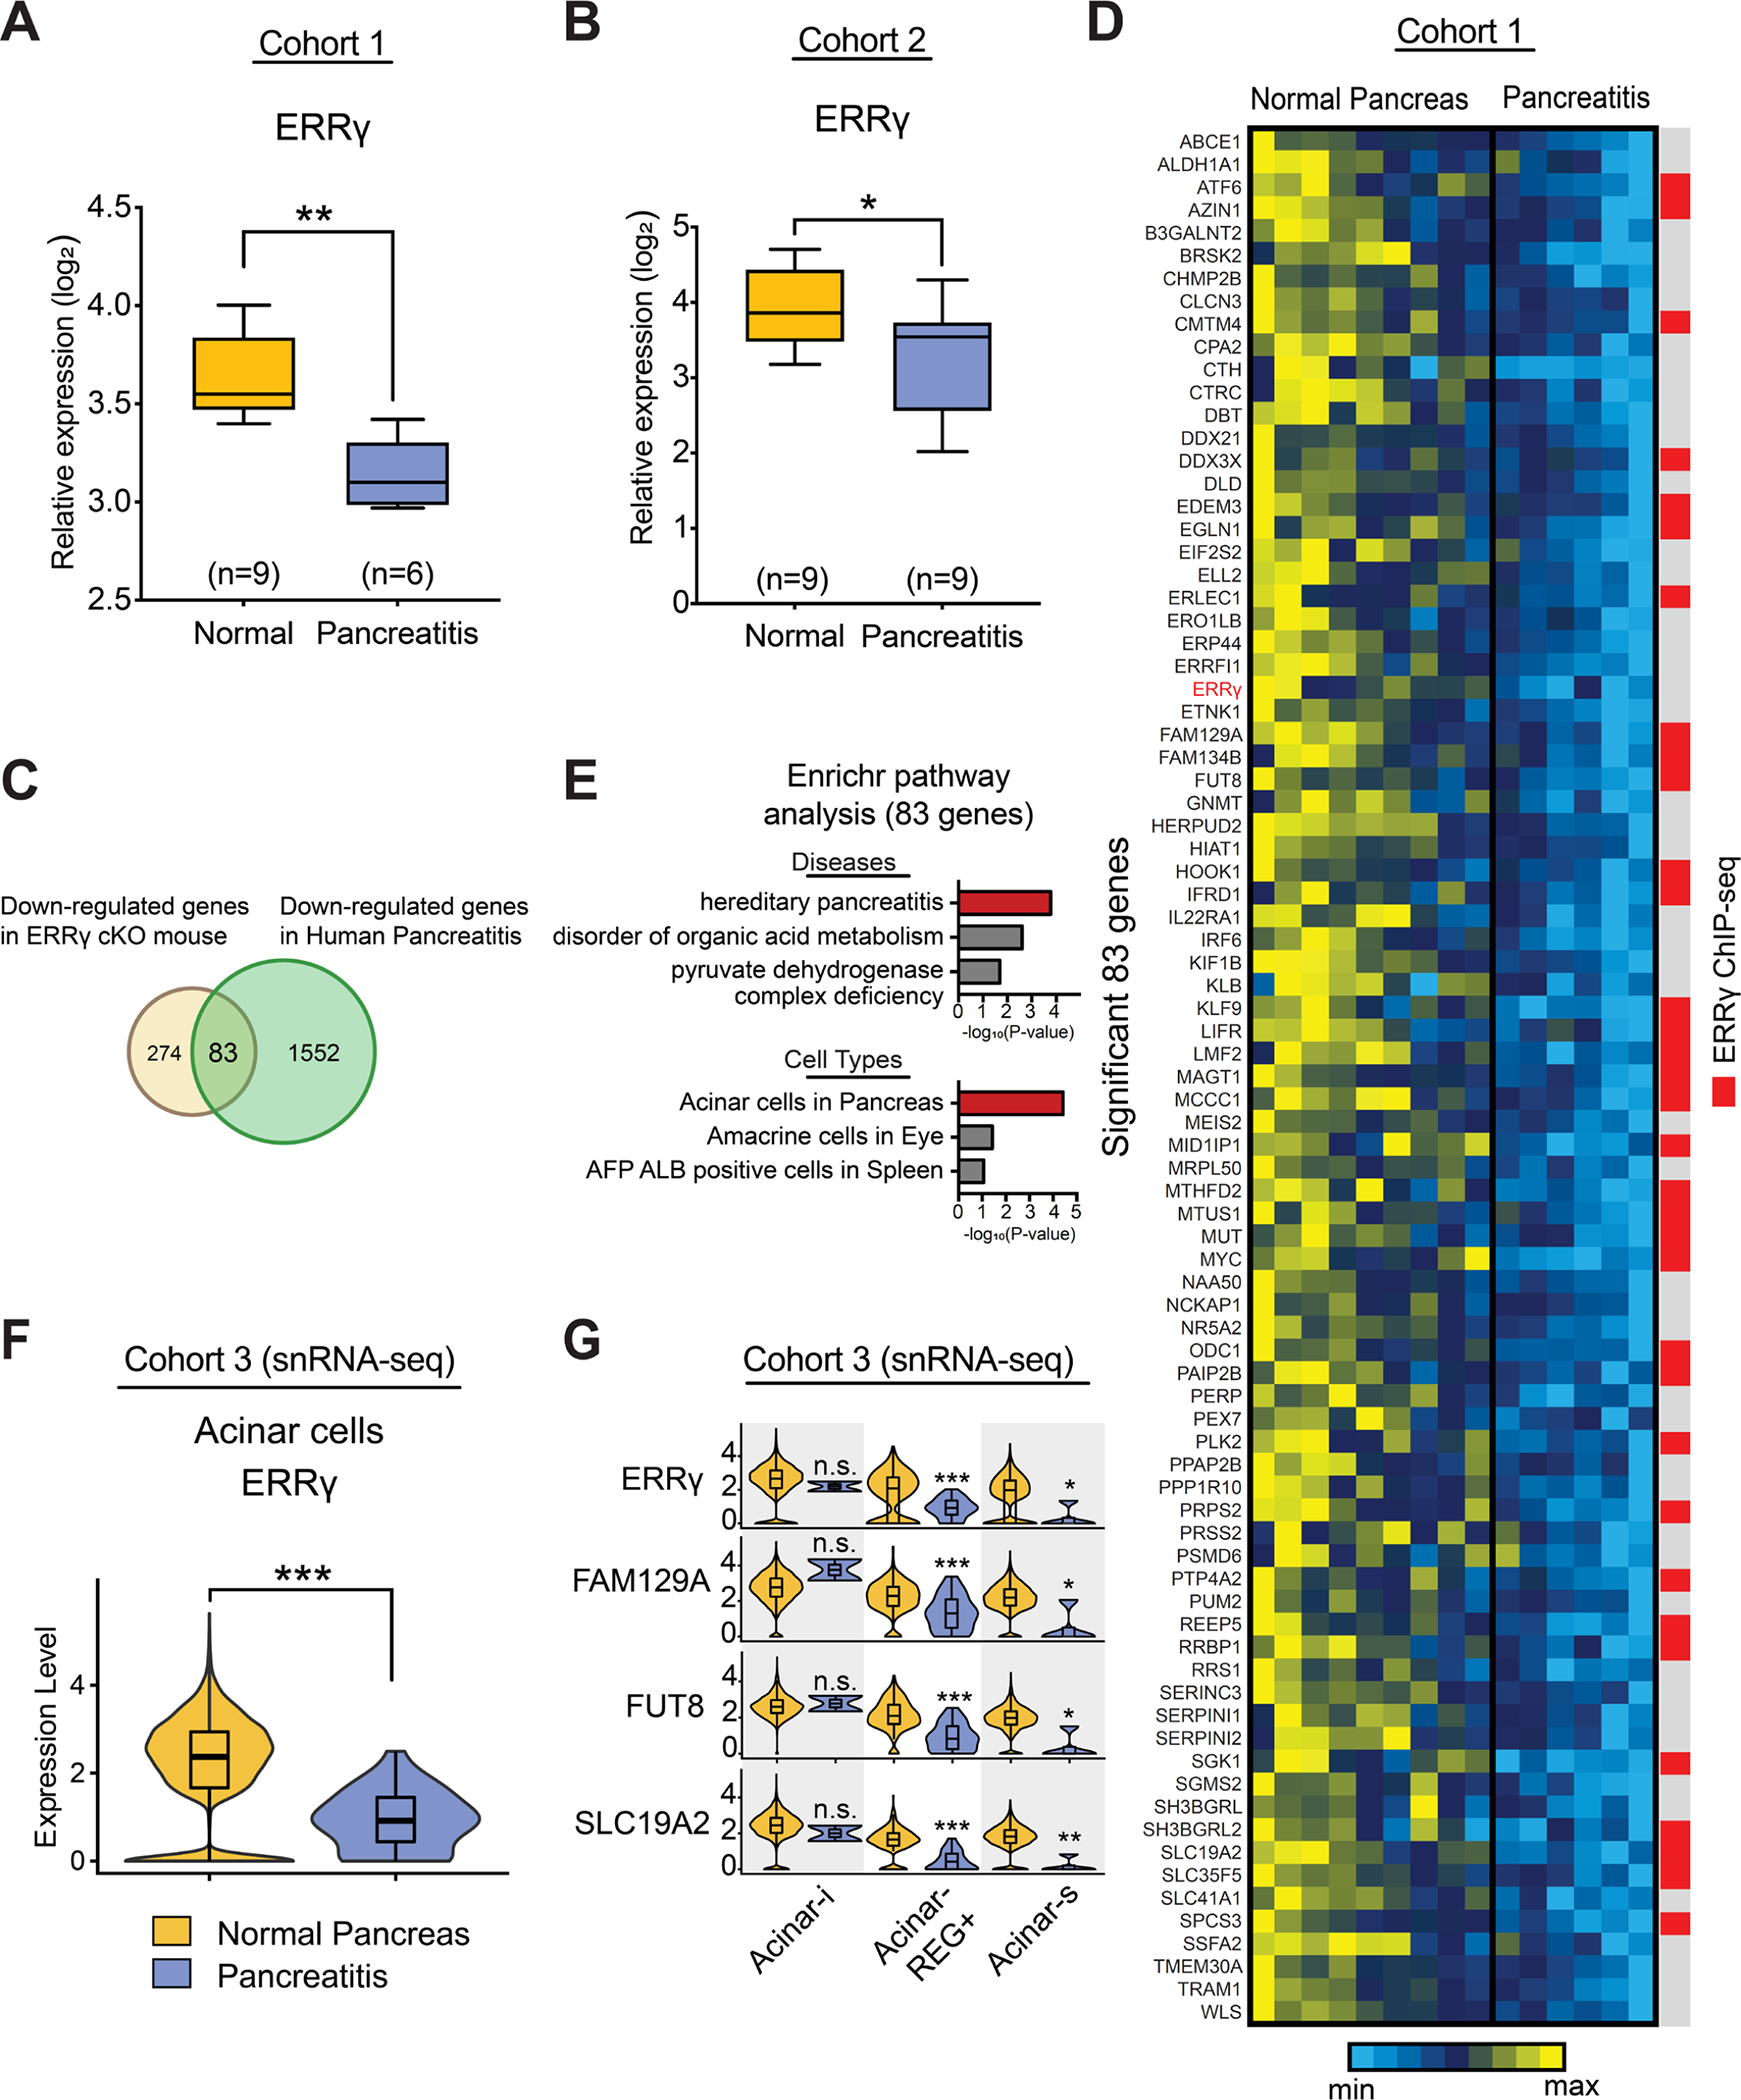
Results: Blocking ERRγ function in mice by genetic deletion or inverse agonist treatment results in striking pancreatitis-like phenotypes accompanied by inflammation, fibrosis, and cell death. Mechanistically, loss of ERRγ in primary acini abrogates messenger RNA expression and protein levels of mitochondrial oxidative phosphorylation complex genes, resulting in defective acinar cell energetics. Mitochondrial dysfunction due to ERRγ deletion further triggers autophagy dysfunction, endoplasmic reticulum stress, and production of reactive oxygen species, ultimately leading to cell death. Interestingly, ERRγ-deficient acinar cells that escape cell death acquire ductal cell characteristics, indicating a role for ERRγ in acinar-to-ductal metaplasia. Consistent with our findings in ERRγ cKO mice, ERRγ expression was significantly reduced in patients with chronic pancreatitis compared with normal subjects. Furthermore, candidate locus region genetic association studies revealed multiple single nucleotide variants for ERRγ that are associated with chronic pancreatitis.

Conclusions: Collectively, our findings highlight an essential role for ERRγ in maintaining the transcriptional program that supports acinar cell mitochondrial function and organellar homeostasis and provide a novel molecular link between ERRγ and exocrine pancreas disorders.

Keywords: Acinar-to-Ductal Metaplasia; ERRγ; Mitochondrial Oxidative Phosphorylation; Pancreatic Acinar Cells; Reactive Oxygen Species.


Conflict of interest statement

Competing Interests: DCW is cofounder of Ariel Precision Medicine, Pittsburgh, PA. He serves as a consultant, Chief Scientific Officer and may have equity.

Figures

Figure 1.
Figure 1.. ERRγ is required for maintaining the pancreatic exocrine gland
(A) Scheme of experiments. Vehicle or GSK5182 was administered to C57BL/6J mice through an osmotic pump for 1 wk (0.5 mg/day). (B) H&E and immunofluorescence staining of amylase (AMY) in pancreas from vehicle or GSK5182 treated mice. (C) Scheme of experiments. Primary acini isolated from C57BL/6J mice were treated with vehicle or GSK5182 for 48 h. (D) Western blot for amylase and HSP90 in primary acini isolated from C57BL/6J mice. (E) Genomic structure of TAM-induced ERRγ conditional KO (cKO) allele. R26, ROSA26 locus; red triangle, loxP sequence; blue box, exonic regions. (F) PCR analysis of genomic DNA showing the deletion of ERRγ in primary acini from control and ERR cKO mice. (G) Relative gene expression of ERRγ in pancreas from control and ERRγ cKO mice. (H) Gross images of pancreas from control and ERRγ cKO mice 7 d after the final TAM injection. TAM (75 mg/kg) was administered once daily by intraperitoneal injection for 5 consecutive days. Scale bar, 1 cm. (I-J) Body weights (I) and pancreas (J) from control and ERRγ cKO mice. (K) H&E staining (upper panel) and Masson’s trichrome staining (lower panel) of pancreas from control and ERRγ cKO mice. (L) Quantitation of collagen deposited area over total area in trichrome stained pancreas sections. (M) Relative gene expression of fibrosis marker genes in pancreas from control and ERRγ cKO mice. Results were normalized to 36b4. CON, control; cKO, ERRγ cKO. All data are presented as mean ± SEM. * p < 0.05, ** p < 0.01, *** p < 0.005 by student’s t-test.
Figure 2.
Figure 2.. ERRγ deletion causes rapid and progressive pancreatic atrophy.
(A-B) Images of control and ERRγ cKO pancreas sections with H&E staining or fluorescence immunostaining for amylase (AMY, red), phospho-H3 (P-H3, white), cleaved caspase 3 (CC3, green), α-smooth muscle actin (α-SMA, green), and DAPI (blue). Pancreas samples obtained on indicated day after final TAM injection. (C) Immunofluorescence images for α-amylase (red) and DAPI (blue) in control and ERRγ cKO pancreas. Scale bar, 50 μm (upper panel). Transmission electronic microscopy images of pancreas from control and ERRγ cKO mice. Scale bar, 5 μm (lower panel). (D) Western blot for amylase, CK19 and HSP90 in pancreas from control and ERRγ cKO mice. (E) Relative gene expression of amylase2a (Amy2a) and elastase (Ela). (F) RNA-seq analysis of whole pancreas transcriptome. Cluster analysis of differentially expressed genes in pancreas from ERRγ cKO mice before TAM injection (cKO day 0), after the final day of TAM injection (cKO day 5), and control mice after the final day of TAM injection (CON day 5). (G-H) Gene ontology (GO) analysis of upregulated genes (G) and downregulated genes in ERRγ cKO pancreas compared to indicated sample. CON, control; cKO, ERRγ cKO. All data are presented as mean ± SEM. *** p < 0.005 by student’s t-test.
Figure 3.
Figure 3.
ERRγ is an essential regulator of the mitochondrial OXPHOS program in pancreatic acinar cells. (A-B) Gene ontology (GO) (A) and gene set enrichment analysis (GSEA) (B) of top rank enriched cellular components between ERRγ cKO primary acini and ERRγ adenovirus transduced (ERRγ OE) primary acini, compared to respective controls (CON). (C) Heatmap for differential gene expression in ERRγ cKO primary acini and ERRγ OE primary acini, compared to respective controls. (D-G) Pancreatic RNA, DNA, and protein were extracted from control and ERRγ cKO mice 7 d after the final TAM injection. (D) Mitochondrial DNA content was quantified by ND1 (mtDNA) / HK2 (nDNA) ratio. (E) Western blot for OXPHOS complex proteins in pancreas from control and ERRγ cKO mice. α-tubulin, loading control. (F) Quantitation of protein levels from (E) normalized to α-Tubulin expression. (G) Relative gene expression of PGC1α and PGC1β. (H) Scheme of experiments. Primary acini from C57BL/6J mice were treated with vehicle or GSK5182 (10 μM) for 48 h. (I-M) Extracellular flux analysis measurements for (I) oxygen consumption rate, (J) basal respiration, (K) maximal respiration, (L) ATP production and (M) spare capacity. CON, control; cKO, ERRγ cKO. All data are presented as mean ± SEM. ** p < 0.01, *** p < 0.005 by student’s t-test.
Figure 4.
Figure 4.. Mitochondrial dysfunction by ERRγ deletion induces ROS in pancreatic acinar cells.
(A) Transmission electronic microscopy images of pancreas tissue showing acinar cell mitochondria from control and ERRγ cKO 0 d (left panel) and 7 d (right panel) after the final TAM injection. Scale bar, 1 μm. (B) Western blot for 4-HNE and HSP90 in pancreas from control and ERRγ cKO mice 3 d after the final TAM injection. (C) Bright field (left panel) and fluorescence (right panel) images for MitoSOX (red) and DAPI (blue) in primary acini isolated from control and ERRγ cKO mice pancreas. MitoSOX fluorescence indicates production of mitochondrial superoxide. Scale bar, 5 μm. (D) Quantitation of MitoSOX fluorescence intensity (arbitrary units). (E) Relative gene expression of antioxidant markers in pancreas from control and ERRγ cKO mice. Results were normalized to 36b4. (F) In vivo time-course imaging of pancreas in control and ERRγ cKO; mt-Keima mice. mt-Keima protein is localized in the mitochondrial matrix and displays a bimodal excitation peak that is pH-dependent. The 488 nm excitation peak of mt-Keima (green) indicates mitochondria exposed to a neutral environment. The 561 nm excitation peak of mt-Keima (red) indicates mitochondria exposed to an acidic environment. Scale bar, 50 μm. (G-H) Quantitation of the mitophagy index as calculated by red/green area of mt-Keima signals at d 0 (G) and d 5. CON, control; cKO, ERRγ cKO. All data are presented as mean ± SEM. * p < 0.05, *** p < 0.005 by student’s t-test.
Figure 5.
Figure 5.. Antioxidant treatment ameliorates degenerative pancreatic phenotypes in ERRγ cKO mice.
(A) Scheme of experiments. Control and ERRγ cKO mice were fed with normal chow diet (NCD) or NCD supplemented with butylated hydroxyanisole (BHA) for 1 wk prior to first TAM injection and analyzed 7 d after the final TAM injection. (B) Pancreas weights from NCD or BHA fed control and ERRγ cKO mice. (C) H&E staining and fluorescence immunostaining of pancreas in NCD or BHA fed control and ERRγ cKO mice for amylase (AMY, red), phospho-H3 (P-H3, white), cleaved caspase 3 (CC3, green) and DAPI (blue). CON, control; cKO, ERRγ cKO. Scale bar, 50 μm. All data are presented as mean ± SEM. ** p < 0.01 by student’s t-test.
Figure 6.
Figure 6.. Loss of ERRγ results in ER stress and autophagy in pancreatic acinar cells.
(A) Transmission electronic microscopy images of pancreas tissue showing acinar cell from control and ERRγ cKO pancreas at indicated day after the final TAM injection. Scale bar, 5 μm and 1 μm for region of interest (ROI) (B) Western blot for ER stress markers in pancreas and primary acini from ERRγ cKO mice, compared to control 4 d after the final TAM injection. (C) Relative gene expression of ER stress markers in pancreas from control and ERRγ cKO mice. Results were normalized to 36b4. (D) Western blot for autophagy markers in pancreas and primary acinar cells of ERRγ cKO mice. (E) Relative gene expression of autophagy markers in pancreas from control and ERRγ cKO mice. Results were normalized to 36b4. (F) P62 immunofluorescence staining of frozen tissue sections from control and ERRγ cKO; GFP-LC3 transgenic mice pancreas. Scale bar, 5 μm (G-H) Quantitation of GFP-LC3 puncta per cell (G) and P62 puncta per cell (H). (I) Intravital imaging control and ERRγ cKO; GFP-LC3 transgenic pancreas. GFP-LC3 puncta (green) indicate autophagosomes and CD31 (red) indicates blood vessels. CON, control; cKO, ERRγ cKO. Scale bar, 50 μm. All data are presented as mean ± SEM. * p < 0.05, ** p<0.01, *** p < 0.005 by student’s t-test.
Figure 7.
Figure 7.. ERRγ deletion induces acinar cell reprogramming.
(A) H&E and immunofluorescence images for amylase (AMY, red), CK19 (green), and SOX9 (magenta) control and ERRγ cKO pancreas 7 d after the final TAM injection. Scale bar, 20 μm. (B) Relative gene expression of pancreatic lineage markers from control and ERRγ cKO mice pancreas. Results were normalized to 36b4. (C) Western blot for amylase, CK19 and HSP90 in primary acini isolated from control and ERRγ cKO mice. (D) Micrographs of ex vivo cultured primary acini on gelatin-coated wells (upper panel) and quantitation of percent duct-like cells over total cells per well (lower panel). Scale bar, 20 μm. (E) Scheme of experiments. Control and ERRγ cKO mice were fed high-fat diet (HFD) for 8 wk and then intraperitoneally injected with TAM (75mg/kg) daily for 5 consecutive days. Analysis was performed 2 wk after the final TAM injection. (F-H) gross images (F), body weights (G), and pancreas weights (H) from control and ERRγ cKO mice. Scale bar, 1 cm. (I) H&E and immunofluorescence images for amylase (red) and CK19 (green) in control and ERRγ KO pancreas. Scale bar, 50 μm. CON, control; cKO, ERRγ cKO. All data are presented as mean ± SEM. * p < 0.05, *** p < 0.005, by student’s t-test.
Figure 8.
Figure 8.. ERRγ and ERRγ-dependent genes are downregulated in human pancreatitis cohorts.
ERRγ expression in normal pancreas (n=9) and pancreatitis (n=6) from the human cohort 1 (GSE143754). The microarray data was extracted and normalized. Expression level was shown as log2 scale. (B) ERRγ expression in normal pancreas (n=9) and pancreatitis (n=9) from the human cohort 2 (E-EMBL-6). The microarray data was extracted and normalized. Expression level was shown as log2 scale. (C) Overlapping genes between down-regulated genes in ERRγ cKO mouse and down-regulated genes in human pancreatitis from human cohort 1. (D) The heatmap shows expression patterns of overlapping genes. Individual gene expression was normalized and shown as a range of min and max. Comparison of overlapping gene set with ERRγ ChIP-seq peaks was presented using red color. (E) Enrichr analysis predicts diseases and cell types. The overlapping gene set is associated with hereditary pancreatitis as a top predicted disease. The top predicted cell type was acinar cells in pancreas. The scale was presented in -log10(P-value). (F) Single nucleus RNA-seq analysis showing decreased ERRγ expression in acinar cells. The snRNA-seq object was established from the EGA dataset (EGAD00001006396). (G) In acinar-REG+ and acinar-s cells, gene expression of the expected ERRγ targets was significantly decreased, but not in acinar-i cells.

References

    1. Voronina SG, Barrow SL, Simpson AW, et al. Dynamic changes in cytosolic and mitochondrial ATP levels in pancreatic acinar cells. Gastroenterology 2010;138:1976–87. - PMC - PubMed
    1. Biczo G, Vegh ET, Shalbueva N, et al. Mitochondrial Dysfunction, Through Impaired Autophagy, Leads to Endoplasmic Reticulum Stress, Deregulated Lipid Metabolism, and Pancreatitis in Animal Models. Gastroenterology 2018;154:689–703. - PMC - PubMed
    1. Gukovsky I, Pandol SJ, Gukovskaya AS. Organellar dysfunction in the pathogenesis of pancreatitis. Antioxid Redox Signal 2011;15:2699–710. - PMC - PubMed
    1. Perez S, Rius-Perez S, Finamor I, et al. Obesity causes PGC-1alpha deficiency in the pancreas leading to marked IL-6 upregulation via NF-kappaB in acute pancreatitis. J Pathol 2019;247:48–59. - PubMed
    1. Badalov N, Baradarian R, Iswara K, et al. Drug-induced acute pancreatitis: an evidence-based review. Clin Gastroenterol Hepatol 2007;5:648–61; quiz 644. - PubMed

Publication types