. 2022 Jun:70:37-44.
doi: 10.1016/j.annepidem.2022.04.003. Epub 2022 Apr 21.

Hospitalization, mechanical ventilation, and case-fatality outcomes in US veterans with COVID-19 disease between years 2020-2021

Affiliations

Hospitalization, mechanical ventilation, and case-fatality outcomes in US veterans with COVID-19 disease between years 2020-2021

Jessica Luo et al. Ann Epidemiol. 2022 Jun.

Abstract

Purpose: Although veterans represent a significant proportion (7%) of the USA population, the COVID-19 disease impact within this group has been underreported. To bridge this gap, this study was undertaken.

Method: A total of 419,559 veterans, who tested positive for COVID-19 disease in the Veterans Affairs hospital system from March 1st, 2020 to December 31st, 2021 with 60-days follow-up, was included in this retrospective review. Primary outcome measures included age-adjusted incidences and relative incidences of COVID-19 hospitalization, mechanical ventilation, and case-fatality outcomes.

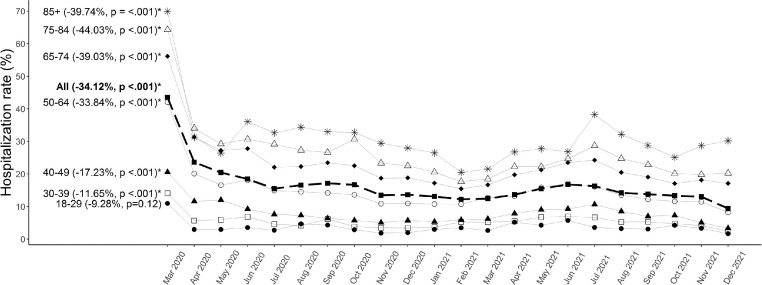
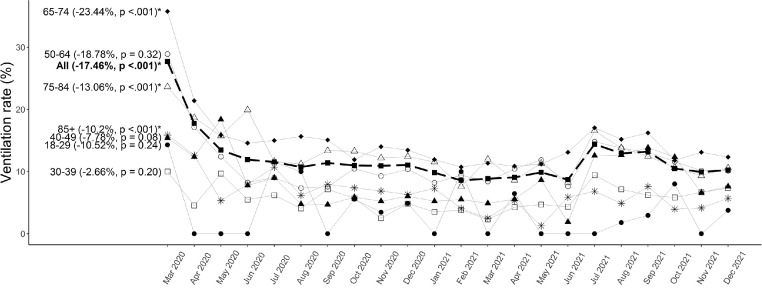
Results: Of this veteran cohort with COVID-19 disease, predominately 85.7% were male, 59.1% were White veterans, 27.5% were ages 50-64, and 40.5% were obese. Although Black veterans were at 63% higher relative risk (RR) for hospitalization incidences, they had a similar risk RR for in-hospital deaths compared to the White-veteran referent. Asian, American Indian/Alaska Native races, advanced age ≥65, and the underweight were at high RR for mechanical ventilator and/or in-hospital deaths compared to respective referent groups. Veterans who are ≥85 years old had a nearly 5-fold higher incidence of death compared respective referent group. The monthly outcomes for hospitalization, ventilation, and case-fatality data showed decreasing trends with time.

Conclusion: An increased incidence of death was associated with age ≥65 years and underweight veterans compared to the referent group. Age-adjusted data, however, did not show any increased incidence of death in Black veterans compared to White veterans.

Ratings of the quality of the evidence: 3 (Case-control studies; retrospective cohort study).

Keywords: COVID-19; Relative incidence, Veterans, Age-adjusted data, Race.


Conflict of interest statement

Declaration of Competing Interest The authors declare the following financial interests/personal relationships which may be considered as potential competing interests: Dr. Jay Agarwal reports financial support was provided by Gilead Sciences Inc. Sujee Jeyapalina reports a relationship with Gilead Sciences Inc that includes: funding grants. Greg Stoddard reports a relationship with Gilead Sciences Inc that includes: funding grants.

Figures

Fig 1
Fig. 1
Hospitalization rates by index month and age group. This graph illustrates the trend over time for veteran hospitalization rates by respective age group. The symbols for each age group are as follows: 18–29 – black circle, 30–39 – open square, 40–49 – black triangle, 50–64 – open circle, 65–74 - black diamond, 75 – 84 – open triangle, 85+ - star. For each age group, hospitalization rates are expressed as a percentage for each index month; rates were calculated by dividing the number of hospitalized veterans who had an index date in that month by the total number of veterans who had an index date in that month, then multiplying by 100. Linear trend tests for the time were performed for each age group by subsetting the data by age group and fitting a univariable modified Poisson regression with hospitalization as outcome and month as the predictor. Absolute percentage decrease in rate from March 2020 to December 2021 and P values for trend tests are shown in parentheses. Age groups showing a significant change in hospitalization over time at the P < .05 level are denoted with an asterisk. For all age groups, there were generally decreasing trends for hospitalization rates from March 2020 to December 2021, except for the 85+ group.
Figure 2
Figure 2
Sixty-day ventilation rates for hospitalized veterans by index month and age group. This graph illustrates the trend over time for veteran ventilation rates by age group for the hospitalized cohort. The symbols for each age group are as follows: 18–29 – black circle, 30–39 – open square, 40–49 – black triangle, 50–64 – open circle, 65–74 - black diamond, 75 – 84 – open triangle, 85+ - star. For each age group, ventilation rates are expressed as a percent for each index month were calculated by dividing the number of hospitalized veterans who had an index date in that month by the total number of veterans who had an index date in that month, then multiplying by 100. Linear trend tests for the time were performed for each age group by subsetting the data by age group and fitting a univariable modified Poisson regression with hospitalization as outcome and month as the predictor. The absolute percentage decrease in rate from March 2020 to December 2021and P values for the trend tests are shown above in parentheses. Age groups showing a significant change in ventilation over time at the P < .05 level are denoted with an asterisk. The ventilation rates decreased from March 2020 to December 2021.
Figure 3
Figure 3
Sixty-day fatality rates for hospitalized veterans by index month and age group. This graph illustrates the trend over time for veteran fatality rates by age group for the hospitalized cohort. The symbols for each age group are as follows: 18–29 – black circle, 30–39 – open square, 40–49 – black triangle, 50–64 – open circle, 65–74 - black diamond, 75 – 84 – open triangle, 85+ - star. For each age group, fatality rates are expressed as a percentage for each index month were calculated by dividing the number of hospitalized veterans who had an index date in that month by the total number of veterans who had an index date in that month then multiplying by 100. Linear trend tests for the time were performed for each age group by subsetting the data by age group and fitting a univariable modified Poisson regression with hospitalization as outcome and month as the predictor. Absolute percentage decrease in rate from March 2020 to December 2021 and P values for trend tests are shown above in parentheses. Age groups showing a significant change in fatality over time at the P < .05 level are denoted with an asterisk. The overall case-fatality rate decreased from March 2020 to December 2021.

Similar articles

Cited by

References

    1. Gao YD, Ding M, Dong X, Zhang JJ, Kursat Azkur A, Azkur D, et al. Risk factors for severe and critically ill COVID-19 patients: A review. Allergy. 2021;76(2):428–455. - PubMed
    1. Jordan RE, Adab P, Cheng KK. Covid-19: risk factors for severe disease and death. BMJ. 2020;368:m1198. - PubMed
    1. Weber J, Lee RC, Martsolf D. Understanding the health of veterans who are homeless: A review of the literature. Public Health Nurs. 2017;34(5):505–511. - PubMed
    1. Tam CC, Zeng C, Li X. Prescription opioid misuse and its correlates among veterans and military in the United States: A systematic literature review. Drug Alcohol Depend. 2020;216 - PubMed
    1. Finlay AK, Owens MD, Taylor E, Nash A, Capdarest-Arest N, Rosenthal J, et al. A scoping review of military veterans involved in the criminal justice system and their health and healthcare. Health Justice. 2019;7(1):6. - PMC - PubMed

Publication types