. 2022 Nov;29(11):2137-2150.
doi: 10.1038/s41418-022-01004-0. Epub 2022 Apr 24.

S-Nitrosylation of cathepsin B affects autophagic flux and accumulation of protein aggregates in neurodegenerative disorders

Affiliations

S-Nitrosylation of cathepsin B affects autophagic flux and accumulation of protein aggregates in neurodegenerative disorders

Ki-Ryeong Kim et al. Cell Death Differ. 2022 Nov.

Abstract

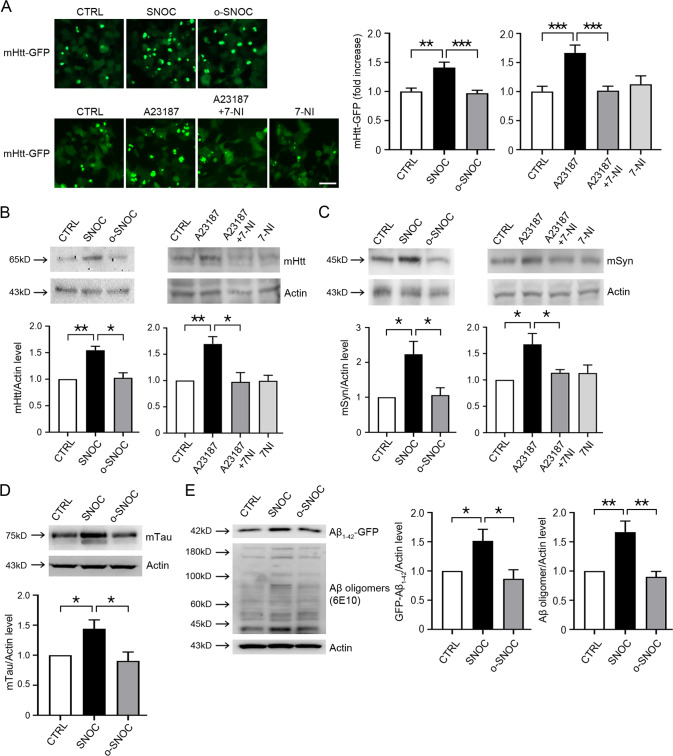
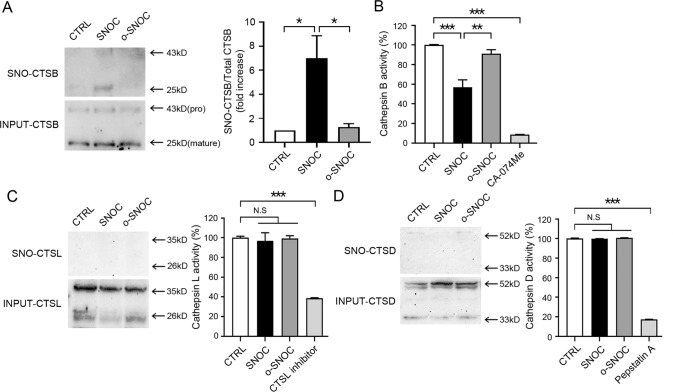
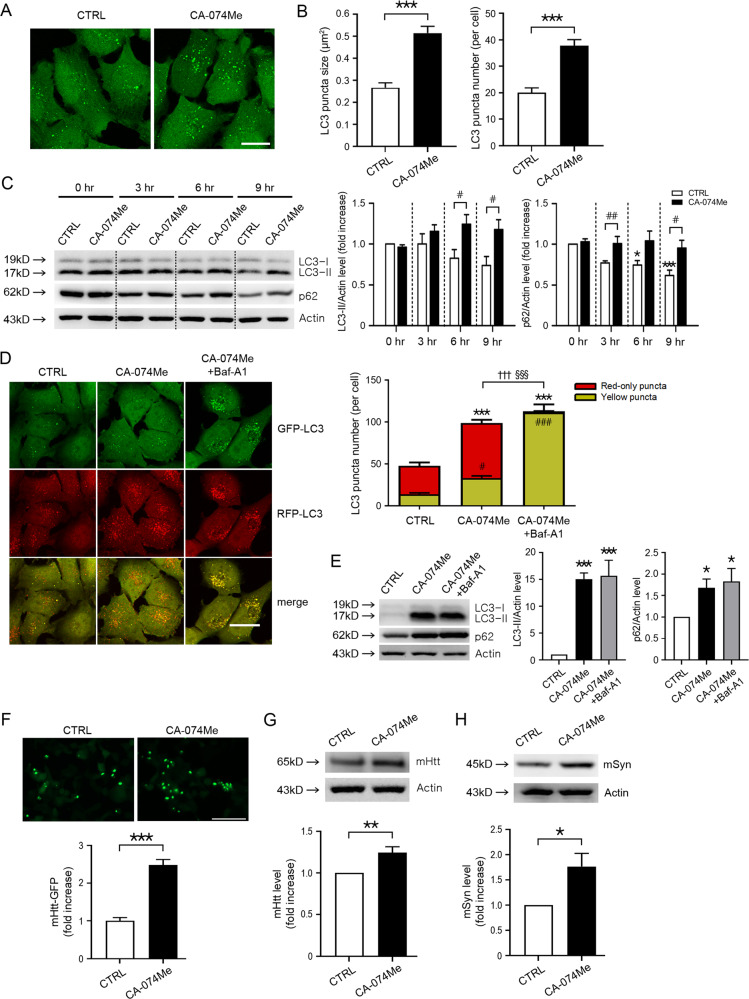
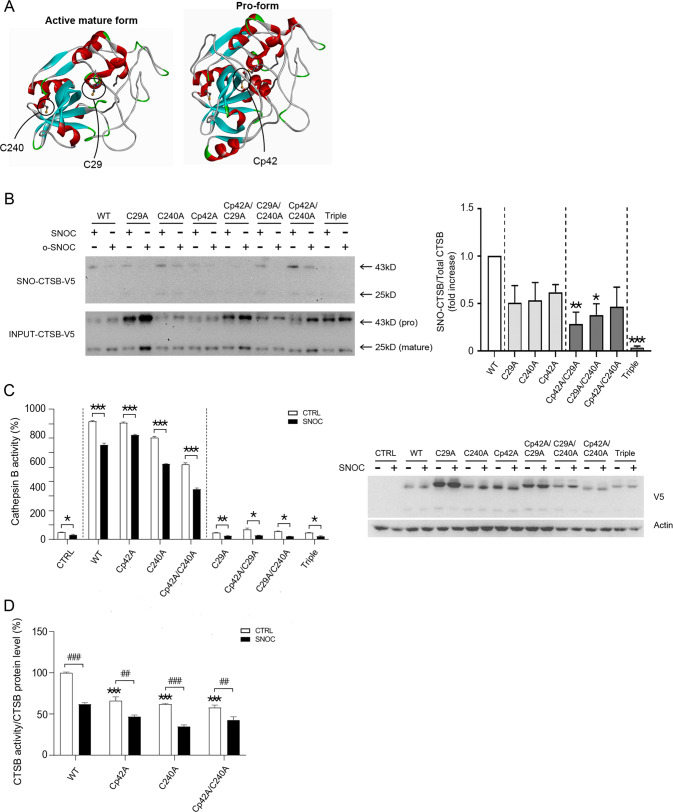
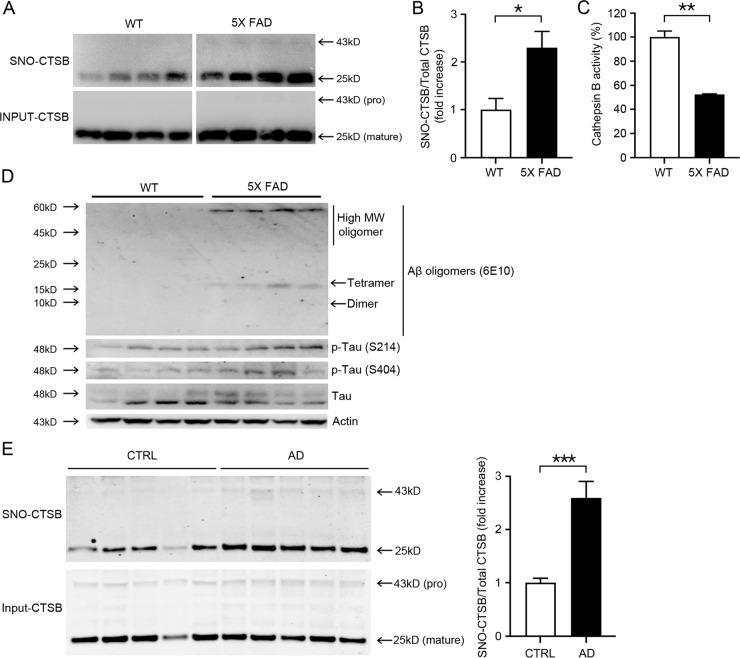
Protein S-nitrosylation is known to regulate enzymatic function. Here, we report that nitric oxide (NO)-related species can contribute to Alzheimer's disease (AD) by S-nitrosylating the lysosomal protease cathepsin B (forming SNO-CTSB), thereby inhibiting CTSB activity. This posttranslational modification inhibited autophagic flux, increased autolysosomal vesicles, and led to accumulation of protein aggregates. CA-074Me, a CTSB chemical inhibitor, also inhibited autophagic flux and resulted in accumulation of protein aggregates similar to the effect of SNO-CTSB. Inhibition of CTSB activity also induced caspase-dependent neuronal apoptosis in mouse cerebrocortical cultures. To examine which cysteine residue(s) in CTSB are S-nitrosylated, we mutated candidate cysteines and found that three cysteines were susceptible to S-nitrosylation. Finally, we observed an increase in SNO-CTSB in both 5XFAD transgenic mouse and flash-frozen postmortem human AD brains. These results suggest that S-nitrosylation of CTSB inhibits enzymatic activity, blocks autophagic flux, and thus contributes to AD pathogenesis.


Conflict of interest statement

The authors declare that YHK is a shareholder of Zincure Corp., and that KRK is currently employed by Zincure Corp. SAL is a scientific founder of Adamas Pharmaceuticals, Inc., EuMentis Therapeutics, Inc., and InflaMED Therapeutics, LLC.

Figures

Fig. 1
Fig. 1. RNS suppresses autophagic flux.
A Fluorescence confocal microscope image of GL-H4 (H4 glioma stably expressing GFP-LC3) cells 2 or 8 h after sham wash with low-serum medium (control, CTRL), or after exposure to S-nitrosocysteine (SNOC, 200 μM) or old SNOC (o-SNOC, 200 μM). Scale bar, 100 μm. B Quantitative analysis of GFP-LC3 puncta observed at 2 h or 8 h after exposure to CTRL, SNOC, or o-SNOC. Quantification of mean number (left) and size (right) of GFP-LC3 puncta per cell (mean ± SEM, n = 10 different fields taken from ≥4 independent biological replicate experiments). ***p < 0.001 by ANOVA with Bonferroni correction for multiple comparisons. C Western blot analysis for endogenous LC3 and p62 in GL-H4 cells. Protein samples were prepared at the indicated time points after exposure to sham wash (CTRL), SNOC, or o-SNOC. To activate autophagy, cultures were incubated in low-serum medium (1% FBS in MEM) for 2 h prior to SNOC exposure. For lanes 2, 3, 5, and 6, protein samples were extracted immediately after exposure to SNOC or o-SNOC. Actin was used for loading control. Quantification of conversion to LC3-II (left) and expression level of p62 (right) at the indicated time points was made in ≥3 independent biological replicate experiments. *p < 0.05, **p < 0.01, or ***p < 0.001 vs. sham wash control at baseline, and #p < 0.05, or ###p < 0.001 vs. corresponding SNOC group by ANOVA with post-hoc Dunnett’s test. D Fluorescence confocal microscope images of H4 cells stably expressing RFP-GFP-LC3 (RGL-H4 cells) 12 h after sham wash, or exposure to rapamycin (Rapa, 100 nM) or SNOC in the presence or absence of Bafilomycin A1 (Baf-A1, 100 nM). Scale bar, 20 μm. E Quantitative analysis of RFP-GFP-LC3 puncta observed 12 h after exposure to Rapa or SNOC in the presence or absence of Baf-A1. Quantification of the number of red-only or yellow puncta per cell (mean ± SEM, n = 9 different fields taken from ≥3 independent biological replicate experiments). ***p < 0.001 vs. red-only puncta of sham control, #p < 0.05, or ###p < 0.001 vs. yellow puncta of sham control, †††p < 0.001 vs. red-only puncta of Rapa or SNOC alone, and §§§p < 0.001 vs. yellow puncta of rapamycin or SNOC alone by ANOVA with post-hoc Dunnett’s test. F Western blot analysis for endogenous LC3 and p62 in RGL-H4 cells. Protein samples were prepared 12 h after the induction of autophagy triggered by incubation in low-serum medium. Quantification of conversion to LC3-II (left) and expression levels of p62 (right) from ≥3 independent biological replicate experiments. *p < 0.05, **p < 0.01 or ***p < 0.001 vs. sham wash control, and #p < 0.05, or ##p < 0.01 vs. Rapa or SNOC alone. NS: not significant by ANOVA with post-hoc Dunnett’s test.
Fig. 2
Fig. 2. RNS augment protein aggregates.
A Fluorescence microscope image of GFP-mHtt aggregates in nNOS-HEK cells. GFP-mHtt plasmid was transiently transfected into nNOS-HEK cells two days before drug treatment. Cells were evaluated 2 h after exposure to 200 μM SNOC or o-SNOC, or 7 h after addition of 10 μM A23187 alone or A23187 plus 10 μM 7-Nitroindazole (7-NI). Scale bar, 50 μm. Bar graphs represent quantitative analysis of GFP-mHtt fluorescence intensity. The mean intensity of GFP-mHtt fluorescence was quantified in a given microscopic field using Image J software (mean ± SEM, n = 8 different fields taken from ≥3 independent biological replicate experiments). **p < 0.01 or ***p < 0.001 by ANOVA with Dunnett’s test for post-hoc analysis. B Western blot analysis for accumulation of mHtt. GFP-mHtt plasmid was transiently transfected into nNOS-HEK cells two days before drug treatment. Protein samples were prepared 2 h after sham wash (CTRL) or exposure to SNOC or o-SNOC, or 7 h after exposure to A23187 alone or A23187 plus 7-NI. Quantification of the GFP-mHtt level from ≥3 independent biological replicate experiments. *p < 0.05 or **p < 0.01 by ANOVA with Dunnett’s test for post-hoc analysis. C Western blot analysis for accumulation of mutant α-synuclein (mSyn). A plasmid encoding mt-α-synuclein was transiently transfected into nNOS-HEK cells two days before drug treatment. Protein samples were prepared 2 h after sham wash (CTRL) or exposure to SNOC or o-SNOC, or 7 h after exposure to A23187 alone or A23187 plus 7-NI. Quantification of α-Syn level from ≥3 independent biological replicate experiments. *p < 0.05 by ANOVA with Dunnett’s test for post-hoc analysis. D Western blot analysis of accumulation of mutant tau(P301L). Tau P301L-GFP plasmid was transiently transfected into HEK cells one day prior to exposure to SNOC. Protein samples were prepared 2 h after sham wash (CTRL), or exposure to 200 μM SNOC or o-SNOC. Quantification of tau P301L-GFP from ≥3 biological replicate experiments, *p < 0.05 by ANOVA with Dunnett’s test for post-hoc analysis. E Western blot analysis for an accumulation of Aβ1-42. Aβ1-42-GFP plasmid was transiently transfected into HEK cells two days prior to SNOC exposure. Protein samples were prepared 2 h after sham wash (CTRL), or exposure to SNOC or o-SNOC. Quantification of Aβ1-42-GFP or Aβ1-42 oligomers (6E10) from ≥ 3 biological replicate experiments, *p < 0.05 or **p < 0.01 by ANOVA with Dunnett’s test for post-hoc analysis. Oligomers were quantified by densitometry of multiple bands.
Fig. 3
Fig. 3. SNOC regulates cathepsin B activity by S-nitrosylation.
A Biotin-switch assay for detection of S-nitrosylated cathepsin B (SNO-CTSB) in HEK293 cells. Protein samples were prepared 45 min after sham wash control (CTRL) or exposure to 200 μM SNOC or o-SNOC. The upper bands (43 kD) represent the pro-form of CTSB, and the lower bands (25 kD), the mature form of CTSB. The ratio of SNO-CTSB (mature form) to total input CTSB was quantified as a fold increase in ≥3 independent biological replicate experiments *p < 0.05 by ANOVA with Dunnett’s test for post-hoc analysis. B Enzyme activity assay of CTSB in HEK cells. Protein samples were prepared 45 min after sham wash control or exposure to SNOC or o-SNOC (n = 3, *p < 0.05, **p < 0.01 or ***p < 0.001 by ANOVA with Dunnett’s test for post-hoc analysis. The specific inhibitor of CTSB, CA-074Me, was used as a control. C Biotin-switch assay for detection of S-nitrosylated cathepsin L (SNO-CTSL) (left) and enzyme activity assay of CTSL (right) in HEK cells. Protein samples were prepared 45 min after sham wash control (CTRL) or exposure to SNOC or o-SNOC (n = 3, ***p < 0.001 compared to sham wash control by ANOVA with Dunnett’s test for post-hoc analysis). Specific inhibitors for CTSL were used as controls. D Biotin-switch assay for detection of S-nitrosylated cathepsin D (SNO-CTSD) (left) and enzyme activity assay of CTSD (right) in HEK cells. Protein samples were prepared 45 min after sham wash control (CTRL) or exposure to SNOC or o-SNOC (n = 3, ***p < 0.001 by ANOVA with Dunnett’s test for post-hoc analysis). Specific inhibitor for CTSD (pepstatin A) was used as control.
Fig. 4
Fig. 4. The CTSB inhibitor, CA-074Me, inhibits autophagic flux mimicking the effect of RNS.
A Fluorescence confocal microscope image of GL-H4 cells 12 h after sham wash (CTRL) or exposure to 20 μM CA-074Me. Scale bar, 20 μm. B Quantitative analysis of GFP-LC3 puncta observed 12 h after CA-074Me treatment. Mean size (left) and number (right) of GFP-LC3 puncta per cell in a given microscopic field were quantified (mean ± SEM, n = 7 different fields taken from ≥4 independent biological replicate experiments). ***p < 0.001 by two-tailed Student’s t-test. C Western blot analysis of LC3, and p62 in GL-H4 cells. Protein samples were prepared at the indicated time points after sham wash (CTRL) or exposure to 20 μM CA-074Me. Quantification of LC3-II (left) and p62 (right) at the indicated time points in ≥ 3 independent biological replicate experiments. *p < 0.05 or ***p < 0.001 vs. 0 h sham wash control, and #p < 0.05 or ##p < 0.01 vs. sham wash control of the same time point by ANOVA with post-hoc Dunnett’s test. D Fluorescence confocal microscope image of RGL-H4 cells. CA-074Me exposure for 12 h. scale bar, 20 μm. Quantification of mean number of red-only or yellow puncta per cell in a given microscopic field (mean ± SEM, n = 9 different fields taken from ≥3 independent biological replicate experiments). ***p < 0.001 vs. red-only puncta of control, #p < 0.05 or ###p < 0.001 vs. yellow puncta of control, †††p < 0.001 vs. red-only puncta of CA-074Me, and §§§p < 0.001 vs. yellow puncta of CA-074Me by ANOVA with post-hoc Dunnett’s test. E Western blot analysis for endogenous LC3 and p62 in RGL-H4 cells. Protein samples were prepared 12 h after exposure to sham wash or CA-074Me in the presence or absence of Bafilomycin A1 (Baf-A1). Quantification of conversion to LC3-II (left) and expression level of p62 (right) at 12 h was made in ≥3 independent biological replicate experiments. *p < 0.05, or ***p < 0.001 vs. sham wash control by ANOVA with Dunnett’s test for post-hoc analysis. F Fluorescence microscope image of GFP-mHtt aggregates in nNOS-HEK cells. nNOS-HEK cells transiently transfected with GFP-mHtt plasmid were exposed to 20 μM CA-074Me for 12 h. Scale bar, 200 μm. Mean intensity of GFP-mHtt in a given microscopic field was quantified using Image J software (mean ± SEM, n = 8 different photographic images in at least three independent experiments). ***p < 0.001 by two-tailed Student’s t-test. G, H Western blot analysis of accumulation of mHtt (G) and mt-α-synuclein (H). GFP-mHtt or mt-α-synuclein plasmid was transiently transfected into nNOS-HEK cells two days prior to drug treatment. Protein samples were prepared 12 h after sham wash (CTRL) or exposure to CA-074Me. Quantification of GFP-mHtt and mt-α-synuclein levels in ≥3 independent biological replicate experiments. *p < 0.05 or **P < 0.01 by two-tailed Student’s t-test.
Fig. 5
Fig. 5. CTSB inhibition induces neuronal cell apoptosis in mouse cerebrocortical cultures.
A Microscopic images of propidium iodide (PI)-positive dead cells (upper) and Hoechst 33258-stained total nuclei (lower) in mouse cerebrocortical cultures 18 h after the addition of 20 µM CA-074Me in the presence or absence of 100 µM Trolox, 1 µg/ml cycloheximide (CHX), or 100 µM zVAD. CA-074Me markedly increased PI-positive dead cells and Hoechst stain revealed their condensed nuclei. Arrowheads indicate typical morphology of small, bright nuclei of apoptotic cells. The scale bar of PI images is 100 μm, and Hoechst 33258 is 25 μm. B Quantification of PI-positive dead cells (left), Hoechst 33258-stained condensed apoptotic nuclei (middle), and LDH release (right) 18 h after the addition of CA-074Me in the presence or absence of Trolox, cycloheximide, or zVAD to mouse cerebrocortical cultures (mean ± SEM, n = 3 cultures), *p < 0.05, **p < 0.01, or ***p < 0.001 by ANOVA with post-hoc Dunnett’s test. CHX and zVAD decreased nuclear pyknosis induced by CA-074Me, whereas Trolox did not affect CA-074Me-induced apoptotic neuronal cell death. C Western blot analysis for cleaved/active caspase-3 in mouse cerebrocortical cultures. Protein samples were prepared 18 h after sham wash (CTRL) or exposure to 20 μM CA-074Me in the presence or absence of Trolox, CHX, or zVAD. CA-074Me induced caspase-3 activation, which was markedly attenuated by CHX or zVAD, but not by Trolox. D Quantification of LDH release resulting from neuronal cell death 9 h after exposure to SNOC (mean ± SEM, n = 3 cultures), ***p < 0.001 by two-tailed Student’s t-test.
Fig. 6
Fig. 6. S-Nitrosylated cysteine residues of CTSB.
A Crystal structures of the active-mature form (top; PDBID: 1HUC) and pro-form (bottom; PDBID: 1PBH) of CTSB. The side chains of the three free cysteine residues (C29, C240, and Cp42) that do not form structural disulfide bonds are circled. B Biotin-switch assay of CTSB mutants in HEK cells. Seven different CTSB cysteine mutants were transiently transfected into HEK cells two days prior to sham wash or exposure to SNOC; 45 min later, cells were lysed for analysis via biotin-switch assay. The ratio of SNO-CTSB to total input CTSB, including both pro- and mature forms, was quantified as fold increase in ≥3 independent biological replicate experiments. *p < 0.05, **p < 0.01, or ***p < 0.001 by ANOVA with post-hoc Dunnett’s test. C CTSB enzymatic activity (left graphs) and expression levels (right western blot) of CTSB mutants in HEK cells. Seven different cysteine mutants were transiently transfected into HEK cells two days prior to exposure to 200 µM SNOC; 45 min later protein samples were prepared for CTSB enzymatic assay (n = 3 independent biological replicate experiments, *p < 0.05, **p < 0.01, or ***p < 0.001 compared to sham wash control). V5 antibody was used to monitor exogenous CTSB expression levels. D Normalization of enzymatic activity of non-catalytic CTSB Cys mutants to their expression levels. ***p < 0.001 compared to sham wash control of WT, and ##p < 0.01 or ###p < 0.001 vs. sham wash control of the corresponding mutant by ANOVA with post-hoc Dunnett’s test.
Fig. 7
Fig. 7. S-Nitrosylation and enzymatic inhibition of CTSB in 5X FAD mouse and human AD brains.
A Biotin-switch assay for CTSB in mouse brains. Protein samples were prepared from the cerebrocortices of wild-type (WT) and 5XFAD littermate mice. B Bars depict fold increase in relative S-nitrosylated CTSB in 5XFAD mice brains vs. WT (≥3 biological replicates, *p < 0.05 by Student’s t-test). Both the pro- and mature forms of CTSB were used for quantification. C CTSB enzymatic activity in WT and 5XFAD mouse brains. Protein samples were prepared from the cerebrocortices of WT and 5XFAD mice (n = 4 biological replicates, **p < 0.01 compared to WT mice (CTRL) by Student’s t-test). D Western blot analysis of Aβ oligomers, p-tau (S214, or S404), and tau in WT and 5XFAD mouse brains. Protein samples were prepared from cerebrocortices of WT and 5XFAD littermate mice. E Biotin-switch assay for CTSB was performed on human and control postmortem brains. Graph depicts fold increase in relative SNO-CTSB in human AD brain compared to Controls (n = 5 brains each for AD and Controls tested in ≥3 biological replicate experiments, ***p < 0.001 by two-tailed Student’s t-test). Both the pro- and mature forms of CTSB were used for quantification.

References

    1. de Vrij FM, Fischer DF, van Leeuwen FW, Hol EM. Protein quality control in Alzheimer’s disease by the ubiquitin proteasome system. Prog Neurobiol. 2004;74:249–70.. doi: 10.1016/j.pneurobio.2004.10.001. - DOI - PubMed
    1. Rubinsztein DC. The roles of intracellular protein-degradation pathways in neurodegeneration. Nature. 2006;443:780–6. doi: 10.1038/nature05291. - DOI - PubMed
    1. Upadhya SC, Hegde AN. Ubiquitin-proteasome pathway components as therapeutic targets for CNS maladies. Curr Pharm Des. 2005;11:3807–28.. doi: 10.2174/138161205774580651. - DOI - PubMed
    1. Barmada SJ, Serio A, Arjun A, Bilican B, Daub A, Ando DM, et al. Autophagy induction enhances TDP43 turnover and survival in neuronal ALS models. Nat Chem Biol. 2014;10:677–85. doi: 10.1038/nchembio.1563. - DOI - PMC - PubMed
    1. Lee JH, Yu WH, Kumar A, Lee S, Mohan PS, Peterhoff CM, et al. Lysosomal proteolysis and autophagy require presenilin 1 and are disrupted by Alzheimer-related PS1 mutations. Cell. 2010;141:1146–58. doi: 10.1016/j.cell.2010.05.008. - DOI - PMC - PubMed

Publication types