. 2022 Apr 6:13:869200.
doi: 10.3389/fphar.2022.869200. eCollection 2022.

IBD Subtype-Regulators IFNG and GBP5 Identified by Causal Inference Drive More Intense Innate Immunity and Inflammatory Responses in CD Than Those in UC

Affiliations

IBD Subtype-Regulators IFNG and GBP5 Identified by Causal Inference Drive More Intense Innate Immunity and Inflammatory Responses in CD Than Those in UC

Sheng Gao et al. Front Pharmacol. .

Abstract

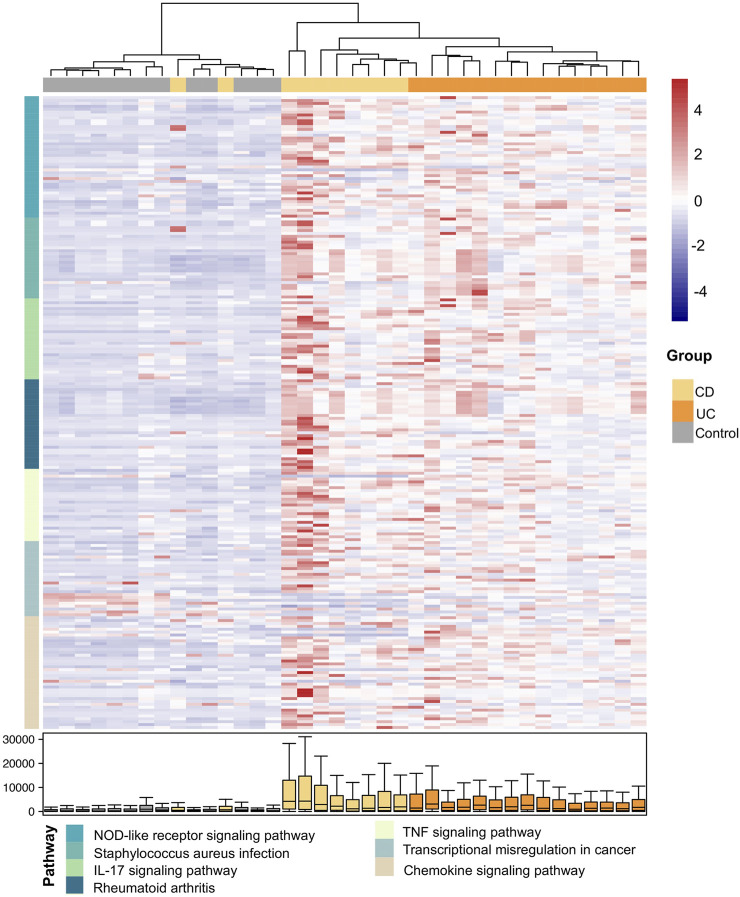
Background: The pathological differences between Crohn's disease (CD) and ulcerative colitis (UC) are substantial and unexplained yet. Here, we aimed to identify potential regulators that drive different pathogenesis of CD and UC by causal inference analysis of transcriptome data. Methods: Kruskal-Wallis and Dunnett's tests were performed to identify differentially expressed genes (DEGs) among CD patients, UC patients, and controls. Subsequently, differentially expressed pathways (DEPs) between CD and UC were identified and used to construct the interaction network of DEPs. Causal inference was performed to identify IBD subtype-regulators. The expression of the subtype-regulators and their downstream genes was validated by qRT-PCR with an independent cohort. Results: Compared with the control group, we identified 1,352 and 2,081 DEGs in CD and UC groups, respectively. Multiple DEPs between CD and UC were closely related to inflammation-related pathways, such as NOD-like receptor signaling, IL-17 signaling, and chemokine signaling pathways. Based on the priori interaction network of DEPs, causal inference analysis identified IFNG and GBP5 as IBD subtype-regulators. The results with the discovery cohort showed that the expression level of IFNG, GBP5, and NLRP3 was significantly higher in the CD group than that in the UC group. The regulation relationships among IFNG, GBP5, and NLRP3 were confirmed with transcriptome data from an independent cohort and validated by qRT-PCR. Conclusion: Our study suggests that IFNG and GBP5 were IBD subtype-regulators that trigger more intense innate immunity and inflammatory responses in CD than those in UC. Our findings reveal pathomechanical differences between CD and UC that may contribute to personalized treatment for CD and UC.

Keywords: Crohn’s disease; IBD subtype-regulator; causal inference; inflammatory bowel disease; ulcerative colitis.


Conflict of interest statement

Author RxZ serves as an advisory board member for Research Institute, GloriousMed Clinical Laboratory, GloriousMed Technology Co., Ltd., China. The remaining authors declare that the research was conducted in the absence of any commercial or financial relationships that could be construed as a potential conflict of interest.

Figures

FIGURE 1
FIGURE 1
Overall workflow of this study. First, DEGs between IBD and control groups were identified. Next, the combination of enriched pathways was compared between CD and UC by QPA to determine DEPs. Subsequently, DEPs were merged into a priori network, which was used to identify the subtype-regulators using causal inference. Finally, validation was performed by qRT-PCR with an independent cohort.
FIGURE 2
FIGURE 2
Gene expression of IBD feature genes and housekeeping genes. The expression of housekeeping genes (A) and feature genes of IBD (B) was compared among the study groups. Yellow, CD; orange, UC; gray, control. Data are presented as mean ± standard error. *: p < 0.05, **: p < 0.01, ***: p < 0.001, Dunnett’s test.
FIGURE 3
FIGURE 3
Global transcriptional changes of gene profiles and KEGG pathway enrichment in IBD. Volcano plots show the differentially expressed genes between CD (A), UC (C), and control groups (|log2Fold Change| >1 and adjusted p < 0.05). Dot plots show the pathways significantly enriched with DEGs between CD (B), UC (D), and control groups (adjusted p < 1.0e-3). N = 10, 15, and 13 for the CD, the UC, and the control groups, respectively. In the dot plots, signaling molecules interaction and immunity- and bacterial infection-related pathways are marked by blue, orange, and yellow, respectively. Irrelevant enriched pathways are marked by gray.
FIGURE 4
FIGURE 4
Expression heatmap of the DEGs in the DEPs between CD and UC. The samples and the DEGs are presented in columns and rows, respectively. The color of the DEGs in rows indicates different DEPs as specified in the following (pathway). The color bar on the right side indicates the scaled expressions of these genes in each sample. The distribution of the expressions for each DEG is shown by boxplot at the bottom.
FIGURE 5
FIGURE 5
Subnetwork of the DEPs KEGG network with IFNG, GBP5, and NLRP3. Orange, blue, yellow, and gray represent subtype-regulators, causal DEGs, non-causal DEGs, and other genes, respectively, in DEPs. DEGs refer to differentially expressed genes between IBD and control groups. Subtype-regulators are DEGs with p < 0.05 in the causal effect significance test (see Method for detail) and showed statistical differences between CD and UC; causal DEGs represent DEGs with p < 0.05 in the causal effect significance test; non-causal DEGs represent DEGs with p > 0.05 in the causal effect significance test.
FIGURE 6
FIGURE 6
Gene expression of IFNG, GBP5, and NLRP3 in healthy controls, CD, and UC patients according to transcriptome analysis. The expression of (A) IFNG, (B) GBP5, and (C) NLRP3 genes in the control, CD, and UC groups. Yellow, CD; orange, UC; gray, control. All data are presented as mean ± standard error. *: p < 0.05; **: p < 0.01; ***: p < 0.001. N = 10, 15, and 13 for the CD, the UC, and the control groups, respectively. (D) Linear regression between IFNG and GBP5 based on log2-scaled expression values (Spearman; R = 0.72, p = 3.6e-07). (E) Linear regression between GBP5 and NLRP3 based on log2-scaled expression values (Spearman; R = 0.51, p = 0.001). (F) Linear regression between IFNG and NLRP3 based on log2-scaled expression values (Spearman; R = 0.56, p = 0.00033).
FIGURE 7
FIGURE 7
Gene expression of IFNG, GBP5, and NLRP3 in an independent cohort of healthy controls, CD, and UC patients as determined by qRT-PCR. The gene expressions of (A) IFNG, (B) GBP5, and (C) NLRP3 in the control, the CD, and the UC patients. Data are presented as mean ± standard error. *p < 0.05, **p < 0.01, and ***p < 0.001. N = 36, 13, and 33 for the CD, the UC, and the control groups, respectively. (D) Linear regression between IFNG and GBP5 based on log2-scaled expression values (Spearman, R = 0.88, p < 2.2e-16). (E) Linear regression between GBP5 and NLRP3 based on log2-scaled expression values (Spearman, R = 0.77, p < 2.2e-16). (F) Linear regression between IFNG and NLRP3 based on log2-scaled expression values (Spearman, R = 0.66, P = 1e-11).

References

    1. Atreya R., Neurath M. F. (2005). Involvement of IL-6 in the Pathogenesis of Inflammatory Bowel Disease and colon Cancer. Clin. Rev. Allergy Immunol. 28 (3), 187–196. 10.1385/CRIAI:28:3:187 - DOI - PubMed
    1. Banks C., Bateman A., Payne R., Johnson P., Sheron N. (2003). Chemokine Expression in IBD. Mucosal Chemokine Expression Is Unselectively Increased in Both Ulcerative Colitis and Crohn's Disease. J. Pathol. 199 (1), 28–35. 10.1002/path.1245 - DOI - PubMed
    1. Bergantz L., Subra F., Deprez E., Delelis O., Richetta C. (2019). Interplay between Intrinsic and Innate Immunity during HIV Infection. Cells 8 (8). 10.3390/cells8080922 - DOI - PMC - PubMed
    1. Bernstein C. N., Eliakim A., Fedail S., Fried M., Gearry R., Goh K. L., et al. (2016). World Gastroenterology Organisation Global Guidelines Inflammatory Bowel Disease: Update August 2015. J. Clin. Gastroenterol. 50 (10), 803–818. 10.1097/MCG.0000000000000660 - DOI - PubMed
    1. Britzen-Laurent N., Herrmann C., Naschberger E., Croner R. S., Stürzl M. (2016). Pathophysiological Role of Guanylate-Binding Proteins in Gastrointestinal Diseases. World J. Gastroenterol. 22 (28), 6434–6443. 10.3748/wjg.v22.i28.6434 - DOI - PMC - PubMed

LinkOut - more resources