. 2022 Apr 6:13:842730.
doi: 10.3389/fphar.2022.842730. eCollection 2022.

N-Acetyldopamine Dimer Attenuates DSS-Induced Ulcerative Colitis by Suppressing NF-κB and MAPK Pathways

Affiliations

N-Acetyldopamine Dimer Attenuates DSS-Induced Ulcerative Colitis by Suppressing NF-κB and MAPK Pathways

Li-Jun Huang et al. Front Pharmacol. .

Abstract

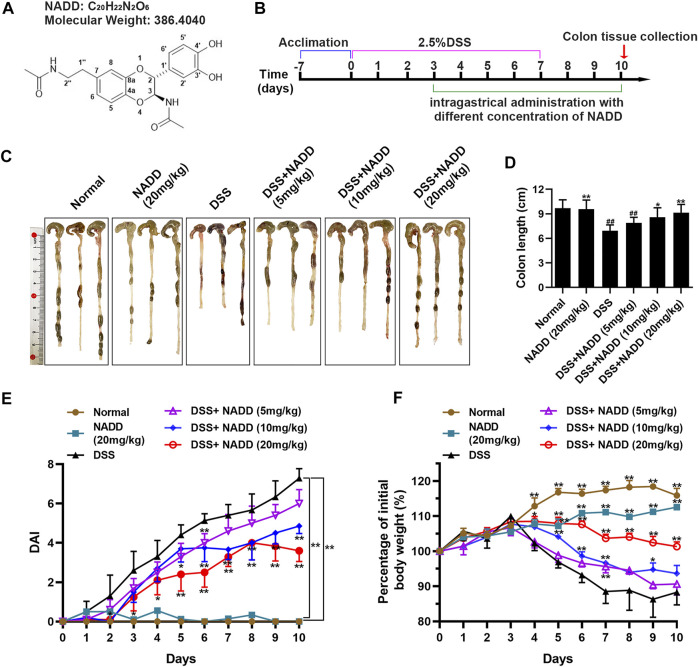
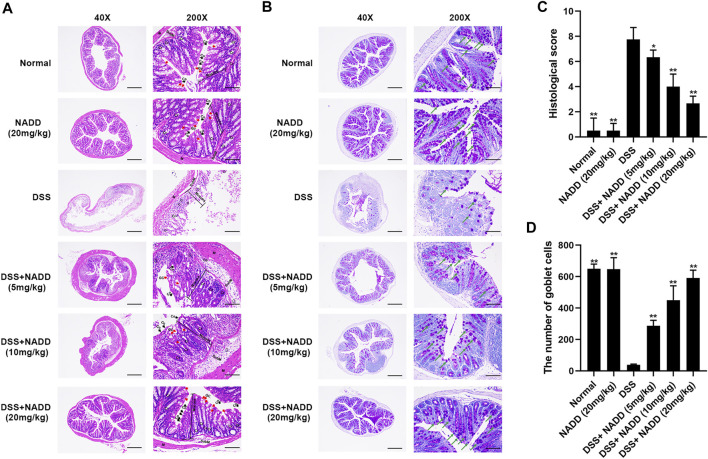
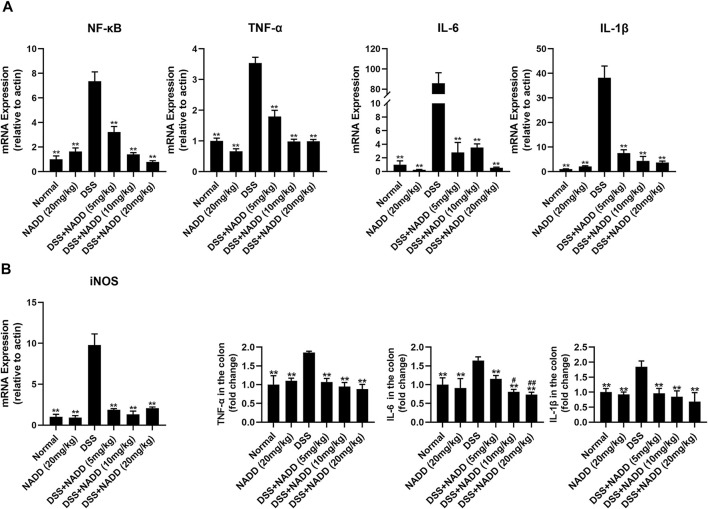
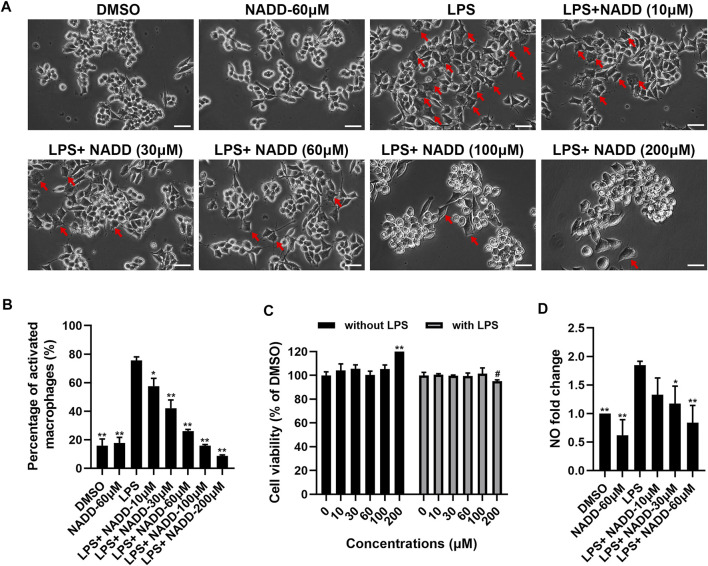
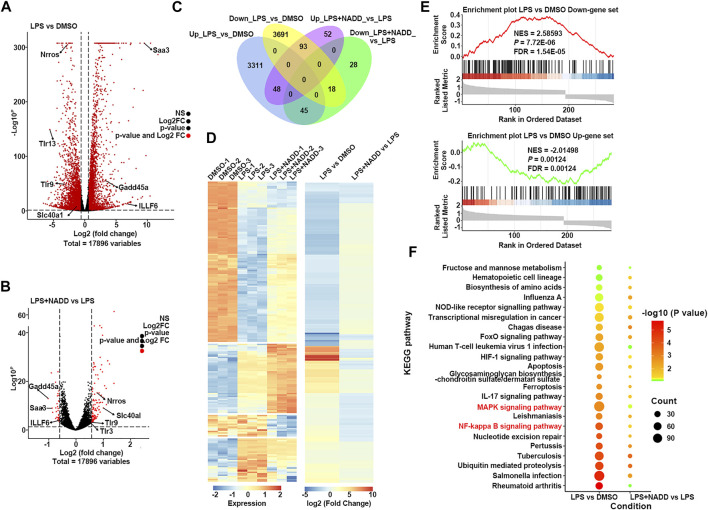
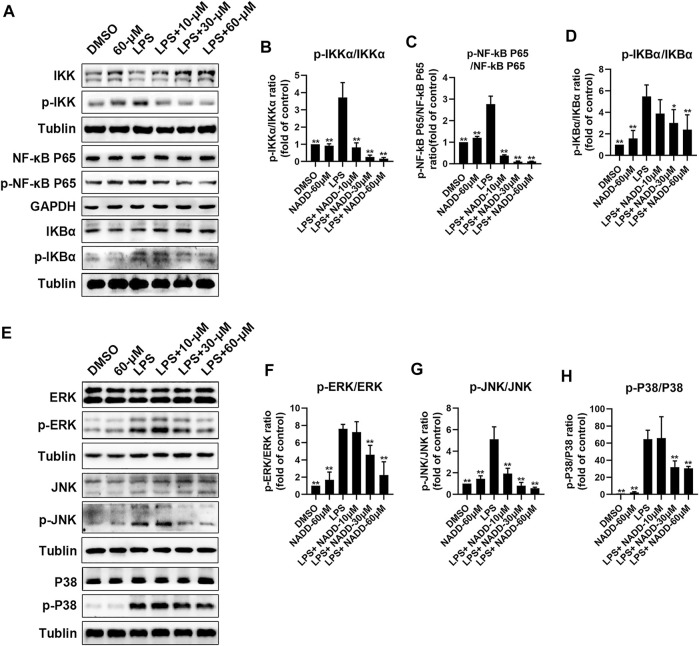
Ulcerative Colitis (UC) is a major form of chronic inflammatory bowel disease of the colonic mucosa and exhibits progressive morbidity. There is still a substantial need of small molecules with greater efficacy and safety for UC treatment. Here, we report a N-acetyldopamine dimer (NADD) elucidated (2R,3S)-2-(3',4'-dihydroxyphenyl)-3-acetylamino-7-(N-acetyl-2″-aminoethyl)-1,4-benzodioxane, which is derived from traditional Chinese medicine Isaria cicadae, exhibits significant therapeutic efficacy against dextran sulfate sodium (DSS)-induced UC. Functionally, NADD treatment effectively relieves UC symptoms, including weight loss, colon length shortening, colonic tissue damage and expression of pro-inflammatory factors in pre-clinical models. Mechanistically, NADD treatment significantly inhibits the expression of genes in inflammation related NF-κB and MAPK signaling pathways by transcriptome analysis and western blot, which indicates that NADD inhibits the inflammation in UC might through these two pathways. Overall, this study identifies an effective small molecule for UC therapy.

Keywords: MAPK pathway; N-acetyldopamine dimer; NF-κB pathway; inflammation; ulcerative colitis.


Conflict of interest statement

The authors declare that the research was conducted in the absence of any commercial or financial relationships that could be construed as a potential conflict of interest.

Figures

FIGURE 1
FIGURE 1
The therapeutic effect of NADD on UC. (A) Molecular structures of NADD (B) Experiment flow diagram. (C) Images of murine colons among different groups of mice (D) Histogram of colon length after treatment with different concentrations of NADD. (E) DAI of mice among different treatment groups. (F) Body weight changes of mice among different treatment groups. Differences were statistically significant when compared with mice in the DSS group (* p < 0.05, ** p < 0.01).
FIGURE 2
FIGURE 2
HE and PAS staining. (A) Representative images of HE staining sections of colon; GC, goblet cells (red arrows); Cr, Crypts; Co, Columnar colonocytes (black arrows); SubM: Submucosa; Cells in the circle are Neutrophils. (B) Representative images of PAS staining; Amaranth granules are mucin glycoproteins (green arrows). (C) Histological scores of colon tissues with or without DSS induction and with or without administration of NADD. (D) The number of goblet cells of colon tissues with or without DSS induction and with or without administration of NADD. Differences were statistically significant when compared with the DSS group mice (* p < 0.05, ** p < 0.01).
FIGURE 3
FIGURE 3
Gene expressions and protein levels of proinflammatory factors. (A) mRNA expression levels of NF-κB, TNF-α, IL-6, IL-1β, and iNOS in colon tissues from mice in different treatment groups. (B) ELISA results of proinflammatory factor levels, including TNF-α, IL-6, IL-1β, in colon tissues from mice in different treatment groups. Differences were statistically significant when compared with the DSS group mice ( * p < 0.05, ** p < 0.01), and compared with the mice treated with DSS + NADD (5 mg/kg) ( # p < 0.01, ## p < 0.01).
FIGURE 4
FIGURE 4
The effect of NADD on LPS-induced inflammation in vitro. (A) The morphology of RAW264.7 macrophages treated with DMSO, NADD-60 μM, LPS, LPS + NADD-10 μM, LPS + NADD-30 μM, LPS + NADD-60 μM, LPS + NADD-100 μM, and LPS + NADD-200 μM. Red arrows indicate activated macrophages; white bar = 100 μm. (B) The statistical analysis of morphologic changes of RAW264.7 macrophages treated with DMSO, NADD-60 μM, LPS, LPS + NADD-10 μM, LPS + NADD-30 μM, LPS + NADD-60 μM, LPS + NADD-100 μM, and LPS + NADD-200 μM. Differences were statistically significant when compared with the LPS group ( * p < 0.05, ** p < 0.01). (C) Cell viability by CCK8; without LPS: RAW264.7 macrophages were not stimulated by LPS; with LPS: RAW264.7 macrophages were stimulated with LPS after cells were pre-treated with different concentrations of NADD. Differences were statistically significant when compared with the 0 μM group ( ** p < 0.01, without LPS; # p < 0.05, with LPS). (D) NO in culture supernatant from different groups of cells. Differences were statistically significant when compared with the LPS group ( * p < 0.05, ** p < 0.01).
FIGURE 5
FIGURE 5
The result of RNA-seq. (A) The volcano plot of DEGs between LPS and DMSO treated RAW264.7 macrophages; The red dots show significantly DEGs. (B) Volcano plot of DEGs between LPS + NADD LPS treated RAW264.7 macrophages; the red dots show significantly DEGs (C) Venn diagrams of overlapping genes with LPS only treatment and LPS + NADD treated RAW264.7 macrophages. (D) Heatmap of 204 common DEGs in LPS and LPS + NADD treated RAW264.7 macrophages. (E) GSEA analysis result of DEGs. (F) KEGG enrichment analysis of DEGs. The DEGs were defined by |foldchange| > 2 and p < 0.05.
FIGURE 6
FIGURE 6
Protein levels of NF-kB and MAPK pathway factors after LPS and NADD treatments. (A) Expression of IKK, p-IKK (LPS stimulated 30 min), NF-kB p65, p-NF-kB p65 (LPS stimulated 60 min), IKBα and p-IKBα (LPS stimulated 60 min) in the NF-kB pathway. Tubulin were internal reference proteins. Bar charts showing expression of p-IKK/IKK (B), p-NF-kB p65/NF-kB p65 (C) and p-IKBα/ IKBα (D). (E) expressions of ERK, p-ERK (LPS stimulated 15 min), JNK, p-JNK (LPS stimulated 30 min), P38 and p-P38 (LPS stimulated 30 min) in the MAPK pathway; Tubulin was the internal reference protein; Bar charts showing expression of p-ERK/ERK (F), p-JNK/JNK (G) and p-IKBα/IKBα (H). Differences were statistically significant when compared with the LPS treated cells (* p < 0.05, ** p < 0.01).

References

    1. Anders S., Pyl P. T., Huber W. (2015). HTSeq--a Python Framework to Work with High-Throughput Sequencing Data. Bioinformatics 31 (2), 166–169. 10.1093/bioinformatics/btu638 - DOI - PMC - PubMed
    1. Atreya I., Atreya R., Neurath M. F. (2008). NF-kappaB in Inflammatory Bowel Disease. J. Intern. Med. 263 (6), 591–596. 10.1111/j.1365-2796.2008.01953.x - DOI - PubMed
    1. Bonini M. G., Malik A. B. (2014). Regulating the Regulator of ROS Production. Cell Res. 24 (8), 908–909. 10.1038/cr.2014.66 - DOI - PMC - PubMed
    1. Cao H., Liu J., Shen P., Cai J., Han Y., Zhu K., et al. (2018). Protective Effect of Naringin on DSS-Induced Ulcerative Colitis in Mice. J. Agric. Food Chem. 66 (50), 13133–13140. 10.1021/acs.jafc.8b03942 - DOI - PubMed
    1. Chang L., Karin M. (2001). Mammalian MAP Kinase Signalling Cascades. Nature 410, 37–40. 10.1038/35065000 - DOI - PubMed

LinkOut - more resources