

A holistic approach to the air quality of Konya City, Turkey
- PMID: 35463200
- PMCID: PMC9016379
- DOI: 10.1007/s11869-022-01200-4
A holistic approach to the air quality of Konya City, Turkey
Abstract
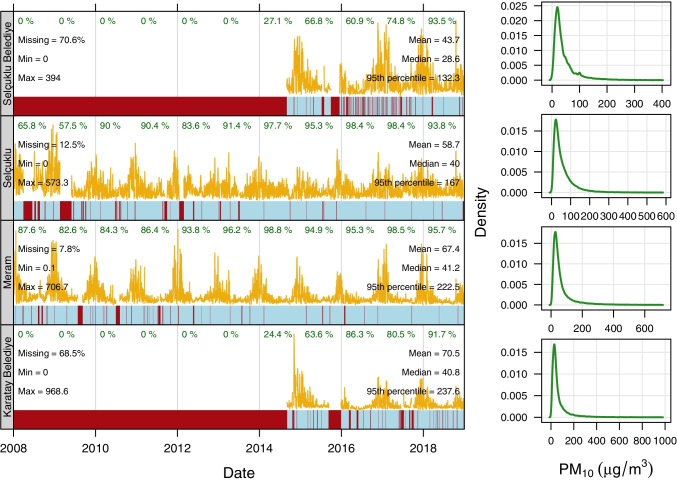
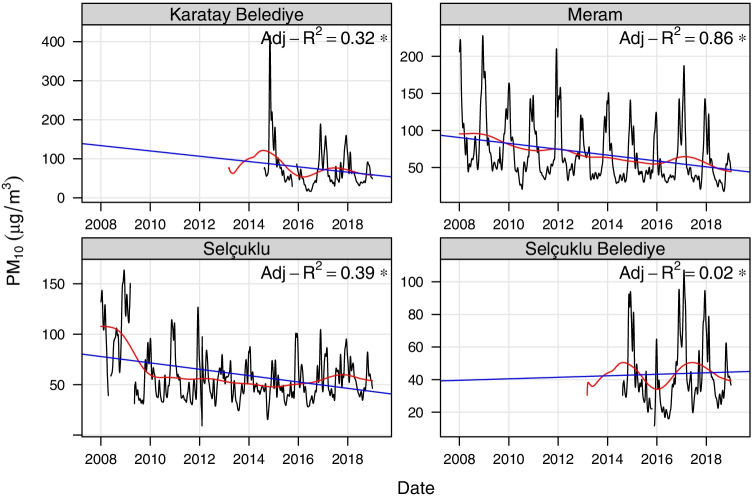
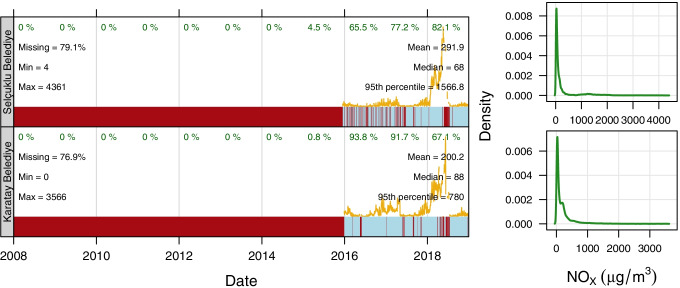
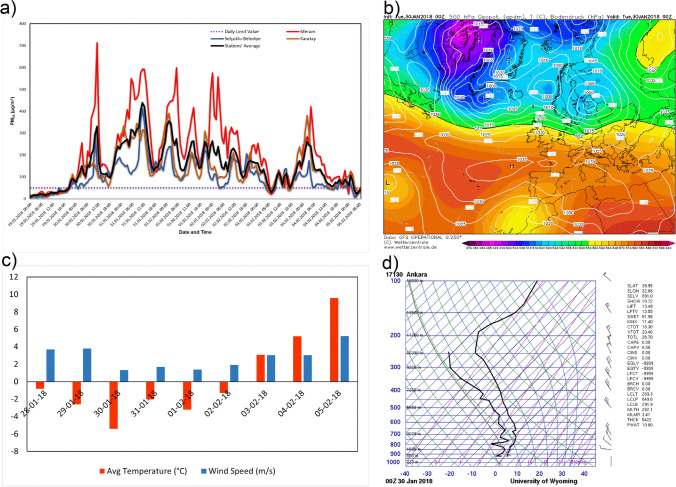
Considering an integrated approach to assess all of the measured pollutants in a diurnal, monthly, seasonal, and annual time scales and understanding the mechanisms hidden under low air quality conditions are essential for tackling potential air pollution issues. Konya, located in central Anatolia, is the largest province of Turkey with a surface area of 40,838 km2 and has different industrial activities. The lack of recent detailed studies limits our information on the underlying air pollution levels in Konya and obscuring policymakers to develop applicable mitigation measures. In this study, we used hourly monitored air quality data of CO, NO2, NOx, PM10, PM2.5, and SO2 from five stations in Konya and investigated the temporal and spatial variabilities for the 2008-2018 period via statistical analysis. Upon analysis, particulate matter was found to be the dominant pollutant deteriorating the air quality of Konya. The highest 2008-2018 periodic mean value of PM10 was found in Karatay Belediye as 70.5 µg/m3, followed by 67.4 µg/m3 in Meram, 58.7 µg/m3 in Selçuklu, and 43.7 µg/m3 in Selçuklu Belediye. The 24-h limit value of PM10 given as 50 µg/m3 in the legislation was violated in all of the stations, mainly during winter and autumn. High positive correlations were found among the stations, and the highest correlation was obtained between Selçuklu Belediye and Karatay Belediye with a Pearson correlation coefficient of 0.77. Long-term data showed a decreasing trend in PM10 concentrations. Diurnal variability is found to be more pronounced than weekly variability. For almost all of the pollutants, except for photochemical pollutants like O3, a prominent result was the nighttime and morning rush hours high-pollutant levels. A case study done for the January 29, 2018 to February 05, 2018 episode showed the importance of meteorology and topography on the high levels of pollution. Limitation of the pollutant transport and dilution by meteorological conditions and the location of Konya on a plain surrounded by high hills are believed to be the main reasons for having low air quality in the region.
Keywords: Air pollution meteorology; Emission sources; Integrated air quality assessment; Konya City.
© The Author(s), under exclusive licence to Springer Nature B.V. 2022.
Conflict of interest statement
Competing interestsThe authors declare no competing interests.
Figures


References
-
- Agacayak T, Kindap T, Unal A, Pozzoli L, Mallet M, Solmon F. A case study for Saharan dust transport over Turkey via RegCM4. 1 model. Atmos Res. 2015;153:392–403. doi: 10.1016/j.atmosres.2014.09.012. - DOI
-
- De Nevers N (2017) Air Pollution Control Engineering, 3rd Ed., McGraw Hill
-
- Dursun S (2019) Ambient particle matter pollution of Bosnia District of Konya City, Turkey. Int J Ecosyst Ecol Sci-IJEES, Volume: , Issue: 4. pp 591–602
-
- Elbir T, Mangir N, Kara M, Simsir S, Eren T, Ozdemir S. Development of a GIS-based decision support system for urban air quality management in the City of Istanbul. Atmos Environ. 2010;44:441–454. doi: 10.1016/j.atmosenv.2009.11.008. - DOI
-
- Flores RM, Özdemir H, Akkoyunlu BO, Ünal A, Tayanç M. Seasonal variation of carbonaceous PM2.5 in an Istanbul traffic site. Atmos Pollut Res. 2020;11(12):2110–2118. doi: 10.1016/j.apr.2020.06.022. - DOI
LinkOut - more resources
Full Text Sources