. 2022 Apr 7:12:868164.
doi: 10.3389/fonc.2022.868164. eCollection 2022.

Development and External Validation of a Simple-To-Use Dynamic Nomogram for Predicting Breast Malignancy Based on Ultrasound Morphometric Features: A Retrospective Multicenter Study

Affiliations

Development and External Validation of a Simple-To-Use Dynamic Nomogram for Predicting Breast Malignancy Based on Ultrasound Morphometric Features: A Retrospective Multicenter Study

Qingling Zhang et al. Front Oncol. .

Abstract

Background: With advances in high-throughput computational mining techniques, various quantitative predictive models that are based on ultrasound have been developed. However, the lack of reproducibility and interpretability have hampered clinical use. In this study, we aimed at developing and validating an interpretable and simple-to-use US nomogram that is based on quantitative morphometric features for the prediction of breast malignancy.

Methods: Successive 917 patients with histologically confirmed breast lesions were included in this retrospective multicentric study and assigned to one training cohort and two external validation cohorts. Morphometric features were extracted from grayscale US images. After feature selection and validation of regression assumptions, a dynamic nomogram with a web-based calculator was developed. The performance of the nomogram was assessed with respect to calibration, discrimination, and clinical usefulness.

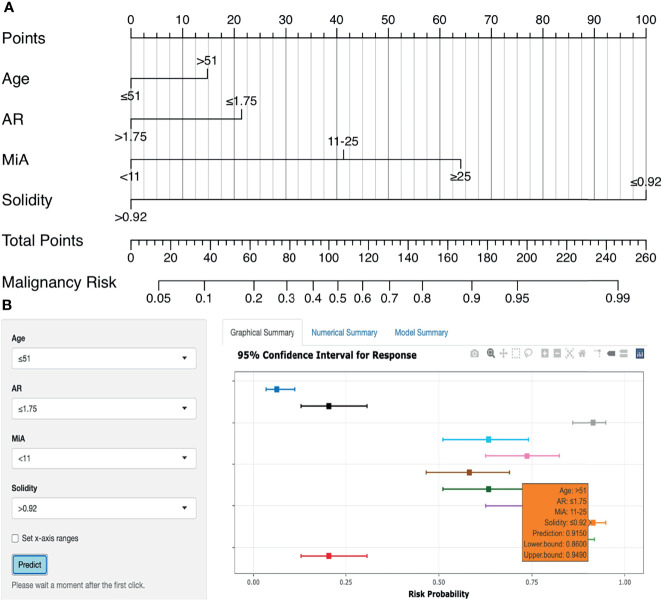
Results: Through feature selection, three morphometric features were identified as being the most optimal for predicting malignancy, and all regression assumptions of the prediction model were met. Combining all these predictors, the nomogram demonstrated a good discriminative performance in the training cohort and in the two external validation cohorts with AUCs of 0.885, 0.907, and 0.927, respectively. In addition, calibration and decision curves analyses showed good calibration and clinical usefulness.

Conclusions: By incorporating US morphometric features, we constructed an interpretable and easy-to-use dynamic nomogram for quantifying the probability of breast malignancy. The developed nomogram has good generalization abilities, which may fit into clinical practice and serve as a potential tool to guide personalized treatment. Our findings show that quantitative morphometric features from different ultrasound machines and systems can be used as imaging surrogate biomarkers for the development of robust and reproducible quantitative ultrasound dynamic models in breast cancer research.

Keywords: breast cancer; models; morphometrics; nomogram; quantitative imaging; ultrasound.


Conflict of interest statement

The authors declare that the research was conducted in the absence of any commercial or financial relationships that could be construed as a potential conflict of interest.

Figures

Figure 1
Figure 1
Illustrations of the morphometric features.
Figure 2
Figure 2
Flow chart of study population. (A) training cohort, (B) external validation cohort 1, and (C) external validation cohort 2.
Figure 3
Figure 3
Comparisons of morphological features between benign and malignant groups in the training cohort. Boxplots grouped by pathology show median (horizontal bars), IQR (boxes), and 95% CI (whiskers). Raw data points for each group are shown at the bottom of each box plot. Data were normalized and centered by Z-score transformation to appear on the same scale. Statistical analysis was performed using the Wilcoxon rank-sum test (all features except Round) and Student’s t test (Round). ***p < 0.001, ****p < 0.0001, ns, not significant.
Figure 4
Figure 4
Feature selection. (A) Selection of relevant morphometric features for discrimination between benign and malignant groups in the training cohort using the Boruta algorithm. Boxplots of features were sorted by increasing importance according to Z-scores. Blue boxes (Shadow) correspond to minimal, mean, and maximal importance, calculated from randomly permuted features. (B) Correlation matrix plot shows pairwise positively stronger correlations (blue) or negatively stronger correlations (red). Non-significant correlations (p > 0.05) are marked with a cross. (C) 3D scatter plots for final selected feature combinations displaying separations of benign and malignant groups.
Figure 5
Figure 5
The relationship between age and morphometric features with malignancy risk. OR and 95% CI for age (A), AR (B), MiA (C), and Solidity (D). The analyses used restricted cubic splines. Purple shaded areas, 95% CIs. Black horizontal dotted line, OR=1.00. Yellow vertical solid line, cut-off value.
Figure 6
Figure 6
Nomogram and online risk calculator. (A) Nomogram based on US morphometric features. Applications of the nomogram were exemplified in Supplementary Figure 5. (B) The online calculator application version of the nomogram.
Figure 7
Figure 7
Performance of the nomogram. (A) ROC curves of the nomogram in the training and external validation cohorts, respectively. (B) Calibration curves of the nomogram, which depict calibration of the nomogram in terms of agreement between the predicted risk of breast malignancy and observed outcomes. The diagonal dotted line denotes a perfect prediction, the closer the calibration curve fit is to the diagonal line, the better the predictive accuracy of the nomogram. (C) DCA curves of the nomogram. The gray and black dotted lines represent the hypothesis that all patients had a diagnosis of breast malignancy (“treat all”) and that no patients had a diagnosis of breast malignancy (“treat none”), respectively. X-axis indicates the threshold probability for pathological outcomes while the Y-axis indicates the standardized net benefit for a given threshold probability.

Similar articles

Cited by

References

    1. Sung H, Ferlay J, Siegel RL, Laversanne M, Soerjomataram I, Jemal A, et al. . Global Cancer Statistics 2020: Globocan Estimates of Incidence and Mortality Worldwide for 36 Cancers in 185 Countries. CA Cancer J Clin (2021) 71(3):209–49. doi: 10.3322/caac.21660 - DOI - PubMed
    1. Basu P, Ponti A, Anttila A, Ronco G, Senore C, Vale DB, et al. . Status of Implementation and Organization of Cancer Screening in the European Union Member States-Summary Results From the Second European Screening Report. Int J Cancer (2018) 142(1):44–56. doi: 10.1002/ijc.31043 - DOI - PubMed
    1. Hogben RK. Screening for Breast Cancer in England: A Review. Curr Opin Obstet Gynecol (2008) 20(6):545–9. doi: 10.1097/GCO.0b013e3283186fab - DOI - PubMed
    1. Evans A, Trimboli RM, Athanasiou A, Balleyguier C, Baltzer PA, Bick U, et al. . Breast Ultrasound: Recommendations for Information to Women and Referring Physicians by the European Society of Breast Imaging. Insights Imaging (2018) 9(4):449–61. doi: 10.1007/s13244-018-0636-z - DOI - PMC - PubMed
    1. Pan B, Yao R, Zhu QL, Wang CJ, You SS, Zhang J, et al. . Clinicopathological Characteristics and Long-Term Prognosis of Screening Detected Non-Palpable Breast Cancer by Ultrasound in Hospital-Based Chinese Population (2001-2014). Oncotarget (2016) 7(47):76840–51. doi: 10.18632/oncotarget.12319 - DOI - PMC - PubMed