

Combining Genome-Wide Association Study and Gene-Based Haplotype Analysis to Identify Candidate Genes for Alkali Tolerance at the Germination Stage in Rice
- PMID: 35463411
- PMCID: PMC9033254
- DOI: 10.3389/fpls.2022.887239
Combining Genome-Wide Association Study and Gene-Based Haplotype Analysis to Identify Candidate Genes for Alkali Tolerance at the Germination Stage in Rice
Abstract
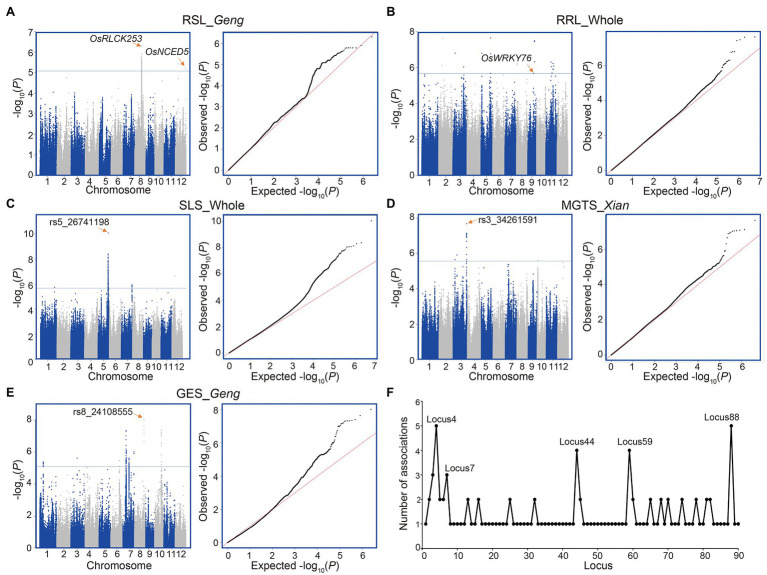
Salinity-alkalinity stress is one of the main abiotic factors limiting rice production worldwide. With the widespread use of rice direct seeding technology, it has become increasingly important to improve the tolerance to salinity-alkalinity of rice varieties at the germination stage. Although we have a more comprehensive understanding of salt tolerance in rice, the genetic basis of alkali tolerance in rice is still poorly understood. In this study, we measured seven germination-related traits under alkali stress and control conditions using 428 diverse rice accessions. The alkali tolerance levels of rice germplasms varied considerably during germination. Xian/indica accessions had generally higher tolerance to alkali stress than Geng/japonica accessions at the germination stage. Using genome-wide association analysis, 90 loci were identified as significantly associated with alkali tolerance. Eight genes (LOC_Os01g12000, LOC_Os03g60240, LOC_Os03g08960, LOC_Os04g41410, LOC_Os09g25060, LOC_Os11g35350, LOC_Os12g09350, and LOC_Os12g13300) were selected as important candidate genes for alkali tolerance based on the gene functional annotation and gene-CDS-haplotype analysis. According to the expression levels of LOC_Os09g25060 (OsWRKY76), it is likely to play a negative regulatory role in alkali tolerance during rice germination. An effective strategy for improving rice alkali tolerance may be to pyramid alkali-tolerant haplotypes of multiple candidate genes to obtain the optimal haplotype combination. Our findings may provide valuable genetic information and expand the use of alkali tolerance germplasm resources in rice molecular breeding to improve the alkali tolerance at the germination stage.
Keywords: alkali tolerance; genome-wide association study; germination stage; haplotype analysis; rice.
Copyright © 2022 Mei, Zhang, Jiang, Lu and Zhang.
Conflict of interest statement
The authors declare that the research was conducted in the absence of any commercial or financial relationships that could be construed as a potential conflict of interest.
Figures


Similar articles
-
Candidate genes for alkali tolerance identified by genome-wide association study at the seedling stage in rice (Oryza sativa L.).Sci Rep. 2024 Dec 3;14(1):30063. doi: 10.1038/s41598-024-79273-7. Sci Rep. 2024. PMID: 39627306 Free PMC article.
-
Genome-wide association and epistasis studies reveal the genetic basis of saline-alkali tolerance at the germination stage in rice.Front Plant Sci. 2023 May 11;14:1170641. doi: 10.3389/fpls.2023.1170641. eCollection 2023. Front Plant Sci. 2023. PMID: 37251777 Free PMC article.
-
Identification of a key locus, qRL8.1, associated with root length traits during seed germination under salt stress via a genome-wide association study in rice.BMC Plant Biol. 2025 Mar 5;25(1):287. doi: 10.1186/s12870-025-06207-4. BMC Plant Biol. 2025. PMID: 40045220 Free PMC article.
-
QTL Mapping and Candidate Gene Analysis for Alkali Tolerance in Japonica Rice at the bud Stage Based on Linkage Mapping and Genome-Wide Association Study.Rice (N Y). 2020 Jul 16;13(1):48. doi: 10.1186/s12284-020-00412-5. Rice (N Y). 2020. PMID: 32676742 Free PMC article.
-
Identification and Regulation of Hypoxia-Tolerant and Germination-Related Genes in Rice.Int J Mol Sci. 2024 Feb 11;25(4):2177. doi: 10.3390/ijms25042177. Int J Mol Sci. 2024. PMID: 38396854 Free PMC article. Review.
Cited by
-
Genome-Wide Association Study Identified Candidate Genes for Alkalinity Tolerance in Rice.Plants (Basel). 2023 Jun 3;12(11):2206. doi: 10.3390/plants12112206. Plants (Basel). 2023. PMID: 37299185 Free PMC article.
-
Regulation of Root Exudation in Wheat Plants in Response to Alkali Stress.Plants (Basel). 2024 Apr 28;13(9):1227. doi: 10.3390/plants13091227. Plants (Basel). 2024. PMID: 38732442 Free PMC article.
-
Effect of Qiangdi 863 Nanosynergids Treated Water, Nitrogen, Phosphorous and Potassium Fertilizers on Rice Growth Physiology and Grain Quality.Front Plant Sci. 2022 Jul 14;13:916949. doi: 10.3389/fpls.2022.916949. eCollection 2022. Front Plant Sci. 2022. PMID: 35909737 Free PMC article.
-
Candidate genes for alkali tolerance identified by genome-wide association study at the seedling stage in rice (Oryza sativa L.).Sci Rep. 2024 Dec 3;14(1):30063. doi: 10.1038/s41598-024-79273-7. Sci Rep. 2024. PMID: 39627306 Free PMC article.
-
Comparison of the Morpho-Physiological and Molecular Responses to Salinity and Alkalinity Stresses in Rice.Plants (Basel). 2023 Dec 23;13(1):60. doi: 10.3390/plants13010060. Plants (Basel). 2023. PMID: 38202367 Free PMC article.
References
-
- Alvarado A. D., Bradford K. J., Hewitt J. D. (1987). Osmotic priming of tomato seed: effect on germination, field emergence, seedling growth and fruit yield. J. Am. Soc. Hortic. Sci. 112, 427–432.
-
- Campbell M. T., Bandillo N., Al Shiblawi F. R. A., Sharma S., Liu K., Du Q., et al. . (2017). Allelic variants of OsHKT1;1 underlie the divergence between indica and japonica subspecies of rice (Oryza sativa) for root sodium content. PLoS Genet. 13:e1006823. doi: 10.1371/journal.pgen.1006823, PMID: - DOI - PMC - PubMed
-
- Cheng S. H., Cao L. Y., Zhuang J. Y., Chen S. G., Zhan X. D., Fan Y. Y., et al. . (2007). Super hybrid rice breeding in China: achievements and prospects. J. Integr. Plant Biol. 49, 805–810. doi: 10.1111/j.1744-7909.2007.00514.x - DOI
-
- de Mendiburu F. (2021). Agricolae: statistical procedures for agricultural research. R Package Version 1.3-5. Available at: https://cran.r-project.org/web/packages/agricolae (Accessed January 12 2022).
LinkOut - more resources
Full Text Sources