. 2022 Apr 6:9:840647.
doi: 10.3389/fcvm.2022.840647. eCollection 2022.

Profiling Genome-Wide DNA Methylation Patterns in Human Aortic and Mitral Valves

Affiliations

Profiling Genome-Wide DNA Methylation Patterns in Human Aortic and Mitral Valves

Sarah Halawa et al. Front Cardiovasc Med. .

Abstract

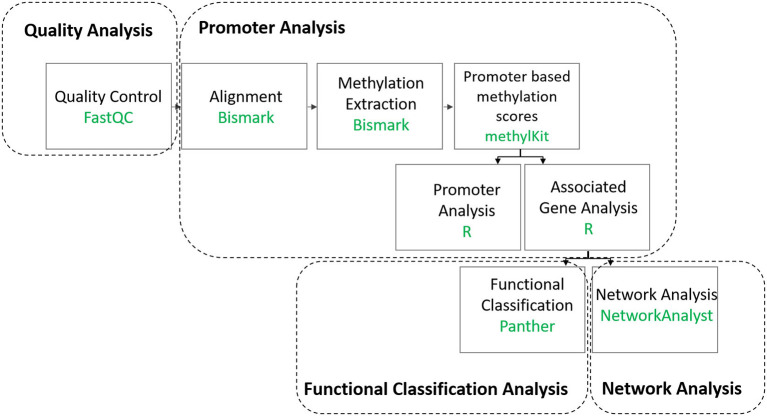
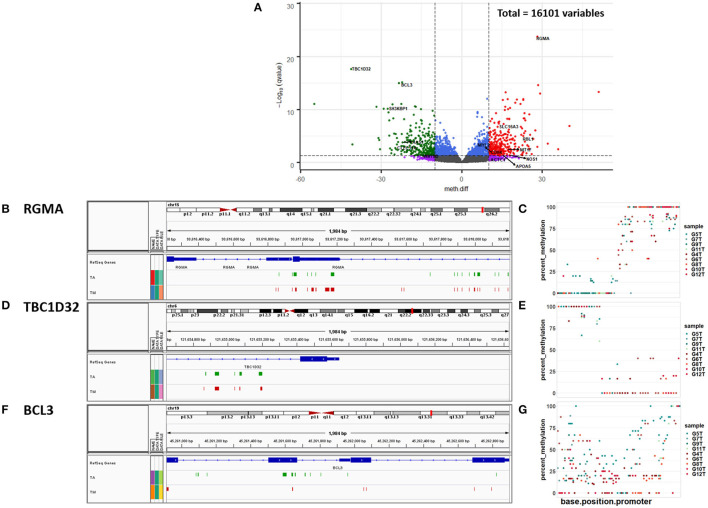
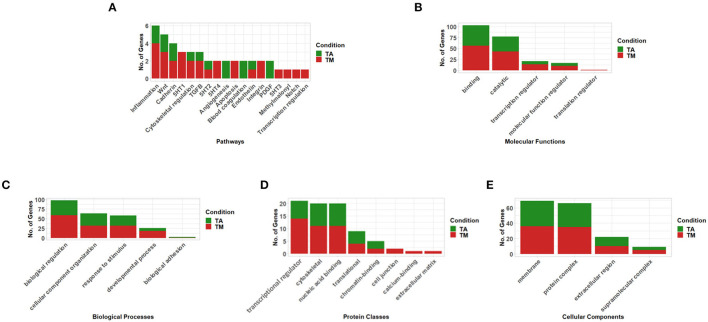
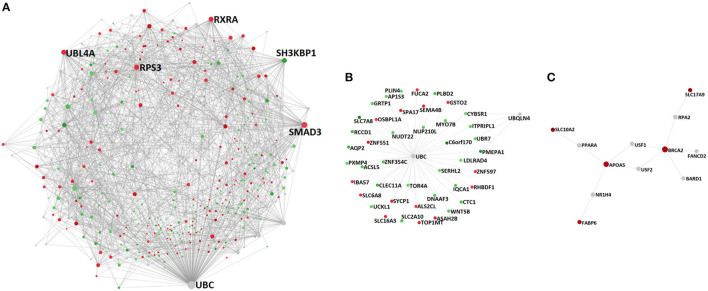
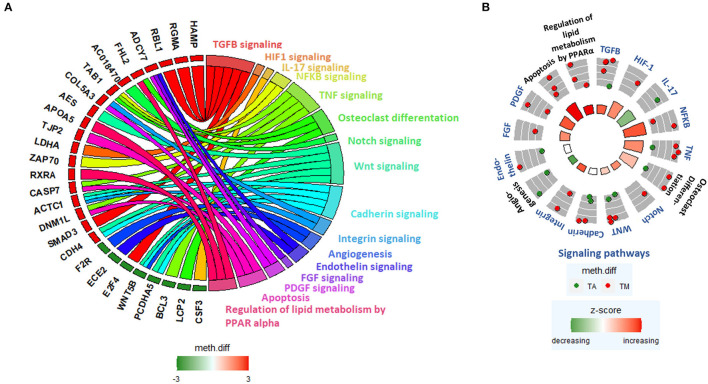
Cardiac valves exhibit highly complex structures and specialized functions that include dynamic interactions between cells, extracellular matrix (ECM) and their hemodynamic environment. Valvular gene expression is tightly regulated by a variety of mechanisms including epigenetic factors such as histone modifications, RNA-based mechanisms and DNA methylation. To date, methylation fingerprints of non-diseased human aortic and mitral valves have not been studied. In this work we analyzed the differential methylation profiles of 12 non-diseased aortic and mitral valve tissue samples (in matched pairs). Analysis of methylation data [reduced representation bisulfite sequencing (RRBS)] of 16,101 promoters genome-wide revealed 584 differentially methylated (DM) promoters, of which 13 were reported in endothelial mesenchymal trans-differentiation (EMT), 37 in aortic and mitral valve disease and 7 in ECM remodeling. Both functional classification as well as network analysis showed that the genes associated with the DM promoters were enriched for WNT-, Cadherin-, Endothelin-, PDGF-, HIF-1 and VEGF- signaling implicated in valvular physiology and pathophysiology. Additional enrichment was detected for TGFB-, NOTCH- and Integrin- signaling involved in EMT as well as ECM remodeling. This data provides the first insight into differential regulation of human aortic and mitral valve tissue and identifies candidate genes linked to DM promoters. Our work will improve the understanding of valve biology, valve tissue engineering approaches and contributes to the identification of relevant drug targets.

Keywords: HIF-1 signaling pathway; NOTCH signaling; endothelial mesenchymal trans-differentiation (EMT); epigenetics; extracellular matrix (ECM); heart valves; promoters; regulation of actin cytoskeleton.


Conflict of interest statement

The authors declare that the research was conducted in the absence of any commercial or financial relationships that could be construed as a potential conflict of interest.

Figures

Figure 1
Figure 1
Summary of the data analysis workflow.
Figure 2
Figure 2
(A) Volcano plot of promoter methylation profiles. The vertical lines x = −10 and x = 10 represent our chosen methylation difference (meth.diff) cut-off value of |10|. meth.diff is calculated as described in the Methods. The horizontal line [y = -log10 (0.05) = 1.3] shows our chosen q-value cut-off of 0.05. The circles represent the 16,101 promoters, of which 584 are differentially methylated (DM). Each circle in the volcano plot represents a promoter with its meth.diff and -log10 (q-value). Gray circles denote promoters that are not DM. Purple circles represent promoters that are biologically, but not statistically significant. Blue circles depict the opposite trend. Red and green circles show promoters that are both statistically and biologically significant. Genes with a meth.diff > 0 (red) show increased methylation in the mitral compared to the aortic valve (↑) and genes with a meth.diff <0 (green) show decreased methylation in the mitral compared to the aortic valve (↓). Snapshots of the IGV genome browser showing the top 3 most significantly differentially methylated promoters linked to (B) RGMA (C) TBC1D32 and (D) BCL3, respectively (coordinates identified in Supplementary Table 1). TM denotes the union of the percent methylation values in all mitral samples that are >70% and which are present in the mitral but not in the aortic samples. TA denotes the union of the percent methylation values in all aortic samples that are >70% and which are present in the aortic but not in the mitral samples. Scatter plots of the percent methylation per base per promoter of the top 3 most significantly differentially methylated promoters linked to (E) RGMA (F) TBC1D32 and (G) BCL3, respectively (coordinates identified in Supplementary Table 1). Aortic samples: G5T, G7T, G9T, G11T; mitral samples (G4T, G6T, G8T, G10T, G12T).
Figure 3
Figure 3
Functional classification of genes associated with differentially methylated promoters (q-value < 0.05 & meth.diff >|10|) between aortic and mitral tissue according to (A) Pathways, (B) Molecular Functions, (C) Biological Processes, (D) Protein Classes and (E) Cellular Components (selected results, the remaining can be found in Supplementary Figure 5– analysis performed using PANTHER). In the stacked bar graphs, TA (green) labels genes with promoters that show increased methylation in the aortic compared to the mitral valves and TM (red) shows genes whose promoters exhibit increased methylation in the mitral compared to the aortic valves.
Figure 4
Figure 4
PPI networks constructed upon the genes associated with differentially methylated promoters between non-diseased aortic and mitral valve tissue and the proteins that are necessary to interconnect them: (A) complete network, (B) subnetwork 1 (p-value 3.04e-13) and (C) subnetwork 2 (p-value 0.047). Depicted nodes are classified according to their methylation direction: nodes representing genes showing increased methylation in mitral compared to aortic tissue (red), nodes depicting increased methylation in aortic vs. mitral tissue (green) and nodes representing genes that are not part of the input dataset (gray). Node sizes are proportional to their betweenness centrality values. Betweenness centrality reflects the number of shortest paths passing through a node, while degree refers to the number of connections/edges/PPIs that a node has to other nodes. Hub nodes (A) UBC, SMAD3, UBL4A, RPS3, RXRA, (B) UBC and (C) BRCA2 and APOA5 can be clearly identified on the respective networks.
Figure 5
Figure 5
(A) GOChord plot linking selected pathways to their constituent genes, which are associated with DM promoters. Green-to-red colors next to the selected genes reflect their meth.diff values. (B) GOCircle plot representing the relevant pathways and their constituent genes that are associated with DM promoters. The inner circle consists of bar plots, whose heights reflect the significance of the pathway and whose color reflect the z-score, which approximates the overall direction of change in methylation for each pathway. The outer circle shows scatterplots of the meth.diff values of each of the pathway's constituent genes.

References

    1. Chester AH, El-Hamamsy I, Butcher JT, Latif N, Bertazzo S, Yacoub MH. The living aortic valve: from molecules to function. Glob Cardiol Sci Pract. (2014) 2014:52–77. 10.5339/gcsp.2014.11 - DOI - PMC - PubMed
    1. Yacoub MH. In search of living valve substitutes. J Am Coll Cardiol. (2015) 66:889–91. 10.1016/j.jacc.2015.07.007 - DOI - PubMed
    1. Yacoub MH, Cohn LH. Novel approaches to cardiac valve repair. from structure to function: part I. Circulation. (2004) 109:1064–72. 10.1161/01.CIR.0000115634.66549.4D - DOI - PubMed
    1. Roy A, Brand NJ, Yacoub MH. Molecular characterization of interstitial cells isolated from human heart valves. J Heart Valve Dis. (2000) 9:459–464. - PubMed
    1. Yacoub MH, Takkenberg JJM. Will heart valve tissue engineering change the world? Nat Clin Pract Cardiovasc Med. (2005) 2:60–1. 10.1038/ncpcardio0112 - DOI - PubMed

LinkOut - more resources