. 2022 Apr 8:16:739866.
doi: 10.3389/fnhum.2022.739866. eCollection 2022.

Impact of Spatial Orientation Ability on Air Traffic Conflict Detection in a Simulated Free Route Airspace Environment

Affiliations

Impact of Spatial Orientation Ability on Air Traffic Conflict Detection in a Simulated Free Route Airspace Environment

Jimmy Y Zhong et al. Front Hum Neurosci. .

Abstract

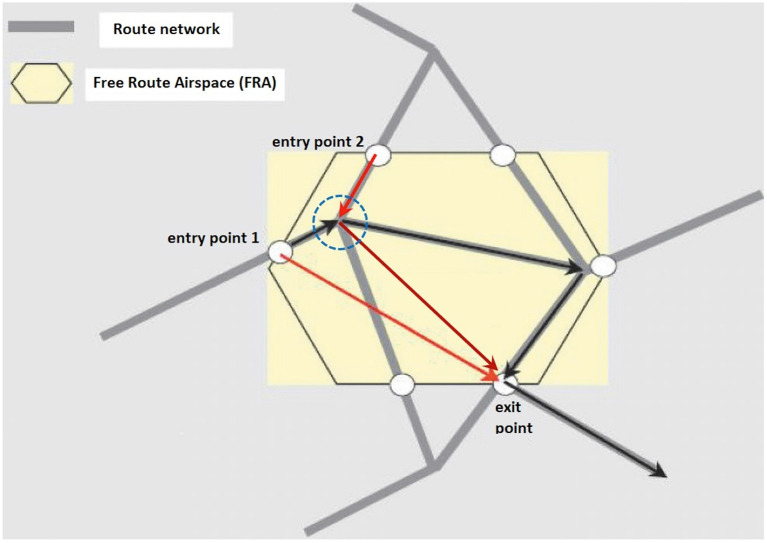
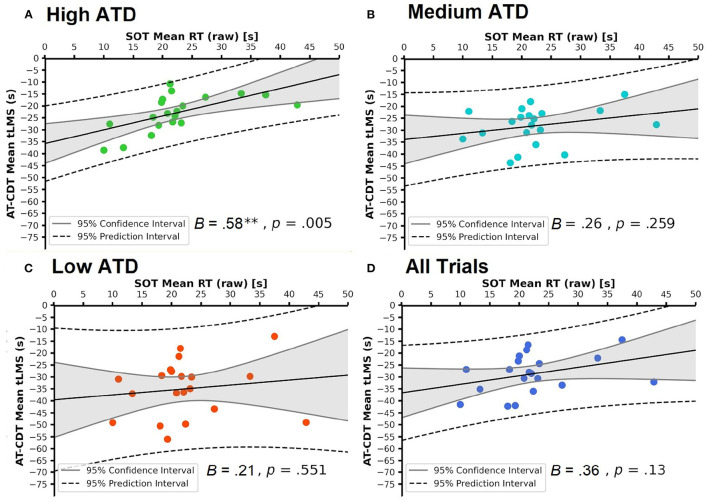
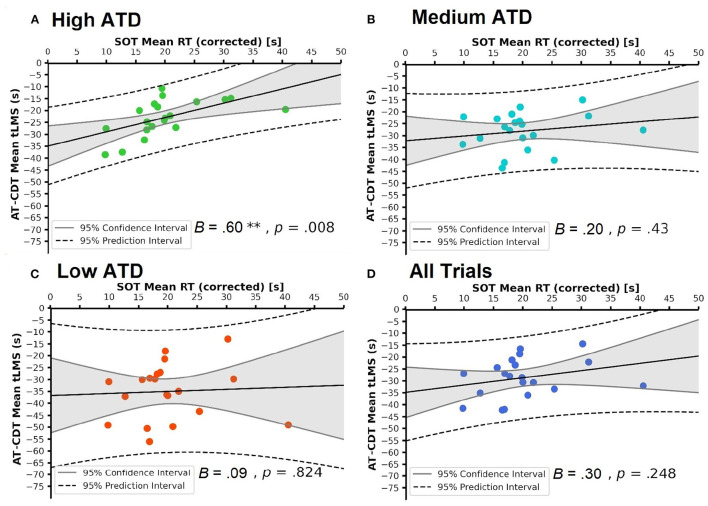
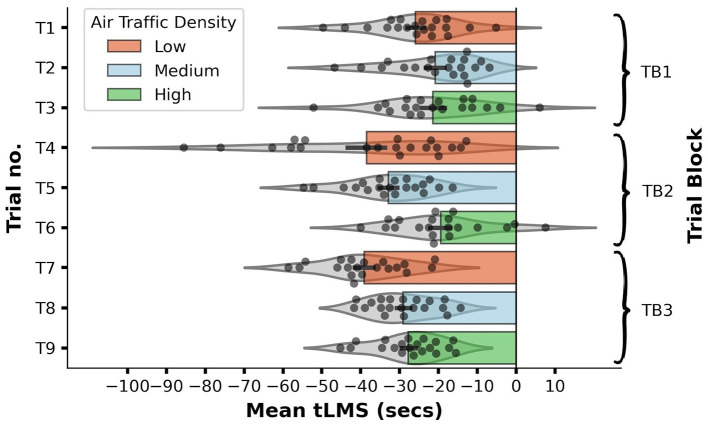
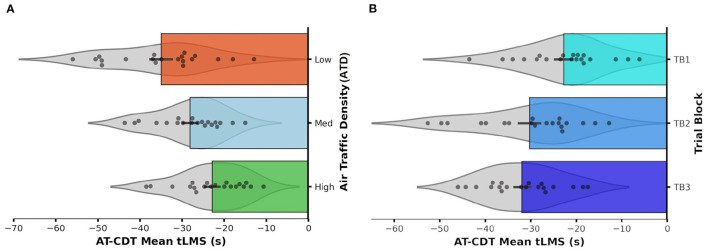
In the selection of job candidates who have the mental ability to become professional ATCOs, psychometric testing has been a ubiquitous activity in the ATM domain. To contribute to psychometric research in the ATM domain, we investigated the extent to which spatial orientation ability (SOA), as conceptualized in the spatial cognition and navigation literature, predicted air traffic conflict detection performance in a simulated free route airspace (FRA) environment. The implementation of free route airspace (FRA) over the past few years, notably in Europe, have facilitated air traffic services by giving greater flexibility to aviation operators in planning and choosing preferred air routes that can lead to quicker arrivals. FRA offers enhanced system safety and efficiency, but these benefits can be outweighed by the introduction of air traffic conflicts that are geometrically more complex. Such conflicts can arise from increased number and distribution of conflict points, as well as from elevated uncertainty in aircraft maneuvering (for instance, during heading changes). Overall, these issues will make conflict detection more challenging for air traffic controllers (ATCOs). Consequently, there is a need to select ATCOs with suitably high levels of spatial orientation ability (SOA) to ensure flight safety under FRA implementation. In this study, we tested 20 participants who are eligible for ATCO job application, and found that response time-based performance on a newly developed, open access, computerized spatial orientation test (SOT) predicted time to loss of minimum separation (tLMS) performance on an air traffic conflict detection task (AT-CDT) we designed. We found this predictive relationship to be significant to a moderately large extent under scenarios with high air traffic density (raw regression coefficient = 0.58). Moreover, we demonstrated our AT-CDT as a valid test in terms of eliciting well-known mental workload and spatial learning effects. We explained these findings in light of similar or overlapping mental processes that were most likely activated optimally under task conditions featuring approximately equal numbers of outcome-relevant stimuli. We conclude by discussing the further application of the SOT to the selection of prospective ATCOs who can demonstrate high levels of conflict detection performance in FRA during training simulations.

Keywords: Air Traffic Management; conflict detection; psychometric testing; spatial navigation; spatial orientation.


Conflict of interest statement

The authors declare that the research was conducted in the absence of any commercial or financial relationships that could be construed as a potential conflict of interest.

Figures

Figure 1
Figure 1
Schematic diagram of a hypothetical free route airspace (FRA). Fixed air routes that are pre-established according to an initial flight plan are delineated in gray. Free air routes, marking out shorter and more direct paths to an exit point, are delineated in red. In this fictional scenario, the spatial orientation ability of an air traffic controller (ATCO) matters at a “crossing point” of two air routes (circled in dashed blue lines) at which aircraft heading changes are set to occur. For an aircraft traveling on a fixed route (black arrows from entry point 1 to exit point) and another traveling on a free route (red arrows from entry point 2 to exit point), an ATCO must be extra vigilant of their orientation changes at the prospective crossing point on the radar screen so as to prevent the occurrence of any conflict between the aircraft. This is especially so when the two aircraft fly at similar airspeeds and at flight levels that differ by 1,000 feet or less (Adapted with permission from Figure 1 of Antulov-Fantulin et al., 2020).
Figure 2
Figure 2
Screenshot of a practice trial in Friedman et al.'s (2020) spatial orientation test (SOT). For clarity of presentation, each 2D object are shown in higher contrast, verbal instructions and object labels are also enlarged. The target direction in the upper right quadrant of the response circle (derived from the computer mouse actions of the lead author) shows the estimated position of the wheel relative to an initial heading that is to be imagined). Reproduced with permission under the Creative Common Attribution 4.0 license).
Figure 3
Figure 3
2K radar monitor (2,048 pixels × 2,048 pixels) used for showing simulated air traffic data. The air traffic scenario shown was taken from the third air traffic conflict detection test trial—the first high air traffic density (ATD) condition with 14 aircraft. The left panel shows the 20 mm ruler (boxed on bottom left corner of the radar display) that indicates 5.0 nm separation between a pair of aircraft while the right panel shows details from an enlarged data block of an aircraft (boxed on the right side of the radar display) appearing in the eastern sector of the controlled airspace. The university logo and the full name of the research institute were displayed at the top right corner of the radar display.
Figure 4
Figure 4
Conflict event models A (A) and B (B). Algebraic symbols and equations specify the length of the path segments of the air routes (not drawn to scale) and their topological relationships. These routes were kept hidden from participants' view. Colored aircraft represent aircraft cruising on the same flight level while gray aircraft in the background represent aircraft cruising at flight levels different from that of the former cluster. On the same flight level, a non-conflicting aircraft in each model (colored in green) was placed initially at a safe distance away from the conflict zone, which is represented by the dotted circle with a radius of 5.0 nm. The total number of non-conflicting aircraft located in the vicinity of two conflicting aircraft that constituted each conflict event increased from one in the low air traffic density (ATD) condition to three and five in the medium and high ATD conditions, respectively (see text, for more details).
Figure 5
Figure 5
First block of three simulation trials showing three levels of air traffic density (ATD): (A) low (six aircraft), (B) medium (10 aircraft), and (C) high (14 aircraft). White circles, each with a radius of 5.0 nm, delineate the boundaries of the conflict zones. Such circles were not shown during simulation. Through a Latin square design, the pairwise combinations of conflict sites recurred in two different, non-overlapping sequences across the three ATD conditions over the next two blocks of trials (three trials each). The initial arrangement of aircraft in each subsequent ATD condition differed from the arrangement of aircraft shown within the first trial block and varied from each other.
Figure 6
Figure 6
Figure showing (A) the boundaries of an air traffic control (ATC) sector (colored in yellow) covering the airspace in the southeastern region of Singapore island generated using Google Earth and (B) the aircraft number recorded on a randomly selected 24-h working day in 2019 before COVID-19 outbreak. Descriptive statistics are shown on the top left corner; SD, Standard Deviation; Min., Minimum; Max., Maximum.
Figure 7
Figure 7
Scatter-plots showing the linear relationships between mean Spatial Orientation Test (SOT) raw reaction time (RT) and mean Air Traffic Conflict Detection Task (AT-CDT) time to loss of minimum separation (tLMS) under each of (A–C) three air traffic density (ATD) conditions and over (D) all AT-CDT test trials. Raw regression coefficients are shown. (A) shows the significant correlation emanating from the high ATD condition. Ninety five percent confidence and prediction intervals are shown. In all plots, no data points lie beyond the 95% prediction interval, showing the absence of outliers.
Figure 8
Figure 8
Scatter-plots showing the linear relationships between mean Spatial Orientation Test (SOT) corrected reaction times (RT) and mean Air Traffic Conflict Detection Task (AT-CDT) time to loss of minimum separation (tLMS) under each of (A–C) three air traffic density (ATD) conditions and over (D) all AT-CDT test trials. Raw regression coefficients are shown. (A) shows the significant correlation emanating from the high ATD condition. 95% confidence and prediction intervals are shown. In all plots, no data points lie beyond the 95% prediction interval, showing the absence of outliers.
Figure 9
Figure 9
Horizontal bar graph with violin plots showing the distribution of mean Air Traffic Conflict Detection Task (AT-CDT) time to loss of minimum separation (tLMS) values obtained from each participant on each test trial (T1–T9). Longer bars represent faster responses associated with quicker detections of conflicts. Each error bar represents ± 1 SE. Zero on the x-axis marks the time-point at which a conflict event occurs. The violin plot overlaid on each bar represents the probability density function (PDF) of the data distribution on each trial. Each PDF was mirrored along the central horizontal axis of each bar. Data distribution on the fourth trial was platykurtic due to the presence of a few fast responders.
Figure 10
Figure 10
Horizontal bar graph with violin plots showing the distribution of mean Air Traffic Conflict Detection Task (AT-CDT) time to loss of minimum separation (tLMS) values obtained from each participant under (A) each air traffic density (ATD) condition and within (B) each trial block (TB). Longer bars represent faster responses associated with quicker detections of conflicts. Each error bar represents ± 1 SE. Zero on the x-axis marks the time-point at which a conflict event occurs. The violin plot overlaid on each bar represents the probability density function (PDF) of the data distribution falling within (A) each ATD condition and (B) TB. Each PDF was mirrored along the central horizontal axis of each bar. There was no prominent skewness in data distribution in any ATD condition or TB.

References

    1. Ackerman P. L., Cianciolo A. T. (2002). Ability and task constraint determinants of complex task performance. J. Exp. Psychol. Appl. 8, 194–208. 10.1037/1076-898X.8.3.194 - DOI - PubMed
    1. Ackerman P. L., Kanfer R. (1993). Integrating laboratory and field study for improving selection: development of a battery for predicting air traffic controller success. J. Appl. Psychol. 78, 413–432. 10.1037/0021-9010.78.3.413 - DOI
    1. Ackerman P. L., Kanfer R., Goff M. (1995). Cognitive and noncognitive determinants and consequences of complex skill acquisition. J. Exp. Psychol. Appl. 1, 270–304. 10.1037/1076-898X.1.4.270 - DOI
    1. Aneeka S., Zhong Z. W. (2016). NOX and CO2 emissions from current air traffic in ASEAN region and benefits of free route airspace implementation. J. Appl. Phys. Sci. 2, 32–36. 10.20474/japs-2.2.1 - DOI
    1. Antulov-Fantulin B., Juričić B., Radišić T., Rogošić T. (2020). Free route airspace for efficient air traffic management. Eng. Power 15, 10–17. Available online at: https://hrcak.srce.hr/244895