. 2022 Apr 12:2022:7740079.
doi: 10.1155/2022/7740079. eCollection 2022.

RANKL Impairs the TLR4 Pathway by Increasing TRAF6 and RANK Interaction in Macrophages

Affiliations

RANKL Impairs the TLR4 Pathway by Increasing TRAF6 and RANK Interaction in Macrophages

Ryerson Fonseca Mota et al. Biomed Res Int. .

Abstract

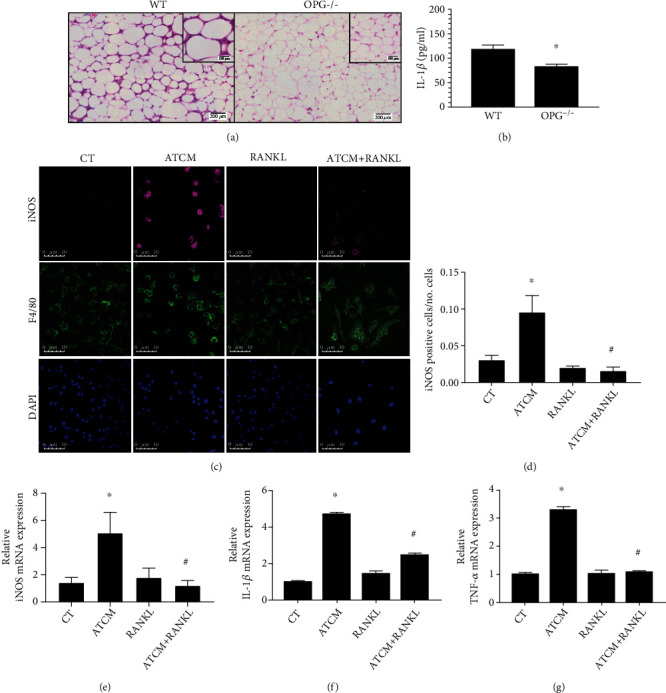
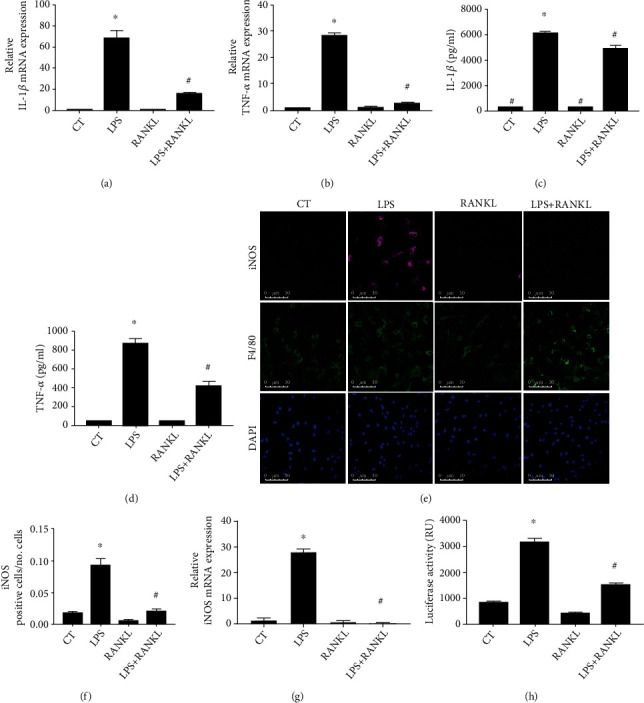
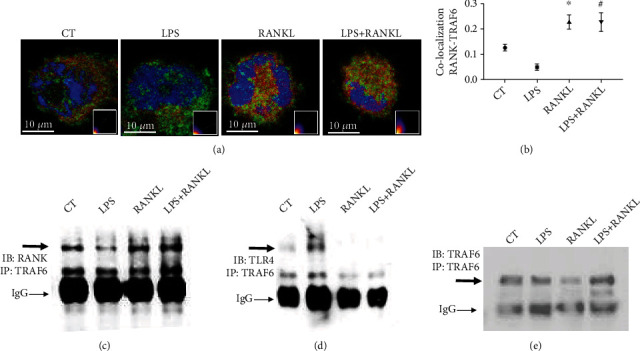
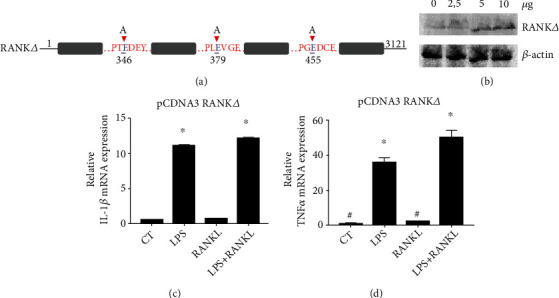
High serum levels of osteoprotegerin (OPG) are found in patients with obesity, type 2 diabetes, sepsis, or septic shock and are associated with a high mortality rate in stroke. The primary known function of OPG is to bind to the receptor activator of NF-κB ligand (RANKL), and by doing so, it inhibits the binding between RANKL and its receptor (RANK). TLR4 signaling in macrophages involves TRAF6 recruitment and contributes to low-grade chronic inflammation in adipose tissue. LPS is a classical activator of the TLR4 pathway and induces the expression of inflammatory cytokines in macrophages. We have previously observed that in the presence of RANKL, there is no LPS-induced activation of TLR4 in macrophages. In this study, we investigated the crosstalk between RANK and TLR4 pathways in macrophages stimulated with both RANKL and LPS to unveil the role of OPG in inflammatory processes. We found that RANKL inhibits TLR4 activation by binding to RANK, promoting the binding between TRAF6 and RANK, lowering TLR4 activation and the expression of proinflammatory mediators. Furthermore, high OPG levels aggravate inflammation by inhibiting RANKL. Our findings elect RANKL as a candidate for drug development as a way to mitigate the impact of obesity-induced inflammation in patients.


Conflict of interest statement

The authors declare no conflict of interest.

Figures

Figure 1
Figure 1
RANKL reduces inflammation in adipose tissue and macrophages. (a) Representative images of H.E.-stained visceral white adipose tissue (vWAT) from wild-type (WT) mice showing increased cell infiltration and crown-like structure formation (inset image) compared to OPG-/- mice under a high-fat diet for 3 months. (b) Interleukin-1β (IL-1β) level in the supernatant of vWAT from a 3-month high-fat diet-fed WT and OPG-/- mice cultured ex vivo for 24 h and detected by ELISA, n = 6, ∗p < 0.05 vs. WT. (c) Representative images of macrophages immunostained to detect iNOS (magenta), F4/80 (green), and nuclei (DAPI, blue) by immunofluorescence in THP1 macrophages with culture medium (CT), stimulated with RANKL (10 ng/ml), and adipose tissue-conditioned medium (ATCM) with or without RANKL (10 ng/ml) (ATCM+RANKL) for 24 h. (d) Quantification of iNOS positive cells in CT, RANKL, ATCM, and ATCM+RANKL groups. The quantification was based on the threshold measured in 6 fields of each sample by ImageJ software (n = 40). (e) Quantification of relative iNOS mRNA expression in ATCM, RANKL, and ATCM+RANKL stimulated THP1 macrophages for 24 h, detected by qPCR, and compared to the nonstimulated control group (CT). (e and f) IL-1β and TNF-α expression in bone marrow-derived macrophages stimulated with ATCM and RANKL (10 ng/ml) for 24 h detected by qPCR and compared to the nonstimulated control group (CT). ∗p < 0.01 vs. CT and #p < 0.01vs. ATCM. All data are presented as means ± SD.
Figure 2
Figure 2
RANKL lowers LPS response in macrophages. (a and b) IL-1β and TNF-α expression in THP1 macrophages stimulated with LPS (10 ng/ml) and RANKL (10 ng/ml) or costimulated with both (LPS+RANKL) for 24 h, detected by qPCR, and compared to the nonstimulated control group (CT). (c and d) IL-1β and TNF-α protein level in supernatant of THP1 macrophages stimulated with LPS (10 ng/ml) and RANKL (10 ng/ml) or costimulated with both (LPS+RANKL) for 24 h and detected by ELISA. (e) Representative images of macrophages immunostained to detect iNOS (magenta), F4/80 (green), and nuclei (DAPI, blue) by immunofluorescence in THP1 macrophages stimulated with LPS (10 ng/ml) and RANKL (10 ng/ml) or costimulated with both (LPS+RANKL) for 24 h. (f) Quantification of iNOS positive cells in LPS and RANKL stimulated THP1 macrophages. The quantification was based on the threshold in 6 fields of each sample by ImageJ software (n = 4). (g) Quantification of relative iNOS mRNA expression in THP1 macrophages stimulated with LPS and RANKL or costimulated with both (LPS+RANKL) for 24 h, detected by qPCR, and compared to the nonstimulated control group (CT). (h) Quantification of NF-κB activation in THP1 macrophages transfected with a plasmid expressing NF-κB-driven luciferase stimulated with LPS (10 ng/ml) and RANKL (10 ng/ml) or costimulated with both (LPS+RANKL) for 24 h and detected by luciferase activity presented as relative units (RU). A one-way ANOVA followed by Bonferroni's multiple comparisons test was performed to compare all groups (∗p < 0.01 vs. CT and #p < 0.01 vs. LPS). The data represent the mean of three independent experiments and are presented as means ± SD.
Figure 3
Figure 3
RANKL promotes TRAF6 and RANK interaction in detriment to TLR4 in LPS-induced macrophages. (a) Representative images of RANK and TRAF6 colocalization by confocal microscopy in THP1 macrophages stimulated with LPS (10 ng/ml) and RANKL (10 ng/ml) and costimulated with both (LPS+RANKL) for 10 min or nonstimulated as the control group (CT), inset: colocalization scattergram graphs. The cells were labeled with RANK (green), TRAF6 (red), and DAPI (blue). (b) Quantification of protein interaction by RANK-TRAF6 immunofluorescence colocalization. Manders' correlation coefficient was used to calculate colocalization of the cell sections. A one-way ANOVA followed by Bonferroni's multiple comparisons test was performed to compare all groups, n = 6. All data are presented as mean ± SEM. ∗p < 0.0001 vs. CT. #p < 0.0001 vs. LPS). (c, d, and e) Detection by western blot of RANK, TLR4, and TRAF6 co-immunoprecipitated with TRAF6 in protein extracts from THP1 macrophages stimulated with LPS (10 ng/ml) and RANKL (10 ng/ml) or costimulated with both (LPS+RANKL) for 10 min.
Figure 4
Figure 4
RANKL inhibits LPS-induced cytokine expression upon TRAF6/RANK binding. (a) The sequence of RANK points mutated in 3 different glutamic acid residues in TRAF6 binding sites (RANKΔ). (b) Detection of RANK by western blot in THP1 macrophages after transfection of different doses of pCDNA3 plasmid expressing. (c) IL-1β and (d) TNF-α expression in THP1 macrophages transfected with 5 μg of RANKΔ-expressing pCDNA3 plasmid and stimulated with LPS (10 ng/ml) and RANKL (10 ng/ml) and costimulated with both (LPS+RANKL) for 24 h or nonstimulated control group (CT) and detected by qPCR. A one-way ANOVA followed by Bonferroni's multiple comparisons test was performed to compare all groups. All data are presented as mean ± SEM. ∗p < 0.0001 vs. CT.
Figure 5
Figure 5
RANKL downregulates the pathways related to chemotaxis in BMDM. (a) MA plot for log2 folds changes values against normalized counts for each gene in the analysis. Red points mark genes with FDR < 0.1. (b) Visualization as a heat map of genes that are up- and downregulated in BMDM without (CT) or with RANKL stimulation (10 ng/ml) (RANKL) for 24 h.

References

    1. Lumeng C. N., DelProposto J. B., Westcott D. J., Saltiel A. R. Phenotypic switching of adipose tissue macrophages with obesity is generated by spatiotemporal differences in macrophage subtypes. Diabetes . 2008;57(12):3239–3246. doi: 10.2337/db08-0872. - DOI - PMC - PubMed
    1. Weisberg S. P., McCann D., Desai M., Rosenbaum M., Leibel R. L., Ferrante A. W. Obesity is associated with macrophage accumulation in adipose tissue. Journal of Clinical Investigation . 2003;112(12):1796–1808. doi: 10.1172/JCI200319246. - DOI - PMC - PubMed
    1. Kanda H., Tateya S., Tamori Y., et al. MCP-1 contributes to macrophage infiltration into adipose tissue, insulin resistance, and hepatic steatosis in obesity. Journal of Clinical Investigation . 2006;116(6):1494–1505. doi: 10.1172/JCI26498. - DOI - PMC - PubMed
    1. Holecki M., Zahorska-Markiewicz B., Janowska J., et al. The influence of weight loss on serum osteoprotegerin concentration in obese perimenopausal women. Obesity . 2007;15(8):1925–1929. doi: 10.1038/oby.2007.229. - DOI - PubMed
    1. Secchiero P., Corallini F., Pandolfi A., et al. An increased osteoprotegerin serum release characterizes the early onset of diabetes mellitus and may contribute to endothelial cell dysfunction. The American Journal of Pathology . 2006;169(6):2236–2244. doi: 10.2353/ajpath.2006.060398. - DOI - PMC - PubMed

MeSH terms

LinkOut - more resources