. 2022 Apr 7:13:843202.
doi: 10.3389/fendo.2022.843202. eCollection 2022.

TNF Signaling Acts Downstream of MiR-322/-503 in Regulating DM1 Myogenesis

Affiliations

TNF Signaling Acts Downstream of MiR-322/-503 in Regulating DM1 Myogenesis

Meng Li et al. Front Endocrinol (Lausanne). .

Abstract

Myotonic dystrophy type 1 (DM1) is caused by the expanded CUG repeats and usually displays defective myogenesis. Although we previously reported that ectopic miR-322/-503 expression improved myogenesis in DM1 by targeting the toxic RNA, the underlying pathways regulating myogenesis that were aberrantly altered in DM1 and rescued by miR-322/-503 were still unknown. Here, we constructed DM1 and miR-322/-503 overexpressing DM1 myoblast models, which were subjected to in vitro myoblast differentiation along with their corresponding controls. Agreeing with previous findings, DM1 myoblast showed remarkable myogenesis defects, while miR-322/-503 overexpression successfully rescued the defects. By RNA sequencing, we noticed that Tumor necrosis factor (TNF) signaling was the only pathway that was significantly and oppositely altered in these two experimental sets, with it upregulated in DM1 and inhibited by miR-322/-503 overexpression. Consistently, hyperactivity of TNF signaling was detected in two DM1 mouse models. Blocking TNF signaling significantly rescued the myogenesis defects in DM1. On the contrary, TNF-α treatment abolished the rescue effect of miR-322/-503 on DM1 myogenesis. Taking together, these results implied that TNF signaling mediated the myogenesis defects in DM1 and might act downstream of miR-322/-503 in regulating the myogenesis in DM1. Moreover, the inhibition of TNF signaling benefiting myogenesis in DM1 provided us with a novel therapeutic strategy for DM1.

Keywords: DM1; TNF signaling; miR-322/-503; myoblast; myogenesis.


Conflict of interest statement

The authors declare that the research was conducted in the absence of any commercial or financial relationships that could be construed as a potential conflict of interest.

Figures

Figure 1
Figure 1
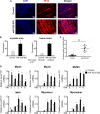
Myogenesis was defective in the DM1 myoblast model. (A) Ribonuclear foci were detected in the DM1 myoblast model, but not in the normal group. RNA FISH with the (CAG)7 probe was performed on the normal and DM1 myoblast models. (B) Schematic diagram of in vitro myoblast differentiation of the normal and DM1 myoblasts. (C) Myotube formation was significantly repressed in the DM1 group. Immunofluorescence staining against MF20 was performed on differentiation day 6. (D) The myotube area and fusion index were significantly decreased in the DM1 group. (E) The mean number of nuclei per fiber was significantly decreased in the DM1 group. (F) The expression of muscle regulatory factors (MyoD, MyoG, Mef2C, and Mrf4) and myoblast fusion genes (Myomixer and Myomaker) was significantly downregulated in the DM1 group. CUG5, the normal group; CUG200; the DM1 group; n≥3; *p < 0.05.
Figure 2
Figure 2
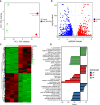
RNA-seq on the differentiating normal and DM1 myoblasts. (A) PCA of the RNA-seq data. There were three replicates for each group. (B) The volcano plot displayed the distribution of DEGs. Red dots represented the significantly upregulated genes and blue dots represent significantly downregulated genes. |log2(Fold Change)| > 1 and adjusted P-value < 0.05 were used as the cut-off value. (C) Heatmap showed the relative levels of DEGs between the normal and DM1 groups. (D) The GO analysis of DEGs. CUG5, the normal group; CUG200, the DM1 group; MF, molecular function; CC, cellular component; and BP, biological process; n=3.
Figure 3
Figure 3
miR-322/-503 rescued myoblast differentiation defects. (A) Ectopic miR-322/-503 expression improved myotube formation in DM1 myoblasts. Immunofluorescence staining against MF20 was performed on differentiation day 6. (B) The myotube area and fusion index were significantly increased with miR-322/-503 overexpression. (C) The mean number of nuclei per fiber was significantly increased with miR-322/-503 overexpression. (D) The expression of muscle regulatory factors (MyoD, MyoG, Mef2C, and Mrf4) and myoblast fusion genes (Myomixer and Myomaker) was significantly upregulated with miR-322/-503 overexpression. Control, control empty vector stably transfected DM1 myoblasts; miR-322/-503, miR-322/-503 overexpressing DM1 myoblasts; n≥3; *, p < 0.05.
Figure 4
Figure 4
RNA-seq on the differentiating control and miR-322/-503 overexpressing DM1 myoblasts. (A) PCA of the RNA-seq data. There were three replicates for each group. (B) The volcano plot displayed the distribution of DEGs. Red dots represented the significantly upregulated genes and blue dots represent significantly downregulated genes. |log2(Fold Change)| > 1 and adjusted P-value < 0.05 were used as the cut-off value. (C) Heatmap showed the relative levels of DEGs between the two groups. (D) The GO analysis of DEGs. Control, control empty vector stably transfected DM1 myoblasts; miR-322/-503, miR-322/-503 overexpressing DM1 myoblasts; MF, molecular function; CC, cellular component; and BP, biological process; n=3.
Figure 5
Figure 5
The TNF signal was tightly associated with DM1 myogenesis. GSEA was performed on the RNA-seq datasets of DM1 versus normal myoblasts and miR-322/-503 overexpression versus control DM1 myoblasts to find their significantly altered pathways, respectively. (A) Venn diagram of the pathways significantly altered in the two RNA-seq sets. (B) A heatmap showing the significance and change trends of the five signaling pathways shared by the two RNA-seq sets. (C, D). The GSEA curves of the TNF signaling pathway in the two RNA-seq sets. (E) A heatmap showing the relative levels of TNF signaling-related genes in the two RNA-seq sets. (F) The relative levels of TNF signaling-related genes in the quadriceps muscles of wild-type, MBNL1 knockout, and HSALR mice. DM1 vs normal, the RNA-seq dataset of DM1 versus normal myoblasts; miR-322/-503 vs control, the RNA-seq dataset of miR-322/-503 overexpression versus control DM1 myoblasts; CUG5, the normal group; CUG200, the DM1 group; Control, control empty vector stably transfected DM1 myoblasts; miR-322/-503, miR-322/-503 overexpressing DM1 myoblasts; n≥3; *, p < 0.05.
Figure 6
Figure 6
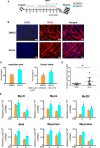
TNF inhibition rescued the DM1 myogenesis defects. (A) 100 nM INH14 (a TNF signaling inhibitor) was added to the DM1 myoblast differentiation to inhibit the TNF signaling from differentiation day 3 to day 6. DMSO was used as a control. (B) The INH14 treatment improved myotube formation in DM1 myoblasts. Immunofluorescence staining against MF20 was performed on differentiation day 6. (C) The myotube area and fusion index were significantly increased with the INH14 treatment. (D) The mean number of nuclei per fiber was significantly increased with the INH14 treatment. (E) The expression of muscle regulatory factors (MyoD, MyoG, Mef2C, and Mrf4) and myoblast fusion genes (Myomixer and Myomaker) was significantly upregulated with the INH14 treatment. DMSO, DMSO treatment control; INH14, INH14 treatment; n≥3; *, p < 0.05.
Figure 7
Figure 7
TNF-α treatment repressed the rescue function of miR-322/-503 on DM1 myogenesis. (A) 50 ng/ml TNF-α was added to the miR-322/-503 overexpressing DM1 myoblast differentiation from differentiation day 3 to day 6. 0.1% BSA was used as a control. (B) The TNF-α treatment impaired myotube formation in miR-322/-503 overexpressing DM1 myoblasts. Immunofluorescence staining against MF20 was performed on differentiation day 6. (C) The myotube area and fusion index were significantly decreased with the TNF-α treatment. (D) The mean number of nuclei per fiber was significantly decreased with the TNF-α treatment. (E) The expression of muscle regulatory factors (MyoD, MyoG, Mef2C, and Mrf4) and myoblast fusion genes (Myomixer and Myomaker) was significantly downregulated with the TNF-α treatment. BSA, BSA treatment control; TNF-α, TNF-α treatment; n≥3; *, p < 0.05.

References

    1. Filippova GN, Thienes CP, Penn BH, Cho DH, Hu YJ, Moore JM, et al. . Ctcf-Binding Sites Flank Ctg/Cag Repeats and Form a Methylation-Sensitive Insulator at the Dm1 Locus. Nat Genet (2001) 28(4):335–43. doi: 10.1038/ng570 - DOI - PubMed
    1. Yin Q, Wang H, Li N, Ding Y, Xie Z, Jin L, et al. . Dosage Effect of Multiple Genes Accounts for Multisystem Disorder of Myotonic Dystrophy Type 1. Cell Res (2020) 30(2):133–45. doi: 10.1038/s41422-019-0264-2 - DOI - PMC - PubMed
    1. Lopez Castel A, Cleary JD, Pearson CE. Repeat Instability as the Basis for Human Diseases and as a Potential Target for Therapy. Nat Rev Mol Cell Biol (2010) 11(3):165–70. doi: 10.1038/nrm2854 - DOI - PubMed
    1. Dean NL, Tan SL, Ao A. Instability in the Transmission of the Myotonic Dystrophy Ctg Repeat in Human Oocytes and Preimplantation Embryos. Fertil Steril (2006) 86(1):98–105. doi: 10.1016/j.fertnstert.2005.12.025 - DOI - PubMed
    1. Chal J, Pourquie O. Making Muscle: Skeletal Myogenesis in Vivo and in Vitro. Development (2017) 144(12):2104–22. doi: 10.1242/dev.151035 - DOI - PubMed