. 2022 Apr 7:13:840890.
doi: 10.3389/fphys.2022.840890. eCollection 2022.

Expression of CCL2, FOS, and JUN May Help to Distinguish Patients With IgA Nephropathy From Healthy Controls

Affiliations

Expression of CCL2, FOS, and JUN May Help to Distinguish Patients With IgA Nephropathy From Healthy Controls

Xue Zhou et al. Front Physiol. .

Abstract

Background: IgA nephropathy (IgAN), the most common type of glomerulonephritis worldwide, can only be diagnosed mainly by renal biopsy owing to lack of effective biomarkers. It is urgent to explore and identify the potential diagnostic biomarkers through assessing the gene expression profiles of patients with IgAN.

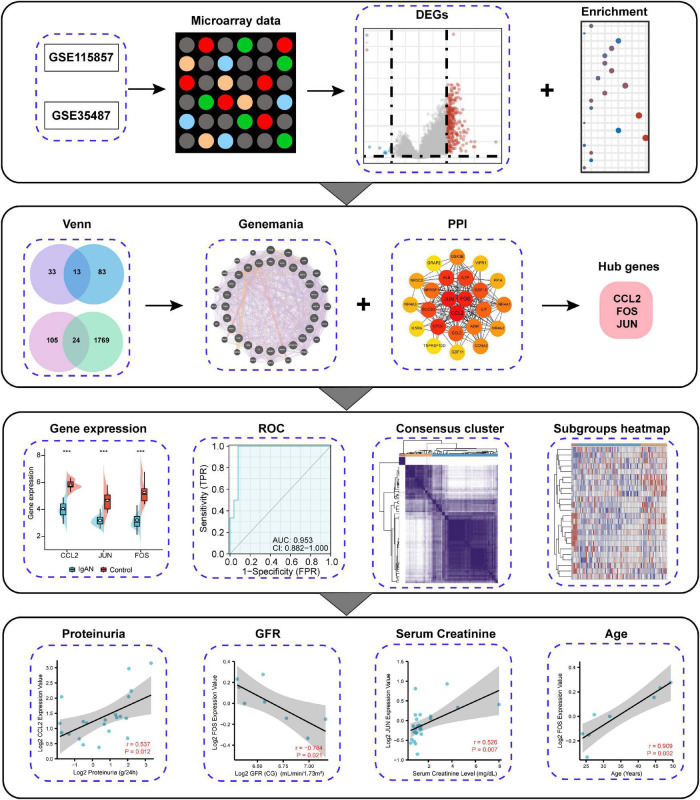
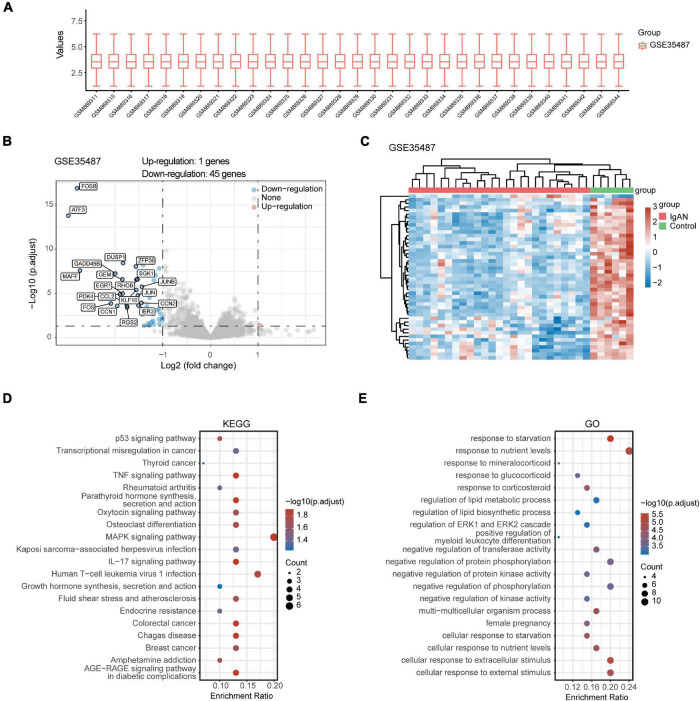
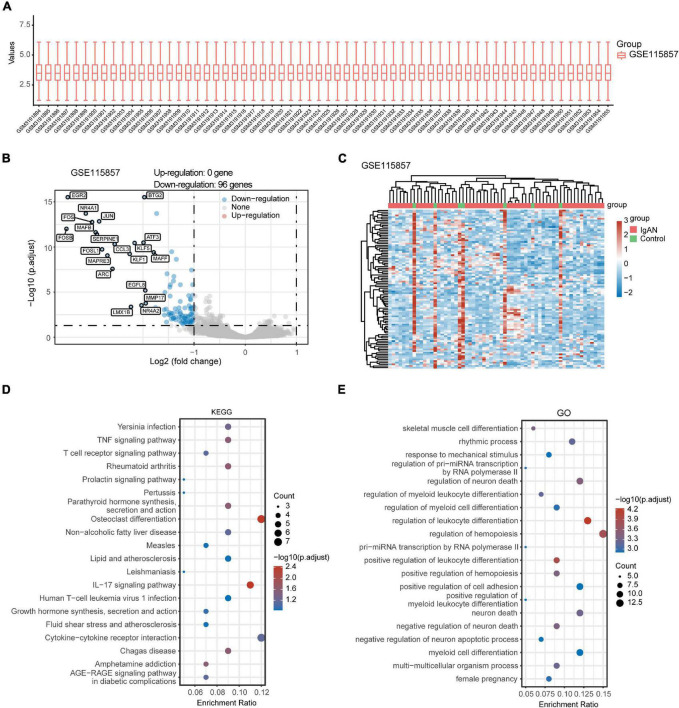
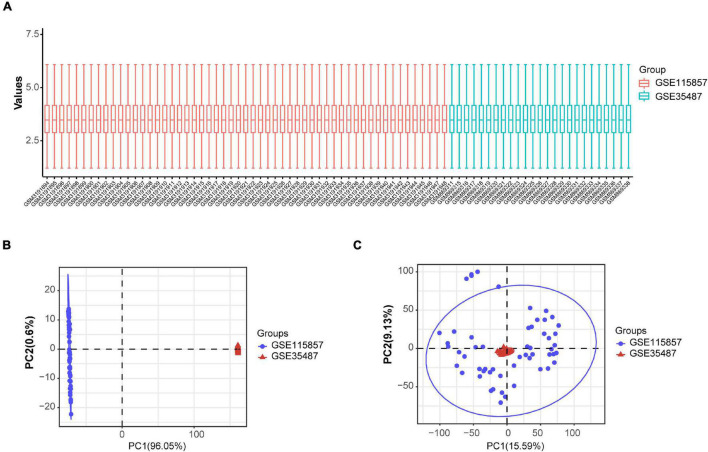
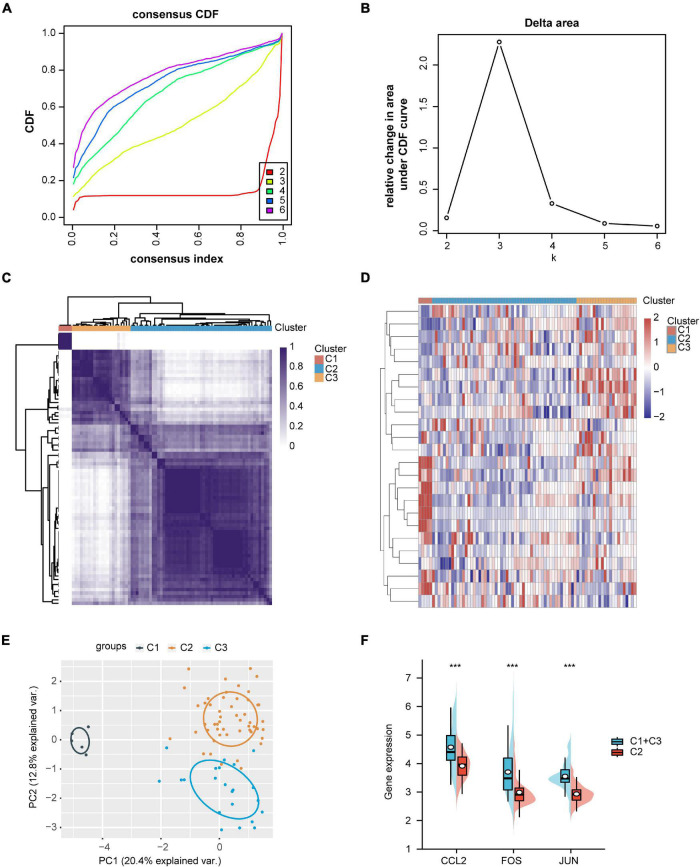
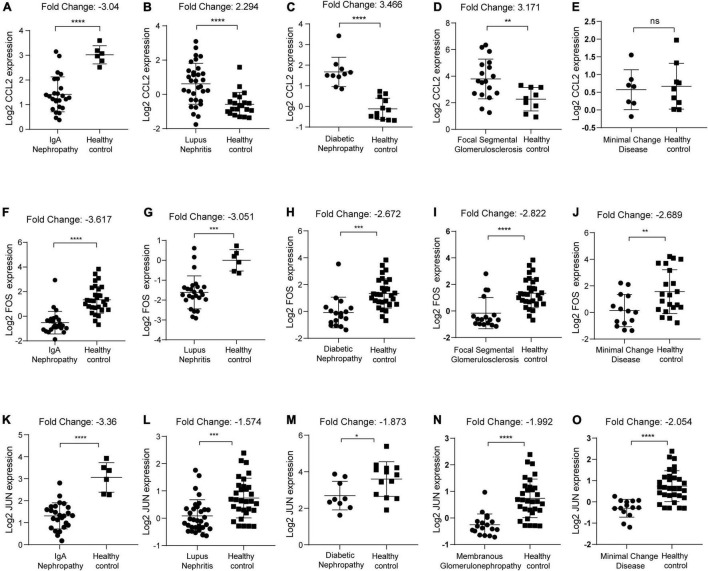
Methods: Two datasets were obtained from the Gene Expression Omnibus (GEO) database, including GSE115857 (55 IgAN, 7 living healthy donors) and GSE35487 (25 IgAN, 6 living healthy donors), then underwent differentially expressed genes (DEGs) and function enrichment analyses utilizing R packages. The common gene list was screened out between DEGs and immune-associated genes by Venn diagram, then performed gene-gene interaction, protein-protein interaction (PPI) and function enrichment analyses. Top three immune-associated hub genes were selected by Maximal Clique Centrality (MCC) method, then the expression and diagnostic value of these hub genes were determined. Consensus clustering algorithm was applied to conduct the unsupervised cluster analysis of the immune-associated hub gene list in IgAN. Finally, the Nephroseq V5 tool was applied to identify the expression level of CCL2, FOS, JUN in kidney diseases, as well as the correlation between CCL2, FOS, JUN expression and renal function in the patients with IgAN.

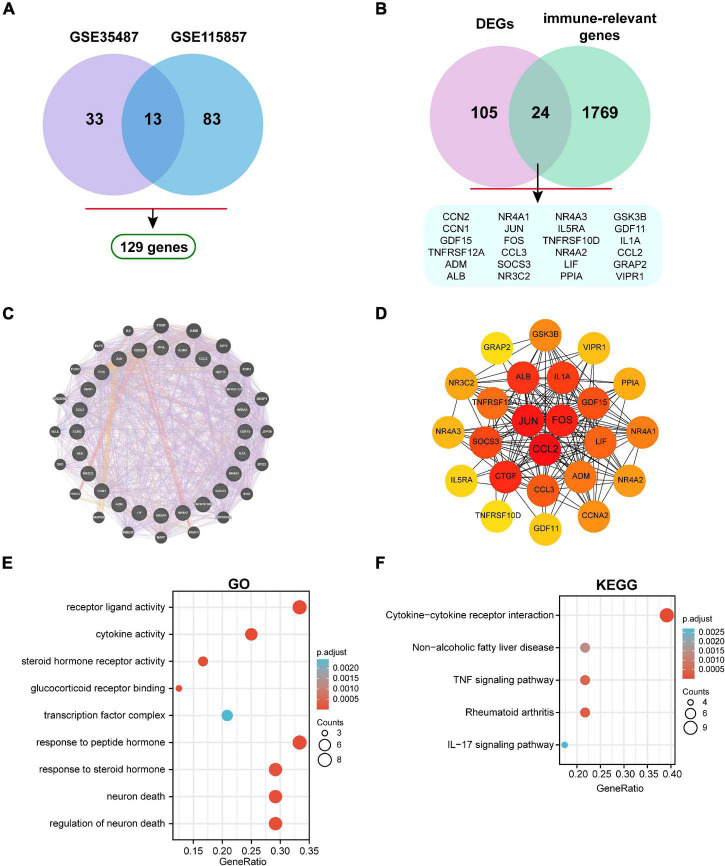
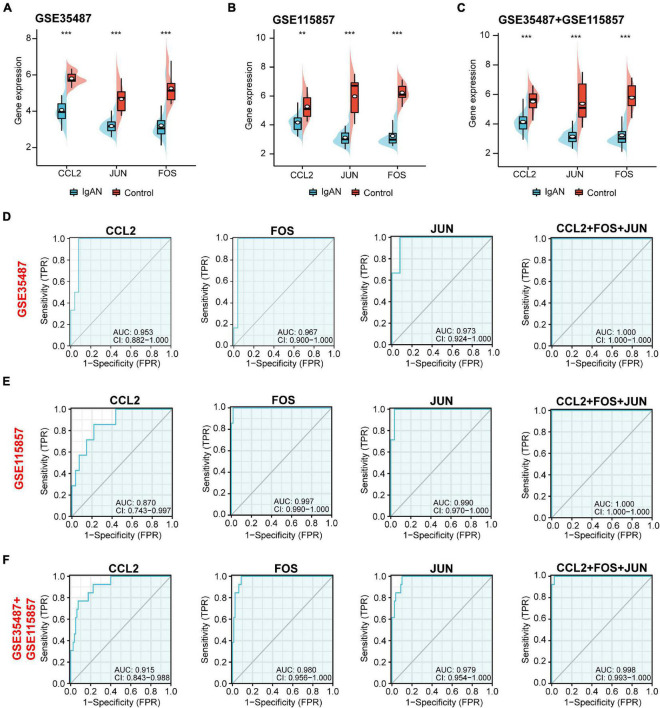
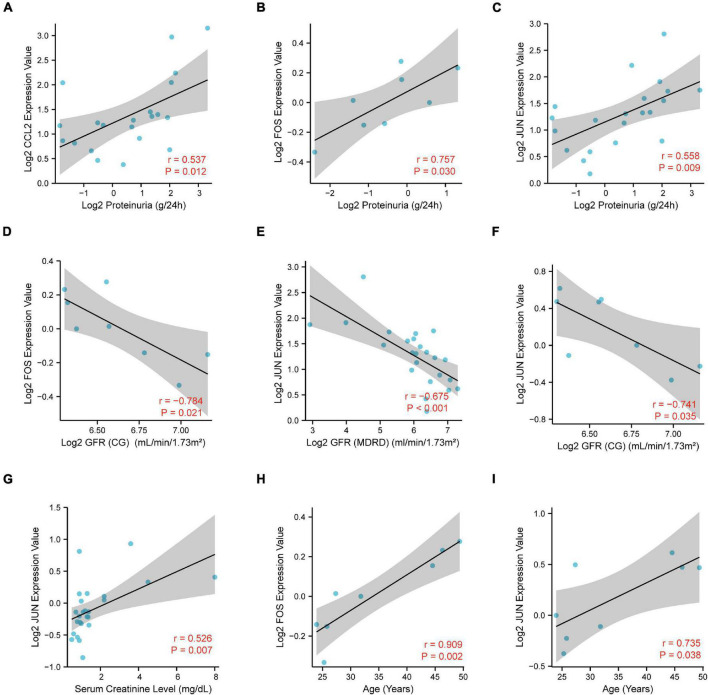
Results: A total of 129 DEGs were obtained through comparing IgAN with healthy controls via the GSE115857 and GSE35487 datasets. Then, we screened out 24 immune-associated IgAN DEGs. CCL2, JUN, and FOS were identified as the top three hub genes, and they were all remarkably downregulated in IgAN. More importantly, CCL2, JUN, and FOS had a high accuracy [area under the curve (AUC) reached almost 1] in predicting IgAN, which could easily distinguish between IgAN patients and healthy individuals. Three distinct subgroups of IgAN were determined based on 24 immune-associated DEGs, with significant differences in the expression of CCL2, JUN, and FOS genes. Finally, CCL2, FOS, JUN were manifested a meaningful association with proteinuria, glomerular filtration rate (GFR), and serum creatinine level.

Conclusion: In summary, our study comprehensively uncovers that CCL2, JUN, and FOS may function as promising biomarkers for diagnosis of IgAN.

Keywords: IgA nephropathy; bioinformatics analysis; biomarker; diagnosis; immune.


Conflict of interest statement

The authors declare that the research was conducted in the absence of any commercial or financial relationships that could be construed as a potential conflict of interest.

Figures

FIGURE 1
FIGURE 1
Schematic diagram of the study design.
FIGURE 2
FIGURE 2
Comprehensive analysis of DEGs and function enrichment in GSE35487. (A) Box plot after data standardization. (B) Volcano plot of DEGs between IgAN patients and healthy controls. (C) Expression heatmap of screened DEGs. (D) KEGG and (E) GO enrichment analysis of DEGs.
FIGURE 3
FIGURE 3
Comprehensive analysis of DEGs and function enrichment in GSE115857. (A) Box plot after data standardization. (B) Volcano plot of DEGs between IgAN patients and healthy controls. (C) Expression heatmap of screened DEGs. (D) KEGG and (E) GO enrichment analysis of DEGs.
FIGURE 4
FIGURE 4
Identification of immune-associated hub genes. (A) Venn diagram of DEGs in GSE35487 and GSE115857. (B) Venn diagram of DEGs and immune-associated gene list. (C) The visualized gene-gene interaction network of immune-associated DEGs. (D) The visualized PPI network of immune-associated DEGs. (E) GO and (F) KEGG enrichment analyses of immune-associated DEGs.
FIGURE 5
FIGURE 5
Gene expression and diagnostic value analysis of the potential biomarkers (CCL2, JUN, and FOS). The expression level of CCL2, JUN, and FOS between IgAN samples and healthy controls in (A) GSE35487, (B) GSE115857, and (C) the combined GSE35487-GSE115857 dataset. The diagnostic value of CCL2, FOS, JUN, and combined CCL2-FOS-JUN according to AUC value in ROC curve based on (D) GSE35487 (AUC = 0.953, AUC = 0.967, AUC = 0.973, and AUC = 1, respectively), (E) GSE115857 (AUC = 0.870, AUC = 0.997, AUC = 0.990, and AUC = 1, respectively), and (F) the combined GSE35487-GSE115857 dataset (AUC = 0.915, AUC = 0.980, AUC = 0.979, and AUC = 0.998, respectively). **p < 0.01 and ***p < 0.001.
FIGURE 6
FIGURE 6
Standardization and batch effect removal for GSE35487 and GSE115857. (A) Box plot after data standardization. (B) PCA results before batch removal for GSE35487 and GSE115857. (C) PCA results after batch removal for GSE35487 and GSE115857.
FIGURE 7
FIGURE 7
Identification of IgAN subgroups and gene expression analysis. (A) Consensus clustering of cumulative distribution function (CDF) for k = 2–6. (B) Elbow plot displays relative change in area under CDF curve. (C) Heatmap depicting consensus clustering solution (k = 3). (D) Heatmap of immune-associated DEGs expression in three subgroups, red represents high expression and blue represents low expression. (E) Principal component analysis (PCA) of three IgAN subgroups. (F) The expression levels of CCL2, FOS, and JUN in the different subgroups of IgAN. ***p < 0.001.
FIGURE 8
FIGURE 8
Identification of CCL2, FOS, JUN expression in kidney diseases with healthy individuals as control. (A–E) CCL2 expression in IgAN, lupus nephritis, diabetic nephropathy, focal segmental glomerulosclerosis, and minimal change disease, respectively. (F–J) FOS expression in IgAN, lupus nephritis, diabetic nephropathy, focal segmental glomerulosclerosis, and minimal change disease, respectively. (K–O) JUN expression in IgAN, lupus nephritis, diabetic nephropathy, membranous glomerulonephropathy, and minimal change disease, respectively. ns, no significance, *p < 0.05, **p < 0.01, ***p < 0.001, and ****p ≤ 0.0001.
FIGURE 9
FIGURE 9
Correlation analysis of CCL2, FOS, JUN expression with the clinicopathological features, including (A–C) proteinuria, (D–F) glomerular filtration rate (GFR), (G) serum creatinine level, and (H,I) age.

References

    1. Amico G. (2000). Natural history of idiopathic IgA nephropathy: role of clinical and histological prognostic factors. Am. J. Kidney Dis. 36 227–237. - PubMed
    1. Anders H. J., Vielhauer V., Schlöndorff D. (2003). Chemokines and chemokine receptors are involved in the resolution or progression of renal disease. Kidney Int. 63 401–415. 10.1046/j.1523-1755.2003.00750.x - DOI - PubMed
    1. Bao H., Hu S., Zhang C., Shi S., Qin W., Zeng C., et al. (2014). Inhibition of miRNA-21 prevents fibrogenic activation in podocytes and tubular cells in IgA nephropathy. Biochem. Biophys. Res. Commun. 444 455–460. - PubMed
    1. Cao W., Xu J., Zhou Z. M., Wang G. B., Hou F. F., Nie J. (2013). Advanced oxidation protein products activate intrarenal renin-angiotensin system via a CD36-mediated, redox-dependent pathway. Antioxid. Redox Signal. 18 19–35. - PMC - PubMed
    1. Coppo R. (2017). Biomarkers and targeted new therapies for IgA nephropathy. Pediatr. Nephrol. 32 725–731. 10.1007/s00467-016-3390-9 - DOI - PubMed