. 2022 Apr 8:16:851432.
doi: 10.3389/fnana.2022.851432. eCollection 2022.

Phenotype and Distribution of Immature Neurons in the Human Cerebral Cortex Layer II

Affiliations

Phenotype and Distribution of Immature Neurons in the Human Cerebral Cortex Layer II

Simona Coviello et al. Front Neuroanat. .

Abstract

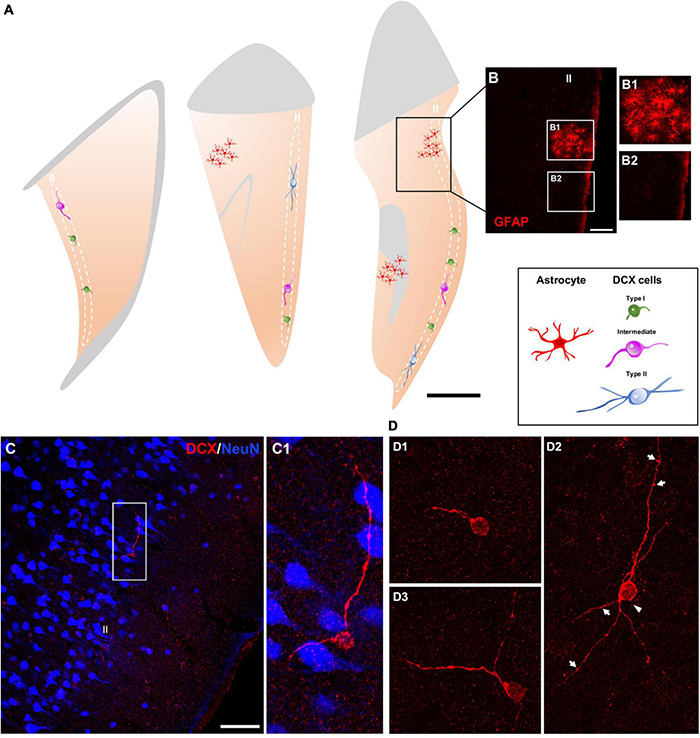
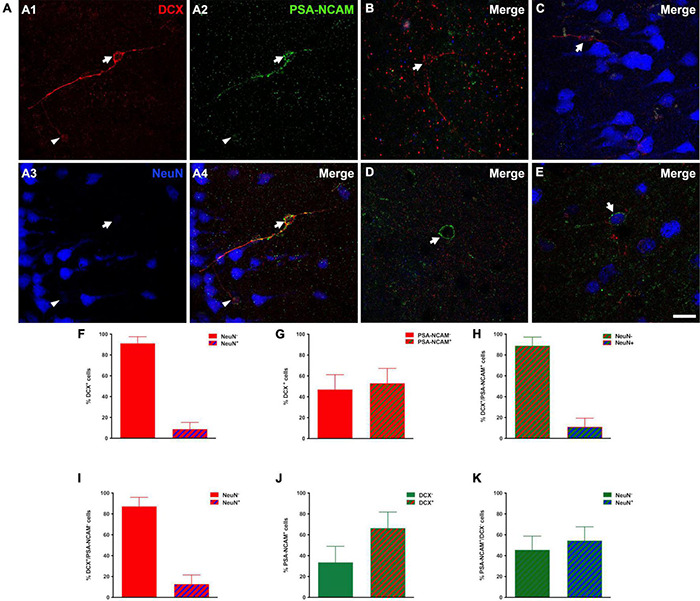
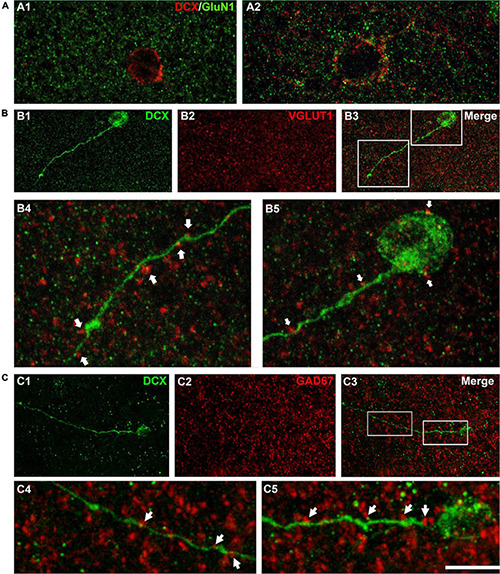
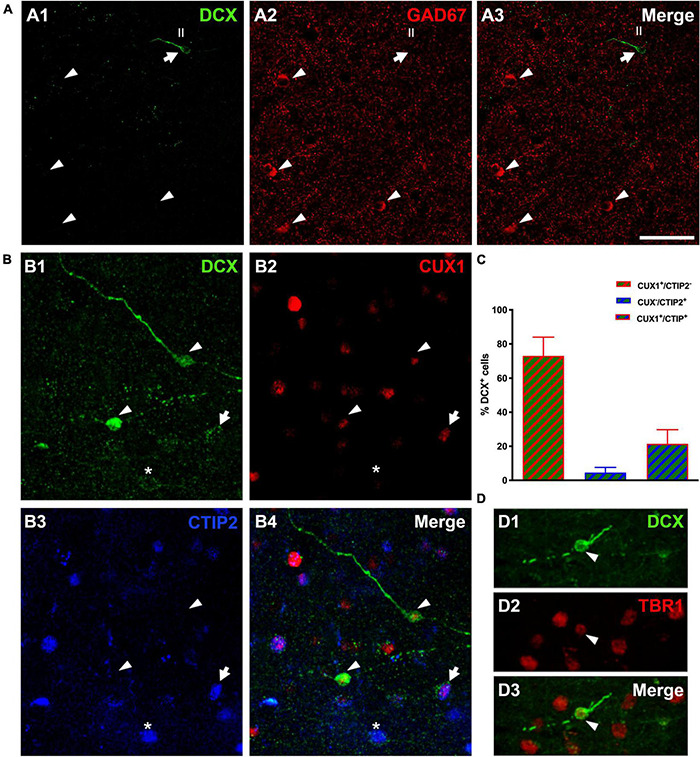
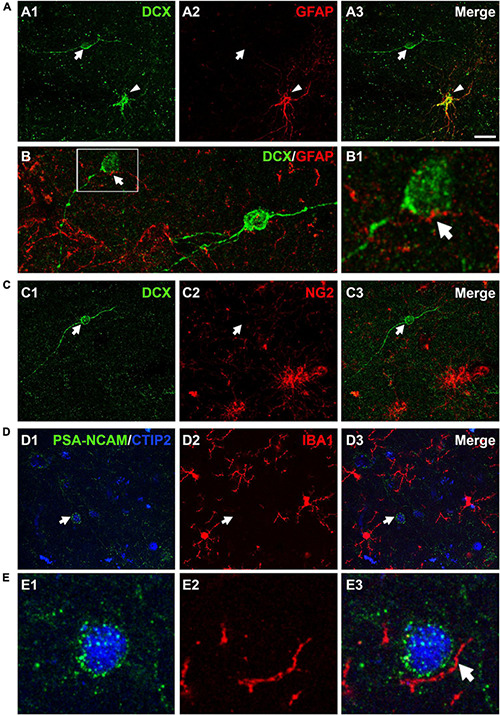
This work provides evidence of the presence of immature neurons in the human brain, specifically in the layer II of the cerebral cortex. Using surgical samples from epileptic patients and post-mortem tissue, we have found cells with different levels of dendritic complexity (type I and type II cells) expressing DCX and PSA-NCAM and lacking expression of the mature neuronal marker NeuN. These immature cells belonged to the excitatory lineage, as demonstrated both by the expression of CUX1, CTIP2, and TBR1 transcription factors and by the lack of the inhibitory marker GAD67. The type II cells had some puncta expressing inhibitory and excitatory synaptic markers apposed to their perisomatic and peridendritic regions and ultrastructural analysis suggest the presence of synaptic contacts. These cells did not present glial cell markers, although astroglial and microglial processes were found in close apposition to their somata and dendrites, particularly on type I cells. Our findings confirm the presence of immature neurons in several regions of the cerebral cortex of humans of different ages and define their lineage. The presence of some mature features in some of these cells suggests the possibility of a progressively integration as excitatory neurons, as described in the olfactory cortex of rodents.

Keywords: cerebral cortex; doublecortin; human brain; immature neurons; neurogenesis.


Conflict of interest statement

The authors declare that the research was conducted in the absence of any commercial or financial relationships that could be construed as a potential conflict of interest.

Figures

FIGURE 1
FIGURE 1
Distribution and morphology of DCX expressing cells in the human cerebral cortex layer II. (A) Schemes of 3 representative 50 μm coronal sections of temporal cortex, showing areas with reactive astrogliosis (red) and DCX immunoreactive cells in the layer II displaying different morphologies (type I, green; intermediate, magenta; type II, blue). (B) Confocal image of the squared area in (A), showing GFAP immunofluorescence. (B1,B2) Are higher magnifications of the squared areas in (B) showing regions with (B1) or without (B2) reactive astrocytes. (C) Double-immunofluorescence for DCX (red) and NeuN (blue) in the temporal cortex. Note a DCX + cell with its soma located in the layer II and lacking a NeuN immunoreactive nucleus. NeuN immunohistochemistry was used to define the six-layered cerebral cortex. (C1) Is a higher magnification of the squared area in (C). (D) 2D projections of confocal stacks (5 confocal planes separated by 1 μm) showing DCX expressing cells: type I (D1), type II (D2), and intermediate (D3). A thin process resembling an axon (arrowhead) and sparse protrusions similar to stubby dendritic spines (arrows) can be observed in the type II cell shown in figure (D2). In (A) white and gray matters are indicated with gray and light-orange colors, respectively. Scale bars: 30 mm for (A); 70 μm for (B); 35 μM for (B1,2); 70 μm for (C); 20 μm for (C1); 30 μm for (D1–3). All schemes and confocal images in this figure were from neurosurgical samples.
FIGURE 2
FIGURE 2
Immature phenotype of DCX immunoreactive cells in the human cerebral cortex layer II. (A–E) Triple-immunofluorescence for DCX (red), PSA-NCAM (green) and NeuN (blue) in the layer II of the occipital lobe. (A1–4) Cells colocalizing DCX and PSA-NCAM and lacking NeuN immunoreactivity in their nuclei. Note the presence of a large (type II) DCX + /PSA-NCAM + cell (arrow) and a smaller one (type I, arrowhead). (B) DCX positive type II cell lacking PSA-NCAM and NeuN expression. (C) Type II cell expressing DCX and NeuN and lacking PSA-NCAM immunoreactivity. (D) PSA-NCAM positive cell lacking DCX and NeuN expression. (E) Cell immunoreactive for PSA-NCAM and NeuN and lacking DCX expression. (F,G) Graphs showing the percentage of DCX + cells displaying NeuN immunoreactive nuclei (F) or co-expressing PSA-NCAM (G). (H) Graph showing the percentage of DCX + /PSA-NCAM + cells displaying a NeuN + nucleus. (I) Graph showing the percentage of PSA-NCAM + /DCX- cells displaying a NeuN immunoreactive nucleus (J) Graph showing the percentage of PSA-NCAM + co-expressing DCX. (K) Graph showing the percentage of PSA-NCAM + /DCX- cells displaying a NeuN immunoreactive nucleus. Error bars represent the mean ± SEM. The images are 2D projections of 5 consecutive confocal stacks (1 μm apart). Scale bar: (A–C) 30 μm, (D,E) 20 μm. All confocal images in this figure were from neurosurgical samples.
FIGURE 3
FIGURE 3
Expression of NMDA receptors (GluN1) and apposed puncta expressing VGLUT1 and GAD67 on DCX immunoreactive cells. (A) Confocal microphotographs of the temporal cortex showing the expression of GluN1 in small type I (A1) and larger type I DCX + cells (A2). (B) DCX immunoreactive type II cell (green) in the occipital cortex layer II showing puncta expressing the excitatory marker VGLUT1 (red) apposed to its soma and dendrite (arrows). (C) DCX immunoreactive type II cell (green) in the temporal cortex layer II. Note the presence of GAD67 expressing puncta (red) apposed to its soma and dendrite (arrows). (A1) Is a single confocal plane, (A2,B,C) are 2D projections of 4 (A2) 9 (B) and 12 (C) consecutive confocal stacks (0.38 μm apart). Scale bar: 10 μm for (A,B4,B5,C4,C5); 40 μm for (B1–3,C1–3). All confocal images in this figure were from neurosurgical samples.
FIGURE 4
FIGURE 4
Lineage of immature neurons in the human cerebral cortex layer II. (A) Panoramic view of 2D projections (10 consecutive confocal stacks, 1 μm apart) showing the lack of co-localization between DCX (green) and GAD-67 positive cells (red). Note a single DCX large type I immunopositive cell (arrow) in the temporal cortex layer II, lacking GAD67 expression in its soma. GAD-67 immunoreactive cells (arrowheads) can be detected in the deeper layers of the cortex. (B) DCX + type II cells (green) co-expressing CUX1 (red, arrowheads), CTIP2 (blue, asterisk) or both transcription factors (arrow). (C) Graph showing the percentage of DCX cells expressing each transcription factor. Error bars represent the mean with ± SEM. (D) Immunofluorescence staining for DCX (green) and transcription factor TBR1 (red); arrowhead points to a type II cell co-expressing both markers. Images are 2D projections of 10 (A,B) and 15 (D) consecutive confocal stacks (1 μm apart). Scale bar: 50 μm for (A), 25 μm for (B); 10 μm for (D). All confocal images in this figure were from neurosurgical samples.
FIGURE 5
FIGURE 5
Expression of glial cell markers in the immature neurons of the human cerebral cortex layer II. (A) Double DCX (green) and GFAP (red) immunohistochemistry. Arrow points to a type II DCX immunopositive cell devoid of GFAP expression. Arrowhead indicates a DCX/GFAP double labeled cell. (B) Confocal reconstruction of a type II DCX immunoreactive cell (green) contacted by different astroglial processes (red). (B1) Depicts a higher magnification view of the squared area in (B), in which the arrow indicates a GFAP immunopositive process closely apposed to the DCX + soma. (C) DCX immunopositive type II cell (green, arrow) devoid of NG2 expression (red, arrow). Note the presence of 2 NG2 immunoreactive cells lacking DCX expression in the lower portion of the figure. (D) No co-localization was observed between a PSA-NCAM + /CTIP-2 + double labeled neuron (arrow) and IBA1 immunopositive cells (red). The transcription factor CTIP2 was used to confirm the excitatory phenotype of PSA-NCAM immunoreactive neurons in layer II. (E) High magnification view showing an IBA1 + process (arrow) closely apposed to the soma of a PSA-NCAM expressing cell. All images are 2D projections of 15 confocal stacks (1μm apart). Scale bar: 30 μm for (A,C,D); 10 μm for (B); 5 μm for (B1) and 6 μm for (E). All confocal images in this figure were from neurosurgical samples.

Similar articles

Cited by

References

    1. Alonso-Nanclares L., Defelipe J. (2005). Vesicular glutamate transporter 1 immunostaining in the normal and epileptic human cerebral cortex. Neuroscience 134 59–68. 10.1016/j.neuroscience.2005.03.038 - DOI - PubMed
    1. Benedetti B., Dannehl D., König R., Coviello S., Kreutzer C., Zaunmair P., et al. (2020). Functional integration of neuronal precursors in the adult murine piriform cortex. Cereb. Cortex 30 1499–1515. 10.1093/cercor/bhz181 - DOI - PMC - PubMed
    1. Bloch J., Kaeser M., Sadeghi Y., Rouiller E. M., Redmond D. E., Brunet J.-F. (2011). Doublecortin-positive cells in the adult primate cerebral cortex and possible role in brain plasticity and development. J. Comp. Neurol. 519 775–789. 10.1002/cne.22547 - DOI - PubMed
    1. Boekhoorn K., Joels M., Lucassen P. J. (2006). Increased proliferation reflects glial and vascular-associated changes, but not neurogenesis in the presenile Alzheimer hippocampus. Neurobiol. Dis. 24 1–14. 10.1016/j.nbd.2006.04.017 - DOI - PubMed
    1. Bolós M., Terreros-Roncal J., Perea J. R., Pallas-Bazarra N., Ávila J., Llorens-Martín M. (2019). Maturation dynamics of the axon initial segment (AIS) of newborn dentate granule cells in young adult C57BL/6J mice. J. Neurosci. 39 1605–1620. 10.1523/JNEUROSCI.2253-18.2019 - DOI - PMC - PubMed