. 2022 Apr 7:16:832961.
doi: 10.3389/fnins.2022.832961. eCollection 2022.

Loss of Function of the Neural Cell Adhesion Molecule NrCAM Regulates Differentiation, Proliferation and Neurogenesis in Early Postnatal Hypothalamic Tanycytes

Affiliations

Loss of Function of the Neural Cell Adhesion Molecule NrCAM Regulates Differentiation, Proliferation and Neurogenesis in Early Postnatal Hypothalamic Tanycytes

Alex Moore et al. Front Neurosci. .

Abstract

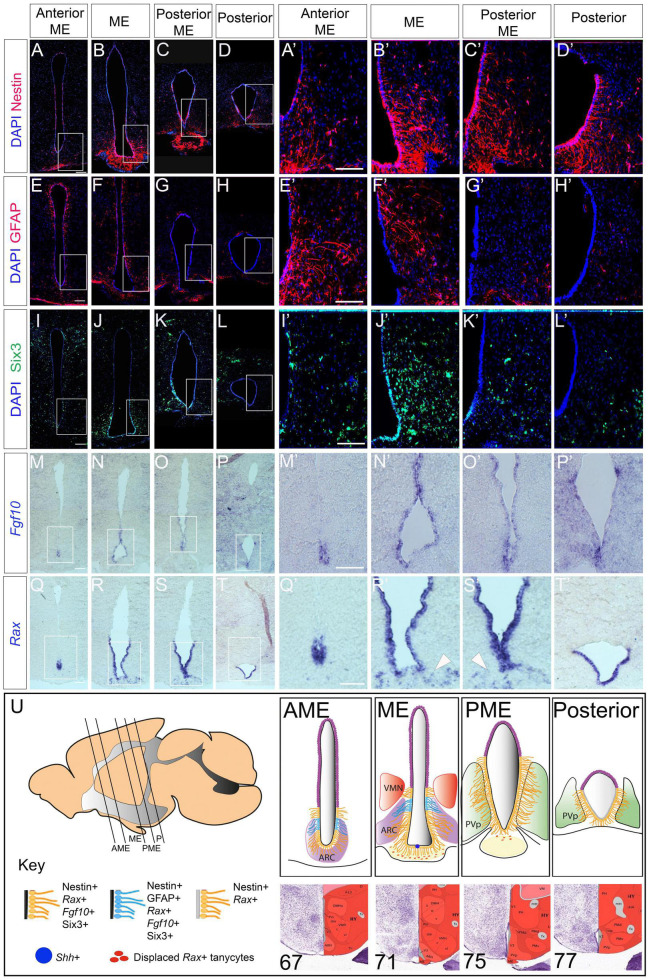
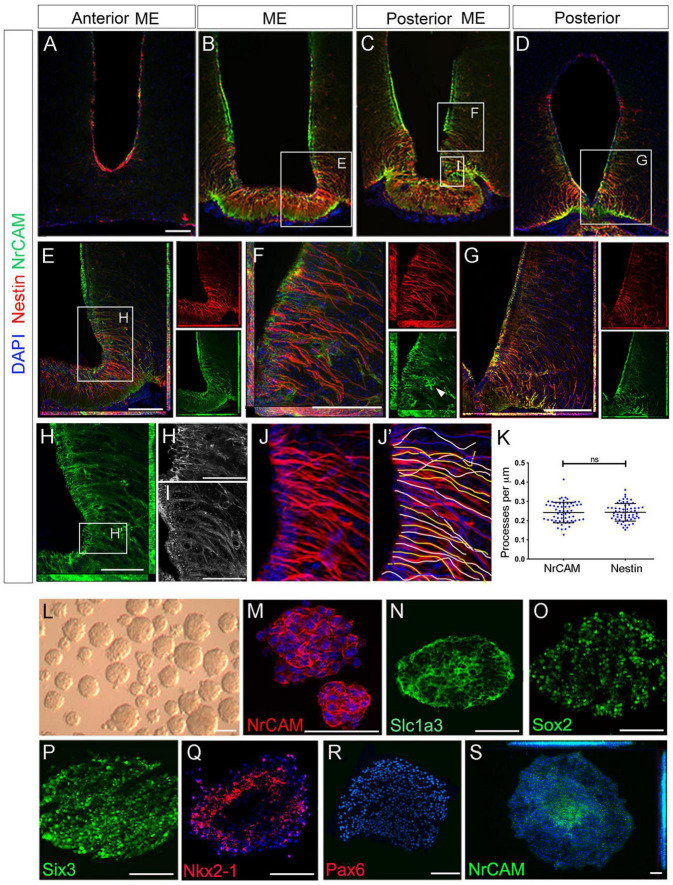
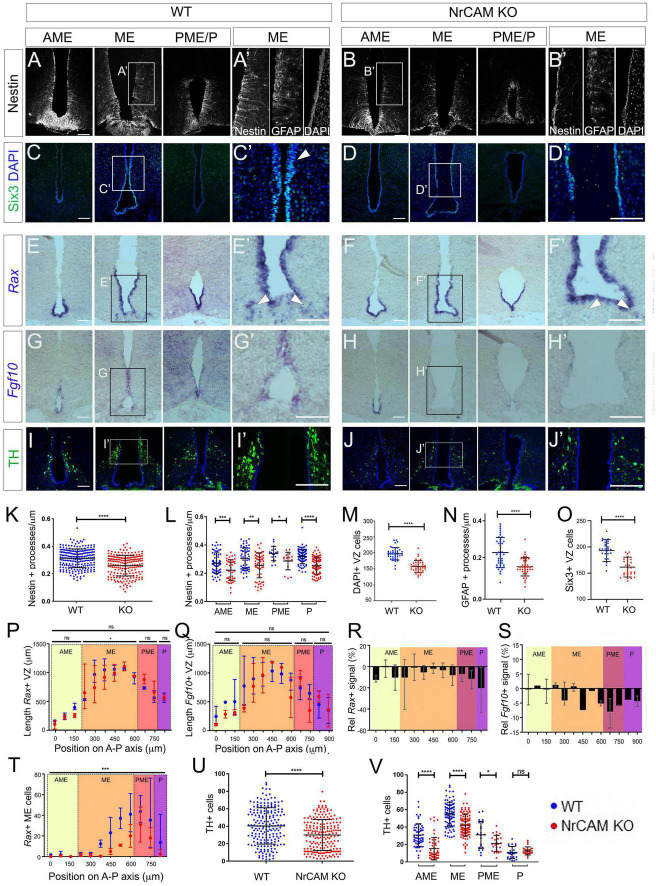
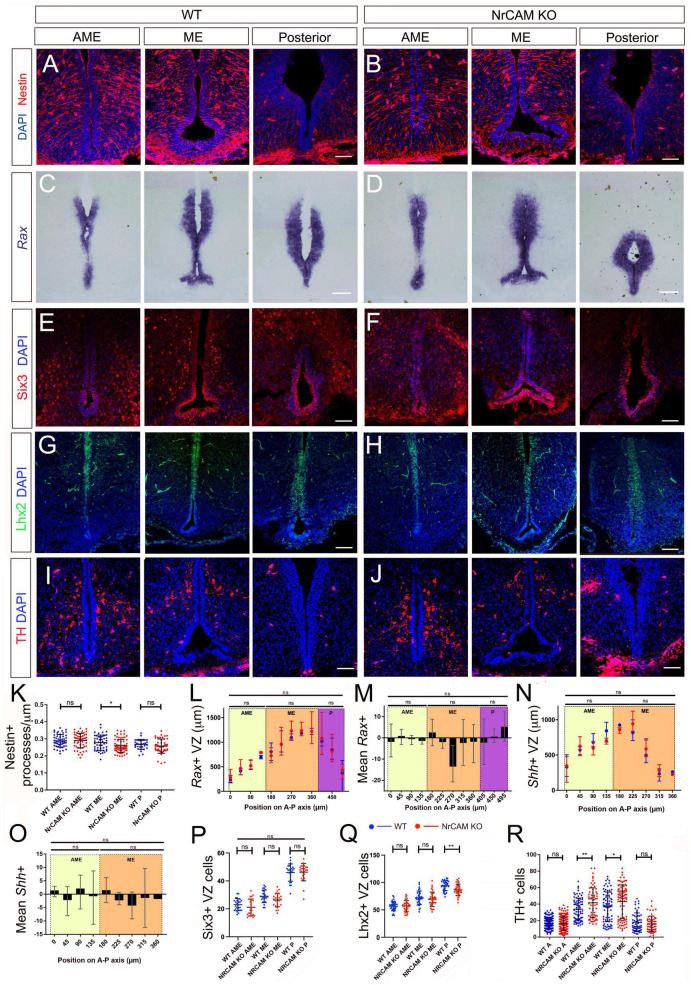
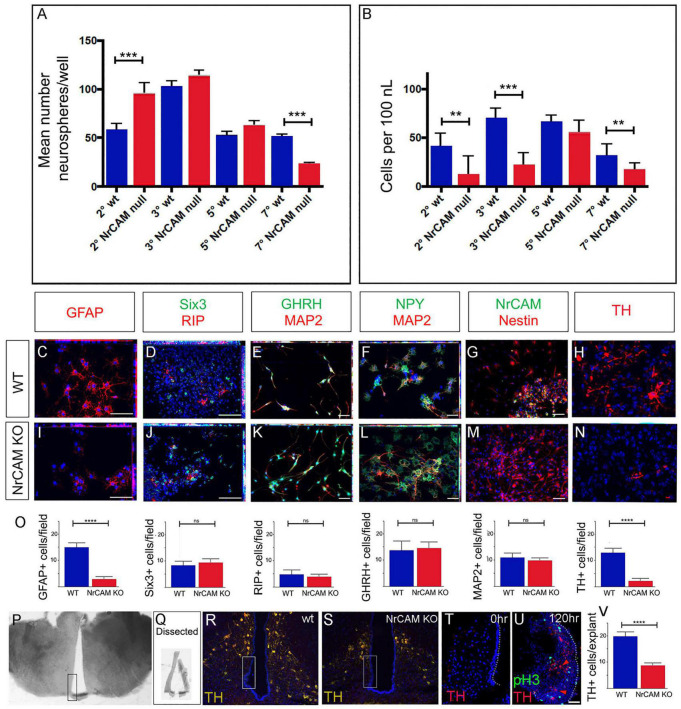
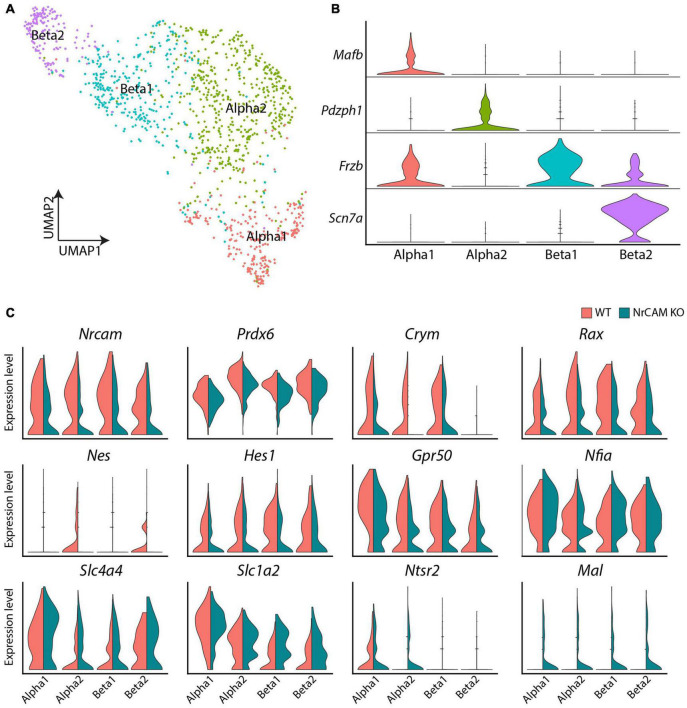
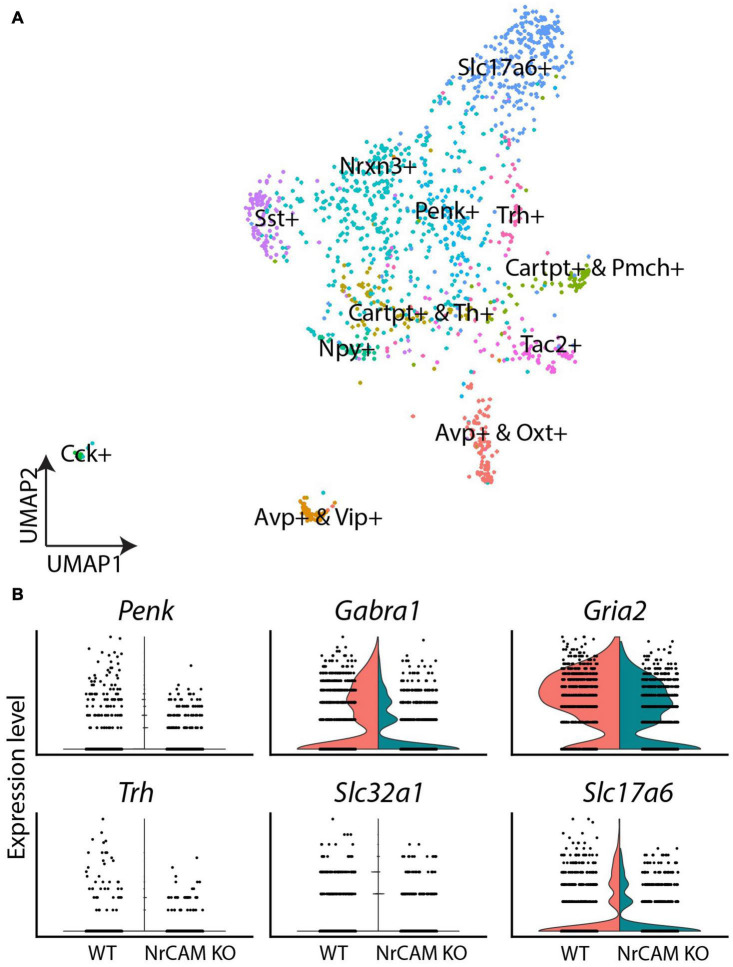
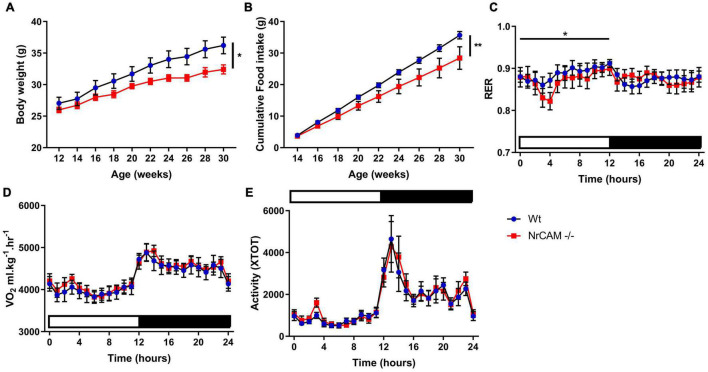
Hypothalamic tanycytes are neural stem and progenitor cells, but little is known of how they are regulated. Here we provide evidence that the cell adhesion molecule, NrCAM, regulates tanycytes in the adult niche. NrCAM is strongly expressed in adult mouse tanycytes. Immunohistochemical and in situ hybridization analysis revealed that NrCAM loss of function leads to both a reduced number of tanycytes and reduced expression of tanycyte-specific cell markers, along with a small reduction in tyrosine hydroxylase-positive arcuate neurons. Similar analyses of NrCAM mutants at E16 identify few changes in gene expression or cell composition, indicating that NrCAM regulates tanycytes, rather than early embryonic hypothalamic development. Neurosphere and organotypic assays support the idea that NrCAM governs cellular homeostasis. Single-cell RNA sequencing (scRNA-Seq) shows that tanycyte-specific genes, including a number that are implicated in thyroid hormone metabolism, show reduced expression in the mutant mouse. However, the mild tanycyte depletion and loss of markers observed in NrCAM-deficient mice were associated with only a subtle metabolic phenotype.

Keywords: NrCAM; astrocytes; hypothalamus; neural cell adhesion molecules; neurogenesis; radial glia; scRNA seq; tanycyte.


Conflict of interest statement

The authors declare that the research was conducted in the absence of any commercial or financial relationships that could be construed as a potential conflict of interest.

Figures

FIGURE 1
FIGURE 1
Stem and progenitor marker distribution in the adult hypothalamus. (A–L′) Representative examples from consecutive coronal sections, from anterior to posterior, at the level of the AME, ME, PME and posterior tanycyte-rich hypothalamus; serial adjacent sections analyzed for expression of Nestin, GFAP and Six3. Boxed regions in panels (A–D,E–H,I–L) shown at high power in panels (A′–D′,E′–H′,I′–L′) (n = 5 mice; images from a single mouse). (M–T′) Representative examples from consecutive coronal sections across the AME, ME, PME and posterior tanycyte-rich hypothalamus; serial adjacent sections analyzed for expression of Fgf10 and Rax. Boxed regions in panels (M–P,Q–T) shown at high power in panels (M′–P′,Q′–T′). Arrowheads in panels (R′,S′) point to Rax-expressing displaced tanycytes (n = 3 mice; images from a single mouse). (U) Schematics showing tanycyte heterogeneity along the A-P axis. Sagittal schematic shows approximate section planes and positions of tanycytes in AME, ME, PME and posterior regions. Coronal schematics show extent of tanycytes of different character along the A-P axis. See key for details. Positions of the AME, ME, PME and posterior were judged relative to sections in the ABRA, based on morphology and position of key nuclei: specific numbered sections from the ABRA are shown below each schematic. Scale bar: 100 μm. ARC, arcuate nucleus; AME, anterior to median eminence; ME, median eminence, PME, posterior median eminence; P, posterior tanycyte-rich hypothalamus; PvP, periventricular nucleus, posterior part; VMN, ventromedial nucleus.
FIGURE 2
FIGURE 2
NrCAM is expressed on self-renewing hypothalamic tanycytes. (A–D) Consecutive coronal sections at the level of the AME, ME, PME and posterior tanycyte-rich hypothalamus, from a single mouse, double-labeled to detect expression of Nestin and NrCAM. (E–G) High power views of boxed regions in panels (B–D) shown as double or single channel views. Arrowhead in panel (F) (single channel green) points to an NrCAM-positive astrocyte. (H) High power view of boxed region in panel (E). Single channel view shows NrCAM labeling. Panel (H′) shows high power view of boxed region in panel (H) showing high expression of NrCAM on tanycyte cell bodies. (I) High power view of boxed region in panel (C) shows NrCAM labeling appears fasciculated on tanycytes. (J–K) Quantification of Nestin and NrCAM-positive process density. Sections through the hypothalamus were imaged at 40x (J) and individual tanycytes traced (J′). Quantitative analysis (K) shows no significant difference across the entire hypothalamus (p < 0.0001; unpaired t-test) (n = 3 mice). (L–S) 7th passage neurospheres derived from VZ around 3V, analyzed in brightfield (L) or after immunohistochemical analyses (M–S) after culture under non-differentiation (M–R) or differentiation (S) conditions (n = 15–20 neurospheres/condition). Scale bars: (A–H) 100 μm; (H′,I) 45 μm; (M–S) 50 μm.
FIGURE 3
FIGURE 3
Reduced tanycytes and tyrosine hydroxylase (TH) neurons in the NrCAM KO adult. (A–J) Representative coronal sections through AME, ME and PME/P regions of the hypothalamus of wild-type (A,C,E,G,I) or NrCAM KO mice (B,D,F,H,J). Panels (A′–J′) show high power views of boxed regions in panels (A–J). Sections were immunolabeled to detect Nestin (A,B), Six3 (C,D), TH (I,J), or GFAP [(A′,B′): consecutive section to that analyzed for Nestin], or were analyzed by in situ hybridization to detect Rax (E,F) or Fgf10 (G,H). Arrowheads in panels (C′,D′) point to Six3-positive VZ cells and in panels (E′,F′) point to Rax-positive displaced tanycyte cells [total of n = 11 mice/genotype analyzed for Nestin and GFAP (n = 3), TH (n = 3); Rax and Fgf10 (n = 3); Six3 (n = 2)]; images in panels (E,G) show serial adjacent sections through a single mouse. Scale bars: 100 μm. (K–V) Quantitative analyses in wild-type and NrCAM KO mice. (K,L) There is a significant reduction in Nestin-positive β1- and α2-tanycyte density in NrCAM KO mice across the entire hypothalamus (K) (p < 0.0001; unpaired t-test) and across each subregion (L) (AME p = 0.0007; ME p = 0.0013; PME p = 0.0105; p < 0.0001; unpaired t-test) (n = 3 mice/genotype). (M–O) There is a significant reduction in the number of cells lining the VZ (M) (p < 0.0001; unpaired t-test; n = 3 mice/genotype), in GFAP-positive tanycyte density (N) (p < 0.0001; unpaired t-test; n = 3 mice/genotype), and in Six3-positive nuclei in NrCAM KO mice (O) (p < 0.0001; unpaired t-test; n = 2 mice/genotype). (P–T) Quantitative analyses of Rax and Fgf10. Analysis was performed at 75 μm intervals across AME, ME, PME and P subregions in 3 mice/genotype. Each plotted value is the mean of the three biological replicates; bars show range. (P,Q) Lengths of Rax- and Fgf10-expressing domains in wild-type (blue) and NrCAM KO (red) mice and (R,S) percentage change in Rax and Fgf10 signal strength in NrCAM KO relative to wild-type. Rax-expressing VZ was significantly longer in the ME subregion of wild-type mice (P) (Wilcoxon signed rank test; p = 0.0273). Relative intensity of Rax and Fgf10 was reduced in NrCAM KO compared to wild-type mice at most levels (R,S). (T) Significantly fewer Rax-positive displaced tancytes were observed in the NrCAM KO compared to wild-type mice (Wilcoxon signed rank test; p = 0.0010). (U,V) There is a significant reduction in TH-positive cells in NrCAM KO mice across the entire hypothalamus (U) (p < 0.0001; unpaired t-test with Welch’s correction) and across subregions (V) (AME p < 0.0001; ME p < 0.0001; PME p = 0.0158; unpaired t-test with Welch’s correction). No significant difference was seen in the P subregion where ARC TH-positive cells are least populous (p = 0.2865). Each icon in each plot represents a single measurement (30 sections analyzed/mouse/genotype for Nestin and TH; 6–7 sections analyzed/mouse for Six3, GFAP, Rax and Fgf10). Bars in each plot show SD. Statistical significance denoted in charts by asterisks: *p < 0.05, **p < 0.01, ***p < 0.001, ****p < 0.0001.
FIGURE 4
FIGURE 4
Comparison of tanycytes and TH neurons in the embryo. (A–H) Representative serial coronal sections through AME, ME and posterior regions of the hypothalamus of E16 wild-type (A,C,E,G) or NrCAM KO mice (B,D,F,H) analyzed by immunohistochemistry to detect Nestin (A,B), Six3 (E,F), Lhx2 (G,H), or by chromogenic in situ hybridization to detect Rax (C,D) (n = 8 mice/genotype, analyzed for Nestin (n = 3), Six3 (n = 2), Lhx2 (n = 3) or Rax (n = 3). (I,J) Representative serial coronal sections through AME, ME and posterior regions of the hypothalamus of E18 wild-type (I) or NrCAM KO mice (J) analyzed by immunohistochemistry to detect TH (n = 3 mice/genotype). Scale bars: 100 μm. (K–R) Quantitative analyses in wild-type and NrCAM KO mice. (K) There is only a small reduction in Nestin-positive β1- and α2-tanycyte density in NrCAM KO mice across the ME region (p < 0.0200; unpaired t-test). Each icon represents a single measurement (n = 3 mice/genotype). Bars show SD. (L–P) There is no significant reduction in the lengths or relative intensities of Rax- and Shh-expressing domain (n = 3 mice/genotype), nor in the number of Six3 + VZ cells in wild-type (blue) and NrCAM KO (red) mice (n = 2 mice/genotype). Bars in panels (L,N) show mean and range; in panels (P–R) each icon represents a single measurement; bars show SD. (Q) There is only a small reduction in the number of Lhx2 + VZ cells in NrCAM KO mice across the posterior region (p = 0.002; unpaired t-test) (n = 3 mice/genotype). (R) There is a small increase in TH-positive cells in NrCAM KO mice in the ME/AME (AME p = 0.0044; ME p = 0.0390) (n = 3 mice/genotype). Statistical significance denoted in charts by asterisks: *p < 0.05, **p < 0.01.
FIGURE 5
FIGURE 5
Decreased proliferation/differentiation of NrCAM-derived VZ/SVZ tissues. (A) Average number neurospheres/well number in wild-type and NrCAM KO mice. The number of neurospheres from NrCAM null mice is significantly increased at passage 2 (p = 0.0006) and is significantly decreased at passage 7 (p ≤ 0.0001). Error bars show SE (n = 6–12 wells; 3 mice each). (B) The number of cells per ml cultured from wild type and NrCAM KO mice (calculated by dissociation of neurospheres from 12 wells). Neurospheres from NrCAM KO have a reduced number of cells per ml than wild type at passage 2, 3 and 7. Error bars show SE. (C–O) Fields of view (C–N) of neurospheres from passage 6, subject to differentiation conditions and analyzed by immunohistochemistry after 7 days (C–G,I–M) or 14 days (H,N). Neurospheres from wild-type (C–H) and NrCAM KO littermates (I–N) show a similar range of differentiated cells. Quantitative analyses (O) show significantly fewer GFAP-positive astrocytes (unpaired t-test, p < 0.0001) and significantly fewer TH-positive neurons (unpaired t-test, p < 0.0001) (n = 5 neurospheres analyzed from each of 3 replicates; 30 fields of view total). (P–V) Dissection and culture of 10 week hypothalamic tanycytes. (P) A 100 μm thick slice through the region of the ME. Boxed region shows dissected area. (Q) Examples of dissected hypothalamic VZ. (R,S) Boxed regions show approximate position of dissected VZ in wild-type and NrCAM KO mice. (T) Representative example of a 15 μm section through a VZ explant at t = 0 h, immunolabeled with anti-TH. No TH-positive cells are detected. (U) Representative example of a 15 μm section through a VZ explant at t = 120 h, immunolabeled with anti-TH and anti-phosH3. (U) Quantitative analyses show significantly fewer TH-positive neurons after culture of VZ explants from NRCAM KO mice (unpaired t-test, p < 0.0001) (n = 10 explants/genotype, from 3 mice). Bars show SE. Statistical significance denoted in charts by asterisks: **p < 0.01, ***p < 0.001, ****p < 0.0001. Scale bars: 50 μm.
FIGURE 6
FIGURE 6
scRNA seq of hypothalamus from wild-type and NrCAM KO mice. (A,B) UMAP plot (A) shows subsets of tanycytes, characterized according to previously-described makers (B). (C) Violin plots show differential gene expression of selective genes in tanycyte subsets in NrCAM KO compared to wild-type hypothalamus.
FIGURE 7
FIGURE 7
scRNA seq of neurons from wild-type and NrCAM KO mice. (A) UMAP plot shows subsets of neurons, characterized according to previously-described makers. (B) Violin plots show differential gene expression of selective genes in NrCAM KO compared to wild-type hypothalamus.
FIGURE 8
FIGURE 8
Body weight and food intake are reduced in adult NrCAM KO mice. NrCAM KO reduces body weight and food intake. (A) Body weight and (B) Cumulative food intake of wild-type and NrCAM KO mice in adulthood. (C) Respiratory exchange ratio (RER); (D) Oxygen consumption and (E) Activity of NrCAM KO mice vs. wild-type littermate control animals (n = 8 per genotype). Values are mean ± SEM. Statistical significance denoted in charts by asterisks: *p < 0.05, **p < 0.01.

Similar articles

Cited by

References

    1. Alles J., Karaiskos N., Praktiknjo S. D., Grosswendt S., Wahle P., Ruffault P.-L., et al. (2017). Cell fixation and preservation for droplet-based single-cell transcriptomics. BMC Biol. 15:44. 10.1186/s12915-017-0383-5 - DOI - PMC - PubMed
    1. Ando T., Kato R., Honda H. (2019). Identification of an early cell fate regulator by detecting dynamics in transcriptional heterogeneity and co-regulation during astrocyte differentiation. NPJ Syst. Biol. Appl. 5:18. 10.1038/s41540-019-0095-2 - DOI - PMC - PubMed
    1. Bai G., Sheng N., Xie Z., Bian W., Yokota Y., Benezra R., et al. (2007). Id sustains Hes1 expression to inhibit precocious neurogenesis by releasing negative autoregulation of Hes1. Dev. Cell 13 283–297. 10.1016/j.devcel.2007.05.014 - DOI - PubMed
    1. Bechtold D. A., Sidibe A., Saer B. R. C., Li J., Hand L. E., Ivanova E. A., et al. (2012). A role for the melatonin-related receptor GPR50 in leptin signaling, adaptive thermogenesis, and torpor. Curr. Biol. 22 70–77. 10.1016/j.cub.2011.11.043 - DOI - PubMed
    1. Bjornsson C. S., Apostolopoulou M., Tian Y., Temple S. (2015). It takes a village: constructing the neurogenic niche. Dev. Cell 32 435–446. 10.1016/j.devcel.2015.01.010 - DOI - PMC - PubMed

LinkOut - more resources