

Automatic classification of severity of COVID-19 patients using texture feature and random forest based on computed tomography images
- PMID: 35464345
- PMCID: PMC9015452
- DOI: 10.1002/ima.22679
Automatic classification of severity of COVID-19 patients using texture feature and random forest based on computed tomography images
Abstract
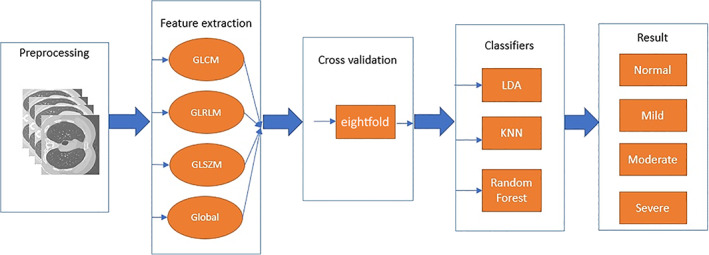
Severity assessment of the novel Coronavirus (COVID-19) using chest computed tomography (CT) scan is crucial for the effective administration of the right therapeutic drugs and also for monitoring the progression of the disease. However, determining the severity of COVID-19 needs a highly expert radiologist by visual assessment, which is time-consuming, boring, and subjective. This article introduces an advanced machine learning tool to determine the severity of COVID-19 to mild, moderate, and severe from the lung CT images. We have used a set of quantitative first- and second-order statistical texture features from each image. The first-order texture features extracted from the image histogram are variance, skewness, and kurtosis. The second-order texture features extraction methods are gray-level co-occurrence matrix, gray-level run length matrix, and gray-level size zone matrix. Finally, using the extracted features, CT images of each person are classified using random forest (RF) as an ensemble method based on majority voting of the decision trees outputs to four classes. We have used a dataset of CT scans labeled as being normal (231), mild (563), moderate (120), and severe (42) determined by expert radiologists. The experimental results indicate the combination of all feature extraction methods, and RF achieves the highest result compared with the other strategies in detecting the four classes of severity of COVID-19 from CT images with an accuracy of 90.95%. This proposed system can work well and can be used as an assistant diagnostic tool for quantification of lung involvement of COVID-19 to monitor the progression of the disease.
Keywords: computed tomography; random forest; severity of COVID‐19; texture features.
© 2021 Wiley Periodicals LLC.
Figures


References
-
- Coronavirus W . https://covid19.who.int 2020.
LinkOut - more resources
Full Text Sources