

Therapeutic effects of crude extracts of Bacopa floribunda on beta-amyloid 1-42-induced Alzheimer's disease via suppression of dyslipidemia, systemic inflammation and oxidative stress in male Wistar Rats
- PMID: 35464703
- PMCID: PMC9026591
- DOI: 10.1016/j.heliyon.2022.e09255
Therapeutic effects of crude extracts of Bacopa floribunda on beta-amyloid 1-42-induced Alzheimer's disease via suppression of dyslipidemia, systemic inflammation and oxidative stress in male Wistar Rats
Abstract
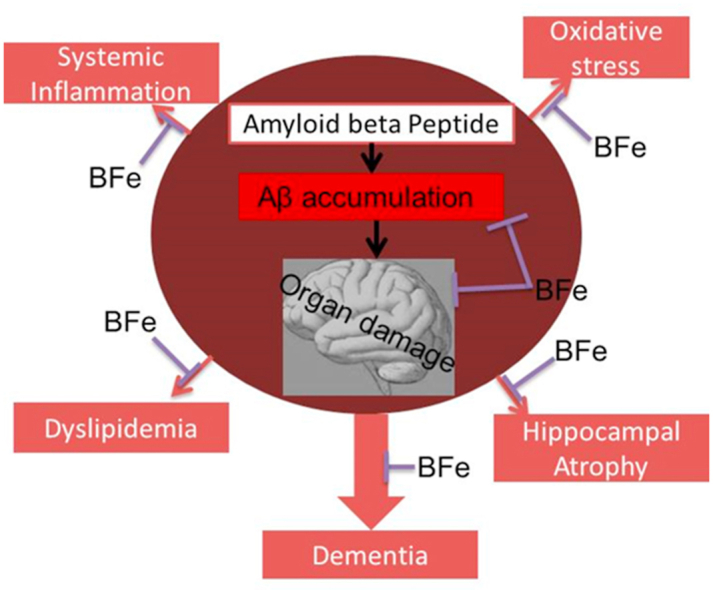
Aims: Bacopa floribunda (BF), an African traditional plant and its species have been widely used as brain tonic for memory enhancement. It has also been reported to help relieve anxiety and some psychological disorders. This study aimed to investigate the mechanisms of action of BF on Amyloid beta (Aβ) 1-42 peptides induced cognitive deficit in male Wistar rats.
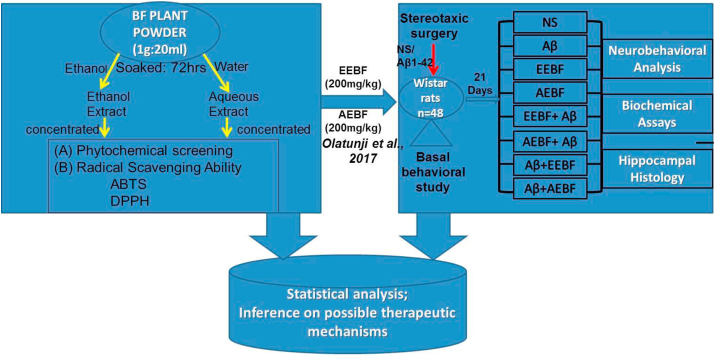
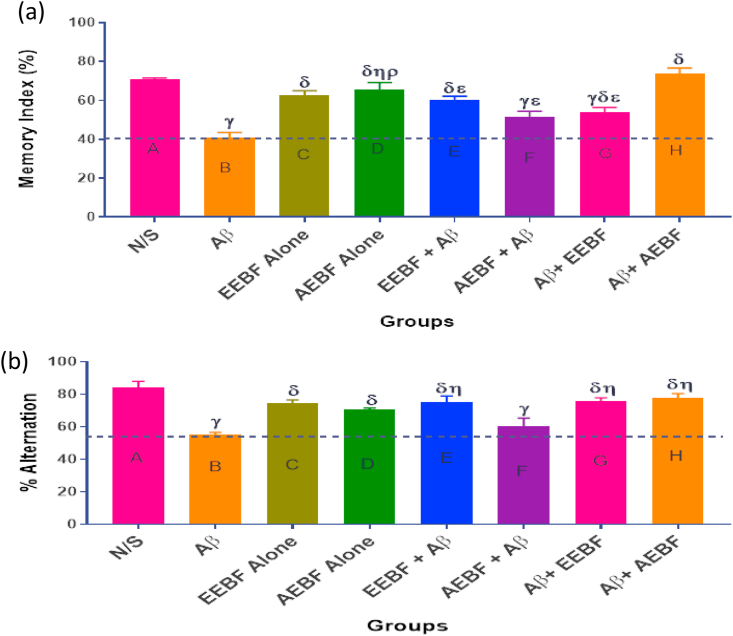
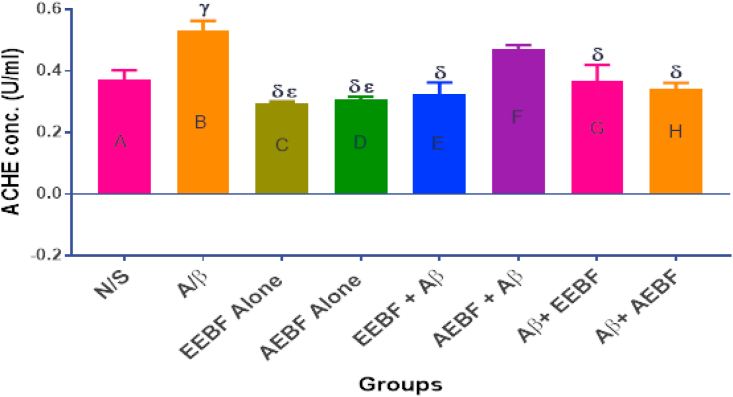
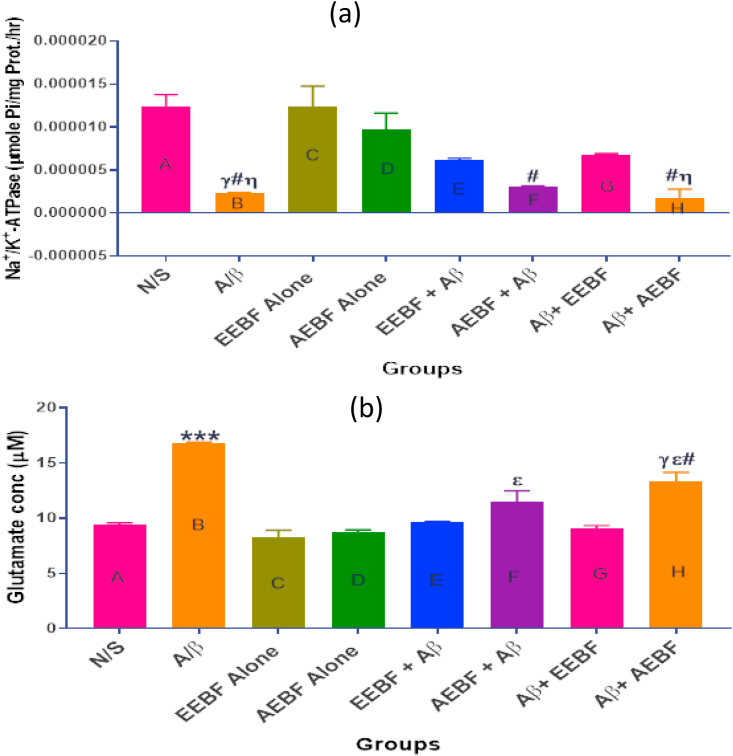
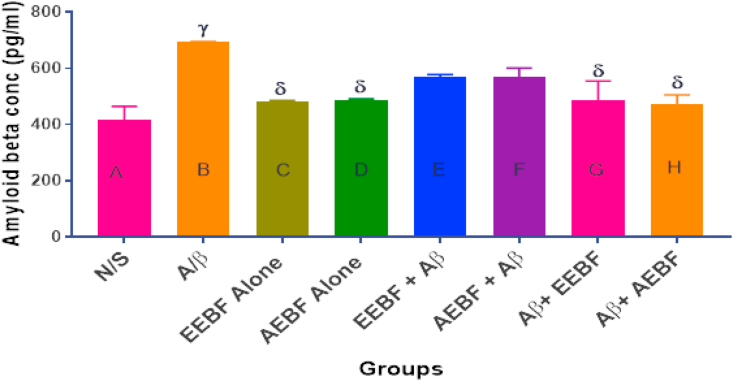
Main methods: A total of 48 healthy male wistar rats were used for this study. Some groups were pre-treated with 200 mg/kg of BF extracts before a single bilateral injection of Aβ 1-42 while some were post-treated with BF for 21 days after Aβ1-42 exposure. Cognitive performance was evaluated using Y-Maze and Novel Object recognition tests. After treatments, hippocampal homogenates were assayed for the levels of Acetylcholinesterase, Na-K/ATPase activities, glutamate and Aβ1-42 concentrations among others.
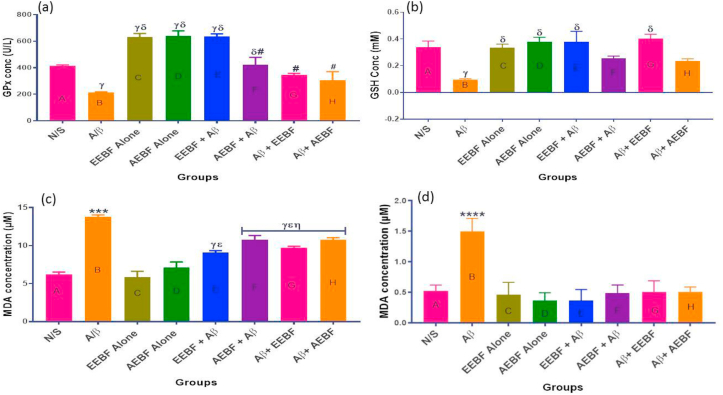
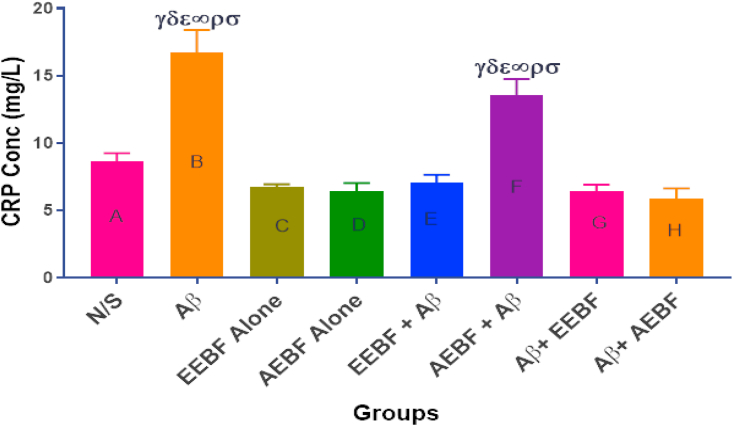
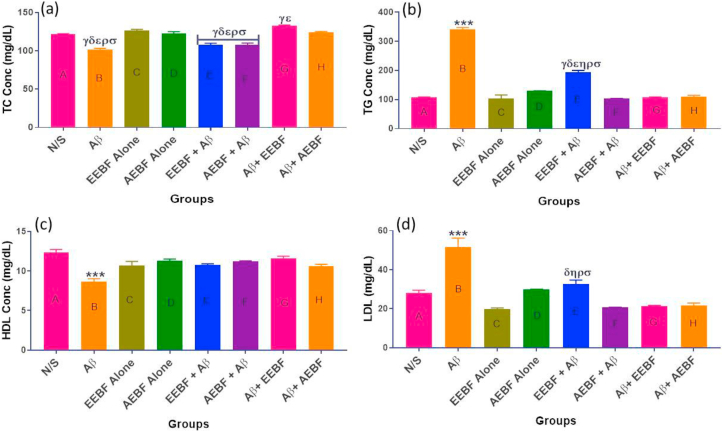
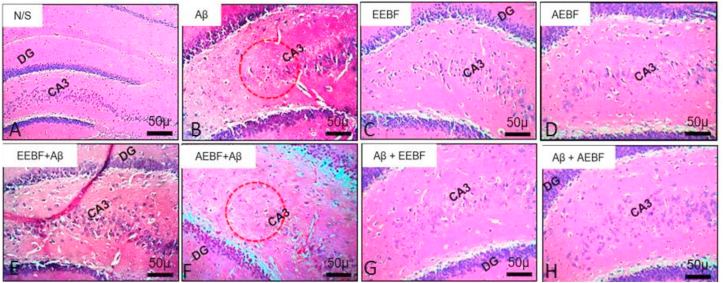
Key findings: It was observed that Aβ1-42 caused cognitive impairment and BF extracts especially the ethanol extract was able to significantly (p < 0.05) reverse almost all the perturbations including lipid imbalance caused by Aβ1-42 assault mainly at the post-treatment level.
Significance: Administration of ethanol and aqueous extracts of BF mitigated the hazardous effect of Aβ1-42 observed in the blood plasma and hippocampal homogenates. In this context, we conclude that BF is an efficient cognitive enhancer that can help alleviate some symptoms associated with Alzheimer's disease.
Keywords: Acetylcholinesterase; Bacopa floribunda; Cognitive enhancer; Glutamate excitotoxicity; Na–K/ATPase.
© 2022 The Authors. Published by Elsevier Ltd.
Conflict of interest statement
The authors declare no conflict of interest.
Figures
Similar articles
-
Saponins and flavonoids from Bacopa floribunda plant extract exhibit antioxidant and anti-inflammatory effects on amyloid beta 1-42-induced Alzheimer's disease in BALB/c mice.J Ethnopharmacol. 2022 Apr 24;288:114997. doi: 10.1016/j.jep.2022.114997. Epub 2022 Jan 13. J Ethnopharmacol. 2022. PMID: 35033624
-
Alterations on Na⁺,K⁺-ATPase and acetylcholinesterase activities induced by amyloid-β peptide in rat brain and GM1 ganglioside neuroprotective action.Neurochem Res. 2013 Nov;38(11):2342-50. doi: 10.1007/s11064-013-1145-6. Epub 2013 Sep 8. Neurochem Res. 2013. PMID: 24013887
-
Clausena Harmandiana root extract attenuated cognitive impairments via reducing amyloid accumulation and neuroinflammation in Aβ1-42-induced rats.BMC Complement Med Ther. 2022 Apr 19;22(1):108. doi: 10.1186/s12906-022-03591-4. BMC Complement Med Ther. 2022. PMID: 35439990 Free PMC article.
-
Effects of Astaxanthin from Shrimp Shell on Oxidative Stress and Behavior in Animal Model of Alzheimer's Disease.Mar Drugs. 2019 Nov 4;17(11):628. doi: 10.3390/md17110628. Mar Drugs. 2019. PMID: 31690015 Free PMC article.
-
Pinus halepensis essential oil attenuates the toxic Alzheimer's amyloid beta (1-42)-induced memory impairment and oxidative stress in the rat hippocampus.Biomed Pharmacother. 2019 Apr;112:108673. doi: 10.1016/j.biopha.2019.108673. Epub 2019 Feb 20. Biomed Pharmacother. 2019. PMID: 30784941
Cited by
-
Optimization of Parkinson's disease therapy with plant extracts and nutrition's evolving roles.IBRO Neurosci Rep. 2024 May 24;17:1-12. doi: 10.1016/j.ibneur.2024.05.011. eCollection 2024 Dec. IBRO Neurosci Rep. 2024. PMID: 38872839 Free PMC article. Review.
-
Novel p-Hydroxybenzoic Acid Derivative Isolated from Bacopa procumbens and Its Antibacterial Activity.Antibiotics (Basel). 2025 Jun 7;14(6):591. doi: 10.3390/antibiotics14060591. Antibiotics (Basel). 2025. PMID: 40558181 Free PMC article.
References
-
- NIA . 2016. Alzheimer’s and Related Dementias Education and Referral (ADEAR) Center.www.nia.nih.gov/alzheimers
-
- Adewusi E.A., Moodley N., Steenkamp V. Medicinal plants with cholinesterase inhibitory activity: a Review. Afr. J. Biotechnol. 2010;9(49):8257–8276.
-
- Alzheimer's Association Alzheimer's disease facts and figures. Alzheimer's Dementia. 2018;14(5):701. - PubMed
LinkOut - more resources
Full Text Sources
Miscellaneous
