. 2022 Apr 6:13:851390.
doi: 10.3389/fgene.2022.851390. eCollection 2022.

Identification and Validation of Chromobox Family Members as Potential Prognostic Biomarkers and Therapeutic Targets for Human Esophageal Cancer

Affiliations

Identification and Validation of Chromobox Family Members as Potential Prognostic Biomarkers and Therapeutic Targets for Human Esophageal Cancer

Xuefen Fang et al. Front Genet. .

Abstract

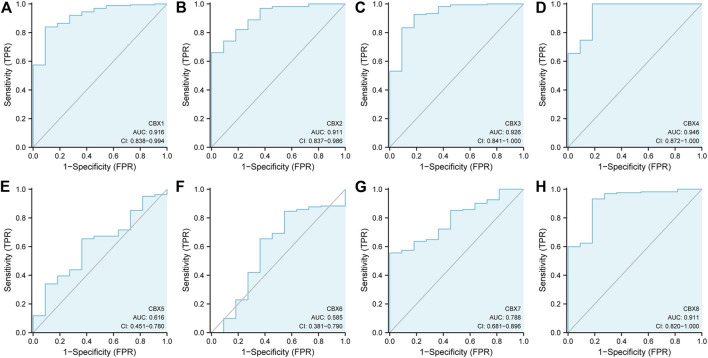
Background: Chromobox family proteins (CBXs) are vital components of epigenetic regulation complexes and transcriptionally inhibit target genes by modifying the chromatin. Accumulating evidence indicates that CBXs are involved in the initiation and progression of multiple malignancies. However, the expression, function, and clinical relevance such as the prognostic and diagnostic values of different CBXs in esophageal carcinoma (ESCA) are still unclear. Methods: We applied Oncomine, TCGA, GEO, GEPIA, UALCAN, Kaplan-Meier plotter, cBioPortal, Metascape, and TIMER to investigate the roles of CBX family members in ESCA. Additionally, quantitative real-time PCR (RT-PCR), western blot, and immunofluorescence were used to verify the expression of CBX family members in ESCA clinical samples. Results: Compared with normal tissues, the mRNA expression levels of CBX1/3/8 were significantly increased in ESCA, whereas CBX7 mRNA expression was reduced in both the TCGA cohort and GEO cohort. In the TCGA cohort, ROC curves suggested that CBX1/2/3/4/8 had great diagnostic value in ESCA, and the AUCs were above 0.9. Furthermore, upregulation of CBX1/3/8 and downregulation of CBX7 were closely related to the clinicopathological parameters in ESCA patients, such as tumor grades, tumor nodal metastasis status, and TP53 mutation status. The survival analysis indicated that higher CBX1/3/8 mRNA expressions and lower CBX7 expression suggested an unfavorable prognosis in ESCA. High genetic change rate (52%) of CBXs was found in ESCA patients. Functions and pathways of mutations in CBXs and their 50 frequently altered neighbor genes in ESCA patients were investigated; the results showed that DNA repair and DNA replication were correlated to CBX alterations. Moreover, we found a significant correlation between the expression level of CBX family members and the infiltration of immune cells in ESCA. Finally, we verified the expression of CBX family members in clinical samples and found the results were consistent with the databases. Conclusion: Our study implied that CBX1/3/7/8 are potential targets of precision therapy for ESCA patients and new biomarkers for the prognosis.

Keywords: bioinformatics analysis; biomarker; chromobox (CBX) protein; esophageal cancer; immunofluorescence; prognosis.


Conflict of interest statement

The authors declare that the research was conducted in the absence of any commercial or financial relationships that could be construed as a potential conflict of interest.

Figures

FIGURE 1
FIGURE 1
Expression of CBX family members in ESCA and normal. (A) mRNA levels of CBX family members in various types of cancer (ONCOMINE). The figure shows the numbers of datasets with statistically significant mRNA overexpression (red) or downregulated expression (blue) of CBXs. Cutoff of p value: 0.05, fold change:1.5, gene rank: 10%, data type: mRNA. (B) Transcriptional of CBX family members in ESCA and normal (TCGA). (C) Expression of CBX family members in ESCA and adjacent normal (GSE38129 + GSE20347 cohort). The p value was set at 0.05. (D) Relative mRNA expression level of CBXs in ESCA and normal tissues in GEPIA. Color intensity represents the fold change expression of the genes in the tissue. *p < 0.05, **p < 0.01, ***p < 0.001.
FIGURE 2
FIGURE 2
ROC curve analysis of CBXs diagnostic capability in ESCA cancer (A–H) (TCGA): Normal versus tumor.
FIGURE 3
FIGURE 3
(A) Correlation between different expressed CBXs and the pathological stage of ESCA patients in GEPIA. *p < 0.05. (B) Relationship between mRNA expression of distinct CBX family members and individual cancer stages of ESCA patients. *p < 0.05, **p < 0.01, ***p < 0.001. (C) Association of mRNA expression of distinct CBXs family members with tumor nodal metastasis status of ESCA patients. *p < 0.05, **p < 0.01, ***p < 0.001.
FIGURE 4
FIGURE 4
(A) Prognostic value of CBXs in esophageal squamous cell carcinoma (ESCC) patients in the overall survival curve (Kaplan–Meier Plotter). (B) Prognostic value of CBX family members in esophageal adenocarcinoma (EAC) patients in the overall survival curve (Kaplan–Meier Plotter).
FIGURE 5
FIGURE 5
(A) Summary of alterations in different expressed CBXs in ESCA. CBXs were altered in 96 samples of 183 patients with ESCA, accounting for 52% (cBioPortal). (B) Correlation between different CBXs in ESCA(GEPIA). (C) Correlation between CBX family members and TP53 expression (GEPIA). The p value was set at 0.05 (GEPIA).
FIGURE 6
FIGURE 6
(A) Gene Ontology (GO) analysis and Kyoto Encyclopedia of Genes and Genome (KEGG) analysis of CBX genes and similar genes. (B) Network of enriched terms of CBX genes and similar genes; Protein-protein interaction (PPI) enrichment analysis of these genes and MCODE (Molecular Complex Detection) components identified in the gene lists. Analyses were conducted in Metascape.
FIGURE 7
FIGURE 7
Correlations between differentially expressed CBX family members and immune cell infiltrations (TCGA). Correlations between the abundance of immune cells and the expression of CBX1-8 (A–H).
FIGURE 8
FIGURE 8
Real-time qPCR validation of CBX family members in 17 ESCA and normal esophageal tissues (A–H). *p < 0.05, **p < 0.01, ***p < 0.001 analysis by paired t-test.
FIGURE 9
FIGURE 9
Protein expression levels of CBX1, CBX3, CBX7, and CBX8 in 12 ESCA tissues and adjacent normal tissues (western blot). (A) CBX1, CBX3, and CBX8 were upregulated in ESCA tissues compared with adjacent normal tissues, while CBX7 was expressed at similar levels in ESCA and normal esophageal tissues. (B–E) Statistical results of western blotting of CBX1, CBX3, CBX7, and CBX8 in ESCA tissues and normal tissues. (*p < 0.05, analysis by paired t-test.)
FIGURE 10
FIGURE 10
Fluorescence images of paraffin-embedded sections of human ESCA and adjacent tissues with confocal microscopy. (A) CBX1 was significantly higher in ESCA tissues than that in precancerous tissues. (B) CBX3 was significantly higher in ESCA tissues than that in precancerous tissues. (C) CBX8 was significantly higher in ESCA tissues than that in precancerous tissues. The white dashed lines separate the precancerous tissues (on the left side of the figure) from the ESCA tissues (on the right side of the figure). Scale bars = 25 um. (Magnification 63✕/1.40 oil).

References

    1. Adema V., Colla S. (2022). EZH2 Inhibitors: The Unpacking Revolution. Cancer Res. 82 (3), 359–361. 10.1158/0008-5472.Can-21-4311 - DOI - PubMed
    1. Bray F., Ferlay J., Soerjomataram I., Siegel R. L., Torre L. A., Jemal A. (2018). Global Cancer Statistics 2018: GLOBOCAN Estimates of Incidence and Mortality Worldwide for 36 Cancers in 185 Countries. CA: A Cancer J. Clinicians 68 (6), 394–424. 10.3322/caac.21492 - DOI - PubMed
    1. Cao W., Lee H., Wu W., Zaman A., McCorkle S., Yan M., et al. (2020). Multi-Faceted Epigenetic Dysregulation of Gene Expression Promotes Esophageal Squamous Cell Carcinoma. Nat. Commun. 11 (1), 3675. 10.1038/s41467-020-17227-z - DOI - PMC - PubMed
    1. Cerami E., Gao J., Dogrusoz U., Gross B. E., Sumer S. O., Aksoy B. A., et al. (2012). The cBio Cancer Genomics Portal: An Open Platform for Exploring Multidimensional Cancer Genomics Data. Cancer Discov. 2 (5), 401–404. 10.1158/2159-8290.CD-12-0095 - DOI - PMC - PubMed
    1. Chan H. L., Morey L. (2019). Emerging Roles for Polycomb-Group Proteins in Stem Cells and Cancer. Trends Biochem. Sci. 44 (8), 688–700. 10.1016/j.tibs.2019.04.005 - DOI - PubMed