

Co-expression Mechanism Analysis of Different Tachyplesin I-Resistant Strains in Pseudomonas aeruginosa Based on Transcriptome Sequencing
- PMID: 35464984
- PMCID: PMC9022664
- DOI: 10.3389/fmicb.2022.871290
Co-expression Mechanism Analysis of Different Tachyplesin I-Resistant Strains in Pseudomonas aeruginosa Based on Transcriptome Sequencing
Abstract
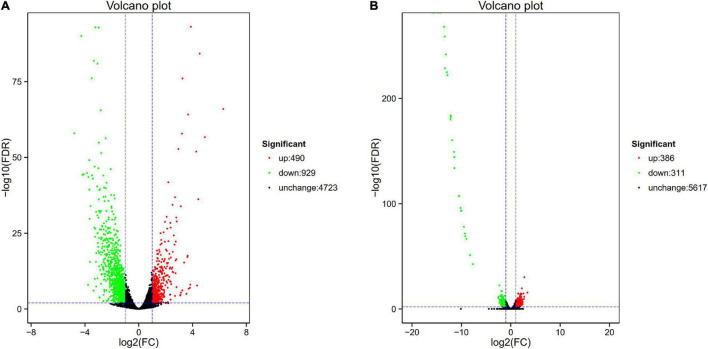
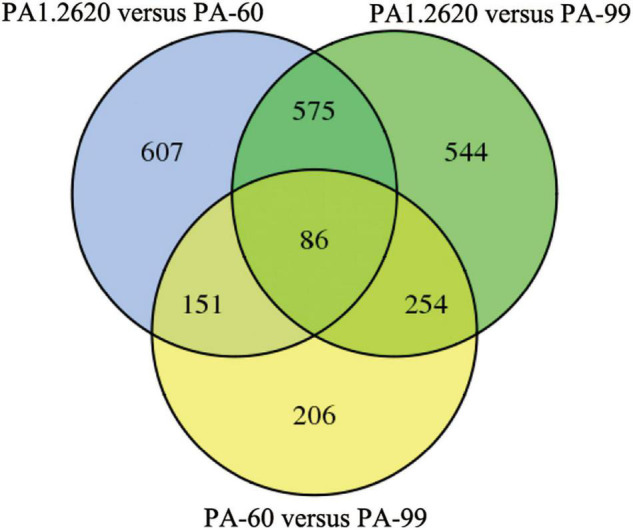
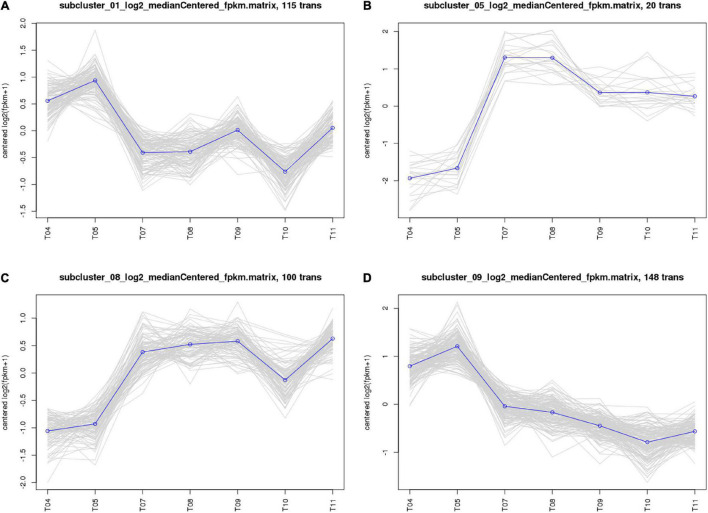
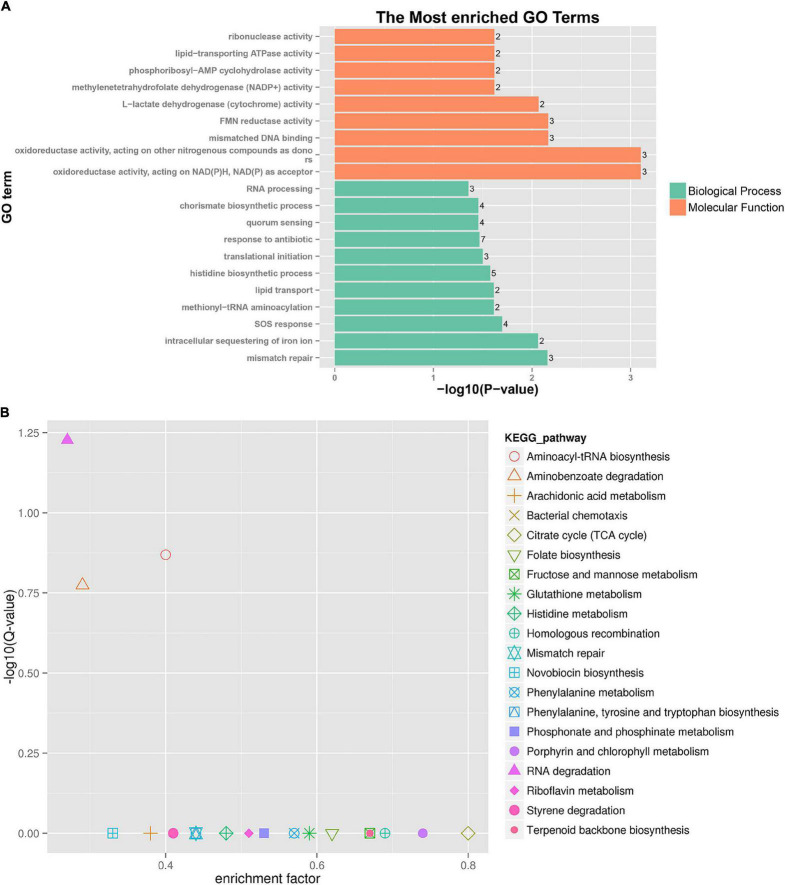
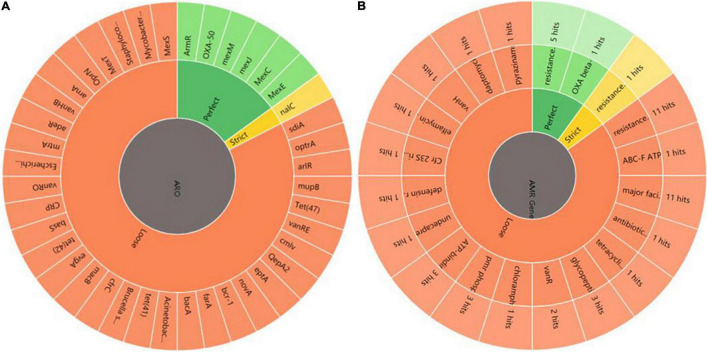
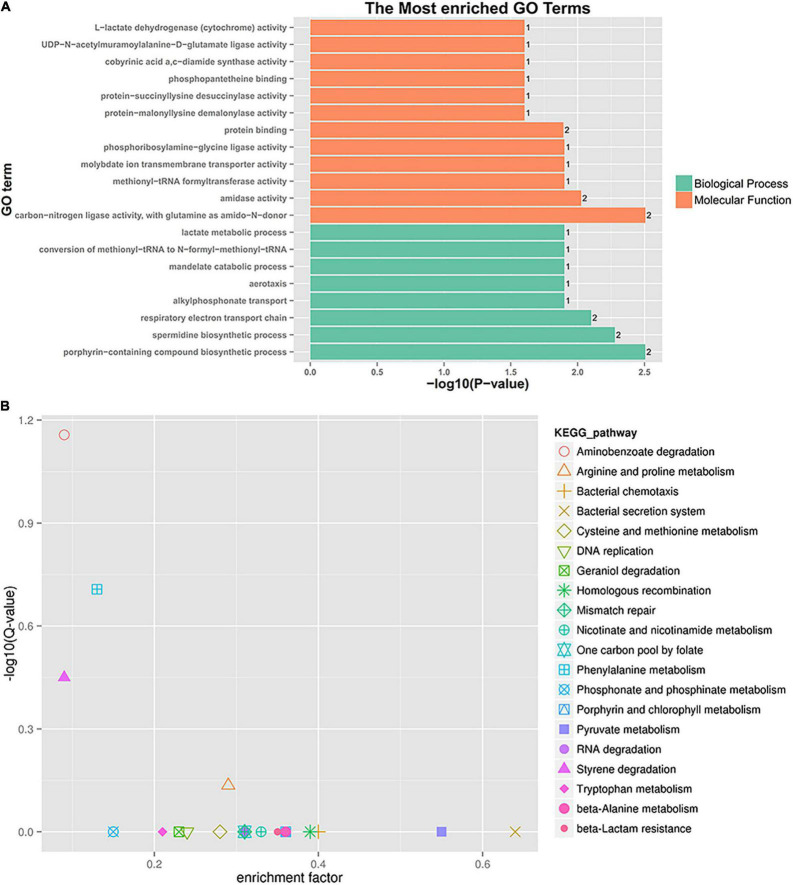
Tachyplesin I is a cationic antimicrobial peptide with 17 amino acids. The long-term continuous exposure to increased concentrations of tachyplesin I induced resistance in Pseudomonas aeruginosa. The global gene expression profiling of tachyplesin I-resistant P. aeruginosa strains PA-60 and PA-99 and the sensitive strain P. aeruginosa CGMCC1.2620 (PA1.2620) were conducted by transcriptome sequencing to analyze the common underlying mechanism of resistance to tachyplesin I in low- or high-resistance mutants. The co-expression patterns, gene ontology (GO) and Kyoto Encyclopedia of Genes and Genomes (KEGG) pathway enrichment, sRNA target genes, and single-nucleotide polymorphism (SNP) change were analyzed for the co-expressed genes in this study. A total of 661 differentially co-expressed genes under treatments of PA1.2620 vs. PA-99 and PA1.2620 vs. PA-60 (HL) were divided into 12 kinds of expression patterns. GO and KEGG pathway enrichment analyses indicated that the enrichment of co-expressed genes was mainly associated with oxidoreductase activity, mismatched DNA binding, mismatch repair, RNA degradation of GO terms, aminoacyl-tRNA biosynthesis, and aminobenzoate degradation pathways, and so forth. The co-expressed resistance-related genes were mainly involved in antibiotic efflux and antibiotic inactivation. Seven co-expressed genes had SNP changes. Some co-expressed sRNAs were involved in P. aeruginosa resistance to tachyplesin I by regulating target genes and pathways related to resistance. The common resistance mechanism of P. aeruginosa among different mutants to tachyplesin I was mainly associated with the expression alteration of several genes and sRNA-regulated target genes related to resistance; few genes had base mutations. The findings of this study might provide guidance for understanding the resistance mechanism of P. aeruginosa to tachyplesin I.
Keywords: P. aeruginosa; RNA-Seq; SNP; co-expressed genes; sRNA; tachyplesin I.
Copyright © 2022 Hong, Li, Jiang and Hong.
Conflict of interest statement
The authors declare that the research was conducted in the absence of any commercial or financial relationships that could be construed as a potential conflict of interest.
Figures
Similar articles
-
Transcriptome Analysis Reveals the Resistance Mechanism of Pseudomonas aeruginosa to Tachyplesin I.Infect Drug Resist. 2020 Jan 16;13:155-169. doi: 10.2147/IDR.S226687. eCollection 2020. Infect Drug Resist. 2020. PMID: 32021330 Free PMC article.
-
Experimental Induction of Bacterial Resistance to the Antimicrobial Peptide Tachyplesin I and Investigation of the Resistance Mechanisms.Antimicrob Agents Chemother. 2016 Sep 23;60(10):6067-75. doi: 10.1128/AAC.00640-16. Print 2016 Oct. Antimicrob Agents Chemother. 2016. PMID: 27480861 Free PMC article.
-
The Small RNAs PA2952.1 and PrrH as Regulators of Virulence, Motility, and Iron Metabolism in Pseudomonas aeruginosa.Appl Environ Microbiol. 2021 Jan 15;87(3):e02182-20. doi: 10.1128/AEM.02182-20. Print 2021 Jan 15. Appl Environ Microbiol. 2021. PMID: 33158897 Free PMC article.
-
Transcriptome analysis of sRNA responses to four different antibiotics in Pseudomonas aeruginosa PAO1.Microb Pathog. 2022 Dec;173(Pt A):105865. doi: 10.1016/j.micpath.2022.105865. Epub 2022 Nov 1. Microb Pathog. 2022. PMID: 36332790
-
Tachyplesin Causes Membrane Instability That Kills Multidrug-Resistant Bacteria by Inhibiting the 3-Ketoacyl Carrier Protein Reductase FabG.Front Microbiol. 2018 May 1;9:825. doi: 10.3389/fmicb.2018.00825. eCollection 2018. Front Microbiol. 2018. PMID: 29765362 Free PMC article.
Cited by
-
Genome-Wide Investigation Reveals Potential Therapeutic Targets in Shigella spp.Biomed Res Int. 2024 Mar 21;2024:5554208. doi: 10.1155/2024/5554208. eCollection 2024. Biomed Res Int. 2024. PMID: 38595330 Free PMC article.
-
Heterogeneous efflux pump expression underpins phenotypic resistance to antimicrobial peptides.Elife. 2025 Jul 3;13:RP99752. doi: 10.7554/eLife.99752. Elife. 2025. PMID: 40607907 Free PMC article.
-
Polymorphisms of CCSER1 Gene and Their Correlation with Milk Quality Traits in Gannan Yak (Bos grunniens).Foods. 2023 Nov 29;12(23):4318. doi: 10.3390/foods12234318. Foods. 2023. PMID: 38231770 Free PMC article.
References
-
- Arendt W., Groenewold M. K., Hebecker S., Dickschat J. S., Moser J. (2013). Identification and characterization of a periplasmic aminoacyl- phosphatidylglycerol hydrolase responsible for Pseudomonas aeruginosa lipid homeostasis. J. Biol. Chem. 288 24717–24730. 10.1074/jbc.M113.482935 - DOI - PMC - PubMed
LinkOut - more resources
Full Text Sources