

Cluster Differences in Antibiotic Resistance, Biofilm Formation, Mobility, and Virulence of Clinical Enterobacter cloacae Complex
- PMID: 35464993
- PMCID: PMC9019753
- DOI: 10.3389/fmicb.2022.814831
Cluster Differences in Antibiotic Resistance, Biofilm Formation, Mobility, and Virulence of Clinical Enterobacter cloacae Complex
Abstract
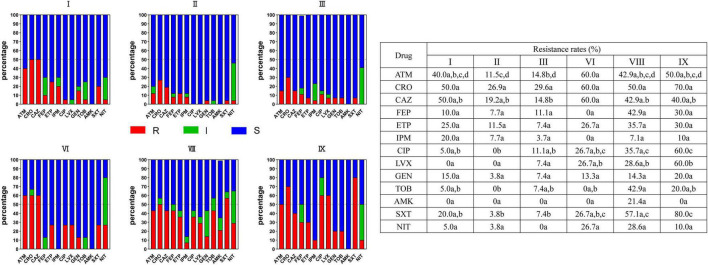
Due to the lack of research on the characteristics of different clusters of Enterobacter cloacae complex (ECC), this study aimed to characterize and explore the differences among species of the ECC. An analysis based on hsp60 showed that Enterobacter hormaechei was predominant in ECC. Interestingly, the antibiotic resistance rates of clusters were different, among which E. hormaechei subsp. steigerwaltii (cluster VIII) and Enterobacter cloacae IX (cluster IX) possessed high resistant rates to ciprofloxacin and levofloxacin, but cluster II (Enterobacter kobei) had low resistant rates. Cluster II exhibited a strong biofilm formation ability. Different motility and protease production ability were shown for distinct clusters. A PCR analysis showed that clusters I, III, VI, VIII, and IX carried more virulence genes, while cluster II had fewer. Clusters I, VIII, and IX with high pathogenicity were evaluated using the Galleria mellonella infection model. Thus, the characteristics of resistance, biofilm-forming ability, mobility, and virulence differed among the clusters. The strains were divided into 12 subgroups based on hsp60. The main clusters of ECC clinical strains were I, II, III, VI, VIII, and IX, among which IX, VIII, and I were predominant with high resistance and pathogenicity, and cluster II (E. kobei) was a special taxon with a strong biofilm formation ability under nutrient deficiency, but was associated with low resistance, virulence, and pathogenicity. Hence, clinical classification methods to identify ECC subgroups are an urgent requirement to guide the treatment of clinical infections.
Keywords: Enterobacter cloacae complex; biofilm; clinical distribution; resistance; virulence.
Copyright © 2022 Liu, Chen, Wang, Zhou, Ye, Zheng, Lin, Zeng, Zhou and Ye.
Conflict of interest statement
The authors declare that the research was conducted in the absence of any commercial or financial relationships that could be construed as a potential conflict of interest. The reviewer BZ declared a shared affiliation with one of the authors, JY to the handling editor at the time of the review.
Figures


Similar articles
-
Comparison of prevalence, resistance, biofilm-forming ability and virulence between carbapenem-non-susceptible and carbepenem-susceptible Enterobacter cloacae complex in clusters.J Hosp Infect. 2023 Sep;139:168-174. doi: 10.1016/j.jhin.2023.06.017. Epub 2023 Jun 20. J Hosp Infect. 2023. PMID: 37348563
-
The Resistance Mechanisms and Clinical Impact of Resistance to the Third Generation Cephalosporins in Species of Enterobacter cloacae Complex in Taiwan.Antibiotics (Basel). 2022 Aug 26;11(9):1153. doi: 10.3390/antibiotics11091153. Antibiotics (Basel). 2022. PMID: 36139933 Free PMC article.
-
Species identification, antibiotic resistance, and virulence in Enterobacter cloacae complex clinical isolates from South Korea.Front Microbiol. 2023 Mar 23;14:1122691. doi: 10.3389/fmicb.2023.1122691. eCollection 2023. Front Microbiol. 2023. PMID: 37032871 Free PMC article.
-
High prevalence of colistin heteroresistance in specific species and lineages of Enterobacter cloacae complex derived from human clinical specimens.Ann Clin Microbiol Antimicrob. 2023 Jul 15;22(1):60. doi: 10.1186/s12941-023-00610-1. Ann Clin Microbiol Antimicrob. 2023. PMID: 37454128 Free PMC article.
-
Enterobacter cloacae complex: clinical impact and emerging antibiotic resistance.Future Microbiol. 2012 Jul;7(7):887-902. doi: 10.2217/fmb.12.61. Future Microbiol. 2012. PMID: 22827309 Review.
Cited by
-
Phage-antibiotic synergy to combat multidrug resistant strains of Gram-negative ESKAPE pathogens.Sci Rep. 2025 May 18;15(1):17235. doi: 10.1038/s41598-025-01489-y. Sci Rep. 2025. PMID: 40383795 Free PMC article.
-
Factors Influencing Biofilm Formation by Salmonella enterica sv. Typhimurium, E. cloacae, E. hormaechei, Pantoea spp., and Bacillus spp. Isolated from Human Milk Determined by PCA Analysis.Foods. 2022 Nov 30;11(23):3862. doi: 10.3390/foods11233862. Foods. 2022. PMID: 36496670 Free PMC article.
-
Pathogenicity and host-interacting mechanisms of enterogenic Enterobacter cancerogenus in silkworm.Front Microbiol. 2025 Mar 26;16:1548808. doi: 10.3389/fmicb.2025.1548808. eCollection 2025. Front Microbiol. 2025. PMID: 40207159 Free PMC article.
-
Novel Animal Model of Enterobacteria Pathogenicity, Virulence, and Amoxicillin-Biosurfactant Synergic Using Nsombé (Rhynchophorus phoenicis Larvae).Microbiologyopen. 2025 Aug;14(4):e70025. doi: 10.1002/mbo3.70025. Microbiologyopen. 2025. PMID: 40588864 Free PMC article.
-
Strategies for combating antibiotic resistance in bacterial biofilms.Front Cell Infect Microbiol. 2024 Jan 19;14:1352273. doi: 10.3389/fcimb.2024.1352273. eCollection 2024. Front Cell Infect Microbiol. 2024. PMID: 38322672 Free PMC article. Review.
References
-
- Amaretti A., Righini L., Candeliere F., Musmeci E., Bonvicini F., Gentilomi G. A., et al. (2020). Antibiotic resistance, virulence factors, phenotyping, and genotyping of non-Escherichia coli Enterobacterales from the gut microbiota of healthy subjects. Int. J. Mol. Sci. 21:1847. 10.3390/ijms21051847 - DOI - PMC - PubMed
-
- Brust F. R., Boff L., da Silva Trentin D., Pedrotti Rozales F., Barth A. L., Macedo A. J. (2019). Macrocolony of NDM-1 producing Enterobacter hormaechei subsp. oharae generates subpopulations with different features regarding the response of antimicrobial agents and biofilm formation. Pathogens 8:49. 10.3390/pathogens8020049 - DOI - PMC - PubMed
LinkOut - more resources
Full Text Sources
Molecular Biology Databases
Research Materials
Miscellaneous