. 2022 Apr 6:15:860275.
doi: 10.3389/fnmol.2022.860275. eCollection 2022.

Excitatory and Inhibitory Synaptic Imbalance Caused by Brain-Derived Neurotrophic Factor Deficits During Development in a Valproic Acid Mouse Model of Autism

Affiliations

Excitatory and Inhibitory Synaptic Imbalance Caused by Brain-Derived Neurotrophic Factor Deficits During Development in a Valproic Acid Mouse Model of Autism

Chuchu Qi et al. Front Mol Neurosci. .

Abstract

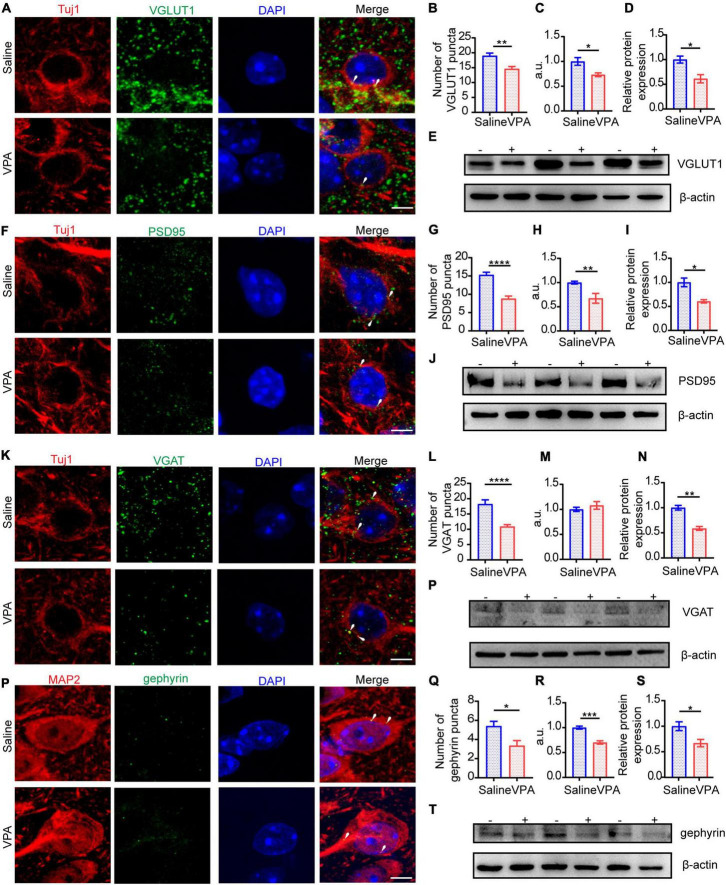
Environmental factors, such as medication during pregnancy, are one of the major causes of autism spectrum disorder (ASD). Valproic acid (VPA) intake during pregnancy has been reported to dramatically elevate autism risk in offspring. Recently, researchers have proposed that VPA exposure could induce excitatory or inhibitory synaptic dysfunction. However, it remains to be determined whether and how alterations in the excitatory/inhibitory (E/I) balance contribute to VPA-induced ASD in a mouse model. In the present study, we explored changes in the E/I balance during different developmental periods in a VPA mouse model. We found that typical markers of pre- and postsynaptic excitatory and inhibitory function involved in E/I balance markedly decreased during development, reflecting difficulties in the development of synaptic plasticity in VPA-exposed mice. The expression of brain-derived neurotrophic factor (BDNF), a neurotrophin that promotes the formation and maturation of glutamatergic and GABAergic synapses during postnatal development, was severely reduced in the VPA-exposed group. Treatment with exogenous BDNF during the critical E/I imbalance period rescued synaptic functions and autism-like behaviors, such as social defects. With these results, we experimentally showed that social dysfunction in the VPA mouse model of autism might be caused by E/I imbalance stemming from BDNF deficits during the developmental stage.

Keywords: BDNF; E/I balance; autism; excitatory synapse; inhibitory synapse; synaptic development; valproic acid.


Conflict of interest statement

The authors declare that the research was conducted in the absence of any commercial or financial relationships that could be construed as a potential conflict of interest.

Figures

FIGURE 1
FIGURE 1
VPA-exposed pups expressed decreasing calls of attention at P7. (A) Timeline of VPA-exposed autism model making and USVs recording. USV, ultrasonic vocalization. (B) Left: Canonical waveforms of USVs from the saline group. Right: Canonical waveforms of USVs from the VPA group. Data are presented (C) number of calls, (D) duration, (E) principal frequency of the calls (Saline: n = 42; VPA: n = 40). Data are presented as the mean ± SEM. **p < 0.01 vs. saline-exposed group by two-tailed unpaired Student’s t-test.
FIGURE 2
FIGURE 2
Core symptoms with autism spectrum disorders showed in VPA-exposed mice. (A) Timeline of behavior tests. TCT, three chamber test. EPM, elevated plus maze. MBT, marbles burying test. OFT, open field test. Sociability (B–D) and social preference (E–G) were analyzed using a three-chambered apparatus. Time spent in the social zone (C) and preference score (D) were calculated for a sociability test. Time spent in the stranger zone (F) and preference score (G) were calculated for a social preference test. Reduced social desire levels and social preference were seen in VPA group. (H) The schematic diagram of grooming test. Durations of grooming time (I), numbers of grooming (J), and latency of the first grooming (K) were significantly reduced in VPA-exposed mice compared to the saline-exposed mice. Data are presented as the mean ± SEM. *p < 0.5, **p < 0.01 and ***p < 0.001 vs. saline-exposed group by two-tailed unpaired Student’s t-test.
FIGURE 3
FIGURE 3
Decreased synaptic transmission and disrupted E/I balance in ACC neurons during the different development stages. (A)Timeline of electrophysiology recording in vitro. (B) Representative mEPSC traces in ACC pyramidal neurons at P14. (C) Summary data for mEPSCs frequency and peak amplitude in ACC pyramidal neurons obtained from saline-exposed group and VPA-exposed group (n = 10 neurons, 3 mice of saline-exposed group; n = 11 neurons, 3 mice of VPA-exposed group). (D) Representative mIPSC traces in ACC pyramidal neurons at P14. (E) Summary data for mIPSCs frequency and peak amplitude in ACC pyramidal neurons obtained from saline-exposed group and VPA-exposed group (n = 10 neurons, 3 mice of saline-exposed group; n = 11 neurons, 3 mice of VPA-exposed group). (F) Representative mEPSC traces in ACC pyramidal neurons at P30. (G) Summary data for mEPSCs frequency and peak amplitude in ACC pyramidal neurons obtained from saline-exposed group and VPA-exposed group (n = 11 neurons, 3 mice of saline-exposed group; n = 9 neurons, 3 mice of VPA-exposed group). (H) Representative mIPSC traces in ACC pyramidal neurons at P30. (I) Summary data for mIPSCs frequency and peak amplitude in ACC pyramidal neurons obtained from saline-exposed group and VPA-exposed group (n = 11 neurons, 3 mice of saline-exposed group; n = 9 neurons, 3 mice of VPA-exposed group). (J) E/I ratio of frequency and amplitude between saline-exposed group and VPA-exposed group at P14. (K) E/I ratio of frequency and amplitude between saline-exposed group and VPA-exposed group at P30. Data are presented as the mean ± SEM. *p < 0.05, **p < 0.01, and ***p < 0.001 vs. saline-exposed group by two-tailed unpaired Student’s t-test.
FIGURE 4
FIGURE 4
The structure of excitatory synapse in ACC was impaired at P7. (A) Timeline of IF (immunofluorescence) and Western blot. (B) IF images detecting VGLUT1 expression between saline-exposed and VPA-exposed groups. (C,D) IF quantitative analysis revealed expression of VGLUT1 did not change significantly between the saline-exposed group and VPA-exposed group. (E) Quantitative analysis of protein level of VGLUT1 of Western blot. (F) Representative Western blot image of VGLUT1 expression (–, saline-exposed group; +, VPA-exposed group). (G) IF images detecting PSD95 expression between saline-exposed and VPA-exposed groups. (H,I) IF quantitative analysis revealed expression of PSD95 decreased significantly of VPA-exposed group compared with the saline group. (J) Quantitative analysis of protein level of PSD95 of Western blot. (K) Representative Western blot image of PSD95 expression (–, saline-exposed group; +, VPA-exposed group). Scale bar = 5 μm. Data are presented as the mean ± SEM. *p < 0.05 and **p < 0.01 vs. saline-exposed group by two-tailed unpaired Student’s t-test.
FIGURE 5
FIGURE 5
The structure of excitatory synapses and inhibitory synapses in ACC were impaired at P14. (A) IF images detecting VGLUT1 expression between saline-exposed and VPA-exposed groups. (B,C) IF quantitative analysis revealed expression of VGLUT1 changed significantly between saline-exposed group and VPA-exposed group. (D) Quantitative analysis of protein level of VGLUT1 of Western blot. (E) Representative Western blot image of VGLUT1 expression (–, saline-exposed group; +, VPA-exposed group). (F) IF images detecting PSD95 expression between saline-exposed and VPA-exposed groups. (G,H) IF quantitative analysis revealed expression of PSD95 changed significantly between saline-exposed group and VPA-exposed group. (I) Quantitative analysis of protein level of PSD95 of Western blot. (J) Representative Western blot image of PSD95 expression (–, saline-exposed group; +, VPA-exposed group). (K) IF images detecting VGAT expression between saline-exposed and VPA-exposed groups. (L,M) IF quantitative analysis revealed expression of VGAT changed between saline-exposed group and VPA-exposed group. (N) Quantitative analysis of protein level of VGAT of Western blot. (O) Representative Western blot image of VGAT expression (–, saline-exposed group; +, VPA-exposed group). (P) IF images detecting gephyrin expression between saline-exposed and VPA-exposed groups. (Q,R) IF quantitative analysis revealed expression of gephyrin changed between saline-exposed group and VPA-exposed group. (S) Quantitative analysis of protein level of gephyrin of Western blot. (T) Representative Western blot image of gephyrin expression (–, saline-exposed group; +, VPA-exposed group). Scale bar = 5 μm. Data are presented as the mean ± SEM. *p < 0.05, **p < 0.01, and ***p < 0.001 vs. saline-exposed group by two-tailed unpaired Student’s t-test.
FIGURE 6
FIGURE 6
The structure of excitatory synapses and inhibitory synapses in ACC were impaired significantly at the late period of development. (A) IF images detecting VGLUT1 expression between saline-exposed and VPA-exposed groups. (B,C) IF quantitative analysis revealed expression of VGLUT1 changed significantly between saline-exposed group and VPA-exposed group. (D) Quantitative analysis of protein level of VGLUT1 of Western blot. (E) Representative Western blot image of VGLUT1 expression (–, saline-exposed group; +, VPA-exposed group). (F) IF images detecting PSD95 expression between saline-exposed and VPA-exposed groups. (G,H) IF quantitative analysis revealed expression of PSD95 changed significantly between saline-exposed group and VPA-exposed group. (I) Quantitative analysis of protein level of PSD95 of Western blot. (J) Representative Western blot image of PSD95 expression (–, saline-exposed group; +, VPA-exposed group). (K) IF images detecting VGAT expression between saline-exposed and VPA-exposed groups. (L,M) IF quantitative analysis revealed expression of VGAT changed between saline-exposed group and VPA-exposed group. (N) Quantitative analysis of protein level of VGAT of Western blot. (O) Representative Western blot image of VGAT expression (–, saline-exposed group; +, VPA-exposed group). (P) IF images detecting gephyrin expression between saline-exposed and VPA-exposed groups. (Q,R) IF quantitative analysis revealed expression of gephyrin changed between saline-exposed group and VPA-exposed group. (S) Quantitative analysis of protein level of gephyrin of Western blot. (T) Representative Western blot image of gephyrin expression (–, saline-exposed group; +, VPA-exposed group). Scale bar = 5 μm. Data are presented as the mean ± SEM. *p < 0.05, **p < 0.01, ***p < 0.001, and ****p < 0.0001 vs. saline-exposed group by two-tailed unpaired Student’s t-test.
FIGURE 7
FIGURE 7
BDNF expression changed in VPA-exposed group in vivo and it influenced excitatory and inhibitory synapses developmental plasticity in vitro. (A) Representative Western blot images of BDNF expression (–, saline-exposed group; +, VPA-exposed group) at P7, P14, and P30. (B) Quantitative analysis of protein levels of BDNF of Western blot. *p < 0.05 and **p < 0.01 vs. saline-exposed group by two-tailed unpaired Student’s t-test. (C) Timeline of siRNA transfection to primary cell culture. (D) qRT-PCR result showed siRNA transfection in primary cell culture silencing BDNF mRNA expression. (E) Typical IF images of primary cell culture exposed to siNC (negative control, left) and siBDNF (right). Scale bar = 10 μm. (F) Quantification of morphological difference. Total length of dendrites (left) and numbers of dendrites (right) were decreased in siBDNF group. (G) Typical IF images of CaMKII expression of primary cell culture exposed to siNC (left) and siBDNF (right) after 12 DIV (Scale bar = 10 μm). Insets are the enlarged image of dashed areas in each figure (Scale bar = 5 μm). (H) IF quantitative analysis revealed expression of CaMKII changed significantly between siNC and siBDNF group. (I) Typical IF images of GABA expression of primary cell culture exposed to siNC (left) and siBDNF (right) after 12 DIV (Scale bar = 10 μm). Insets are an enlarged image of dashed areas in each figure (Scale bar = 5 μm). (J) IF quantitative analysis revealed expression of GABA changed significantly between siNC and siBDNF group. *p < 0.05, **p < 0.01, and ****p < 0.0001 vs. siNC group by two-tailed unpaired Student’s t-test. (K) Typical IF images of primary cell culture from embryos exposed to saline (left) or VPA (right) prenatally after 3 DIV. Scale bar = 5 μm. (L) Typical IF images of primary cell culture from embryos exposed to saline (left) or VPA (middle) or VPA+BDNF (BDNF added in 3 DIV, right) prenatally after 6 DIV. Scale bar = 5 μm. (M) Timeline of BDNF treatment to primary cell culture. (N) Quantification of the total length of dendrites between embryos exposed to saline or VPA prenatally after 3 DIV. (O) Quantification of length of longest dendrites (left) and total length of dendrites (right) between saline or VPA or VPA+BDNF groups after 6 DIV. Measurement in length and number of dendrites used Imaris 7.4.2. (N) **p < 0.01 vs. saline-exposed group by two-tailed unpaired Student’s t-test except. (O) *p < 0.05 and ***p < 0.001 vs. saline-exposed group by one-way ANOVA. Data are presented as the mean ± SEM.
FIGURE 8
FIGURE 8
BDNF improved E/I balance to remit social deficit by regulating synaptic function. (A) Left: scheme of BDNF treatment and tests applied after treatment. Right: scheme of ACC area target with BDNF injection. Scale bar = 200 μm. (B) Left: representative Western blot image of BDNF expression (–, VPA/saline group; +, VPA/BDNF group). Right: quantitative analysis of protein level of BDNF of Western blot. (C) Representative heat maps showing alteration in locomotion and sociability in three chamber. Left: VPA/saline group; right: VPA/BDNF group. (D) Left: time spent in the social zone between VPA/saline group and VPA/BDNF group. Right: time spent in the stranger zone between VPA/saline group and VPA/BDNF group. (E) Left: time spent in social zone of VPA-exposed group before and after BDNF treatment. Right: time spent in stranger zone of VPA-exposed group before and after BDNF treatment. (F) Representative heat maps showing alteration in locomotion and social preference in three chamber. Left: VPA/saline group; right: VPA/BDNF group. (G) Representative mEPSC traces in ACC pyramidal neurons at P30 after treatment (VPA: VPA/saline group; VPA+BDNF: VPA/BDNF group). (H) Summary data for mEPSCs frequency and peak amplitude in ACC pyramidal neurons after treatment (–, VPA/saline group; +, VPA/BDNF group) (n = 9 neurons, 3 mice in each groups). (I) Representative mIPSC traces in ACC pyramidal neurons at P30 after treatment (VPA: VPA/saline group; VPA+BDNF: VPA/BDNF group). (J) Summary data for mIPSCs frequency and peak amplitude in ACC pyramidal neurons after treatment (–, VPA/saline group; +, VPA/BDNF group) (n = 9 neurons, 3 mice in each groups). (K) Showed E/I ratio of frequency and amplitude after treatment (–, VPA/saline group; +, VPA/BDNF group). (L) Representative Western blot images of VGLUT1 and PSD95 expression (–, VPA/saline group; +, VPA/BDNF group). (M) Left: quantitative analysis of protein level of VGLUT1 of Western blot. Right: quantitative analysis of protein level of PSD95 of Western blot. (N) Representative Western blot images of VGAT and gephyrin expression (–, VPA/saline group; +, VPA/BDNF group). (O) Left: quantitative analysis of protein level of VGAT of Western blot. Right: quantitative analysis of protein level of gephyrin of Western blot. Data are presented as the mean ± SEM. *p < 0.05, **p < 0.01, and ***p < 0.001 between VPA/saline group and VPA/BDNF group by two-tailed unpaired Student’s t-test except (E) was conducted with two-tailed paired Student’s t-test.

Similar articles

Cited by

References

    1. Aguado F., Carmona M. A., Pozas E., Aguilo A., Martinez-Guijarro F. J., Alcantara S., et al. (2003). BDNF regulates spontaneous correlated activity at early developmental stages by increasing synaptogenesis and expression of the K+/Cl- co-transporter KCC2. Development 130 1267–1280. 10.1242/dev.00351 - DOI - PubMed
    1. Al-Amin M. M., Rahman M. M., Khan F. R., Zaman F., Mahmud Reza H. (2015). Astaxanthin improves behavioral disorder and oxidative stress in prenatal valproic acid-induced mice model of autism. Behav. Brain Res. 286 112–121. 10.1016/j.bbr.2015.02.041 - DOI - PubMed
    1. Alo R., Olivito I., Fazzari G., Zizza M., Di Vito A., Avolio E., et al. (2021). Correlation of distinct behaviors to the modified expression of cerebral Shank1,3 and BDNF in two autistic animal models. Behav. Brain Res. 404:113165. 10.1016/j.bbr.2021.113165 - DOI - PubMed
    1. Antoine M. W., Langberg T., Schnepel P., Feldman D. E. (2019). Increased excitation-inhibition ratio stabilizes synapse and circuit excitability in four autism mouse models. Neuron 101 648–661e4. 10.1016/j.neuron.2018.12.026 - DOI - PMC - PubMed
    1. Apps M. A., Rushworth M. F., Chang S. W. (2016). The anterior cingulate gyrus and social cognition: tracking the motivation of others. Neuron 90 692–707. 10.1016/j.neuron.2016.04.018 - DOI - PMC - PubMed

LinkOut - more resources