. 2021 Dec 8;1(3):100067.
doi: 10.1016/j.xgen.2021.100067.

Molecular analysis of TCGA breast cancer histologic types

Affiliations

Molecular analysis of TCGA breast cancer histologic types

Aatish Thennavan et al. Cell Genom. .

Abstract

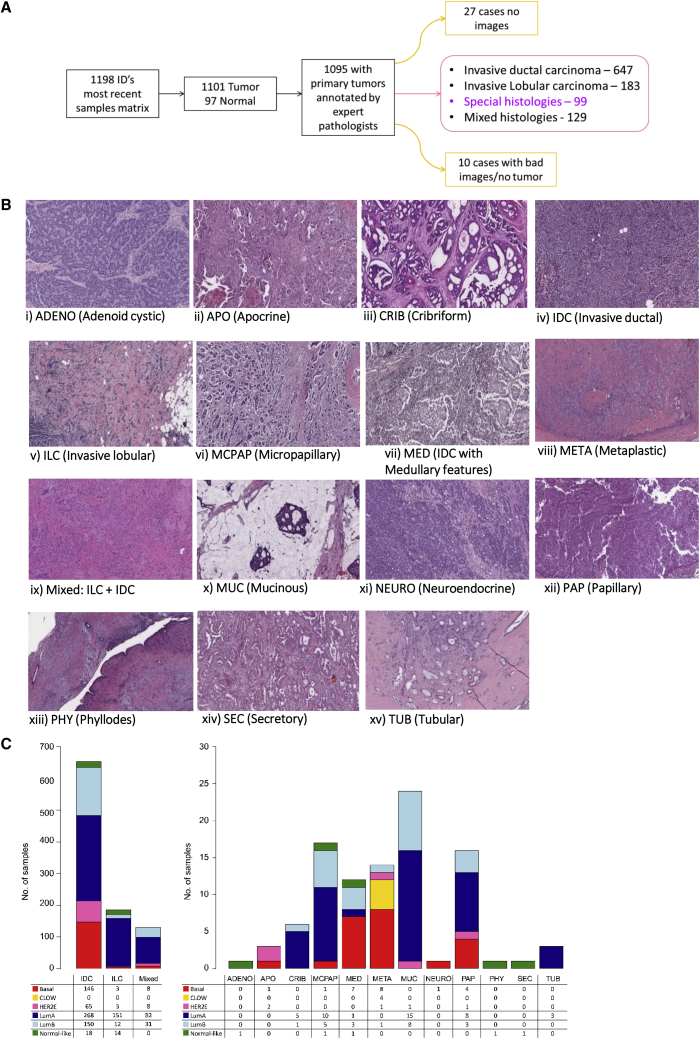
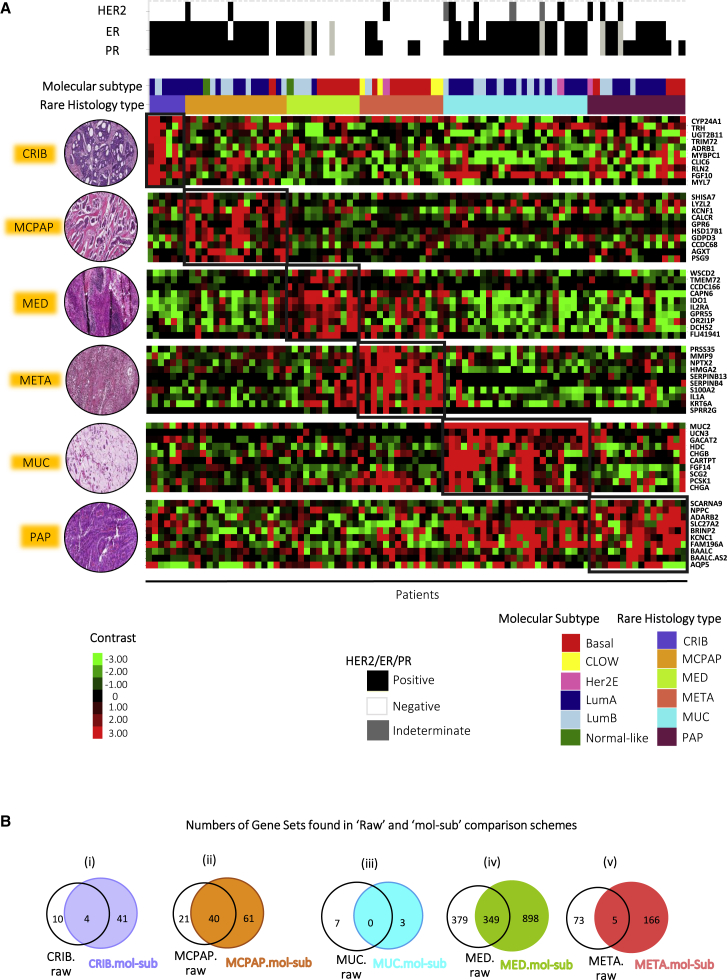
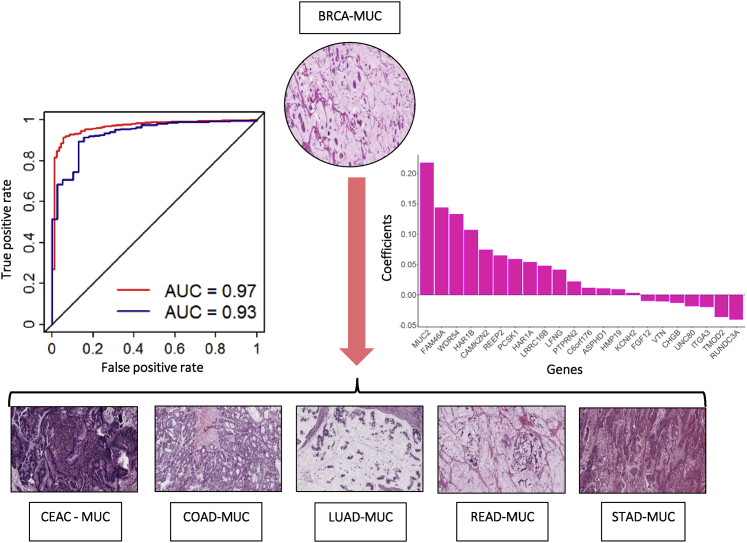
Breast cancer is classified into multiple distinct histologic types, and many of the rarer types have limited characterization. Here, we extend The Cancer Genome Atlas Breast Cancer (TCGA-BRCA) dataset with additional histologic type annotations, in a total of 1063 breast cancers. We analyze this extended dataset to define transcriptomic and genomic profiles of six rare special histologic types: cribriform, micropapillary, mucinous, papillary, metaplastic, and invasive carcinoma with medullary pattern. We show the broader applicability of our constructed special histologic type gene signatures in the TCGA Pan-Cancer Atlas dataset with a predictive model that detects mucinous histologic type across cancers of other organ systems. Using a normal mammary cell differentiation score analysis, we order histologic types into a continuum from stem cell-like to luminal progenitor-like to mature luminal-like. Finally, we classify TCGA-BRCA into 12 consensus groups based on integrated genomic and histological features. We present a rich openly accessible resource of histologic and genomic characterization of TCGA-BRCA to enable studies of the range of breast cancers.


Conflict of interest statement

C.M.P. is an equity stockholder and consultant of BioClassifier LLC; C.M.P. is also listed as an inventor on patent applications for the Breast PAM50 Subtyping assay.

Figures

None
Graphical abstract
Figure 1
Figure 1
Histopathologic annotation schema and overall distribution of all histopathologic types of breast cancer according to molecular subtype in TCGA (A) Schematic of TCGA-BRCA histopathological annotation schema, with 99 samples classified into special histologic types and their representative hematoxylin and eosin (H&E)-stained photomicrographs of all the annotated TCGA-BRCA histologic types (n = 1,058; magnification 20×). (B) Distribution of all 1,095 TCGA-BRCA primary breast cancer patients according to re-annotated histologic type and the PAM50 molecular subtype (Basal, LumA, LumB, HER2E, and normal-like), including claudin low (CLOW). (C) ADENO, adenoid cystic carcinoma (n = 1); APO, apocrine carcinoma (n = 3); CRIB, cribriform carcinoma (n = 6); IDC, invasive ductal carcinoma not otherwise specified (n = 647); ILC, invasive lobular carcinoma (n = 183); MCPAP, micropapillary carcinoma (n = 17); MED, invasive carcinoma with medullary features (n = 12); META, metaplastic carcinoma (n = 14), MUC, mucinous carcinoma (n = 24), NEURO, neuroendocrine carcinoma (n = 1); PAP, papillary carcinoma (n = 16); PHY, phyllodes tumor (n = 1); SEC, secretory carcinoma (n = 1); TUB, tubular carcinoma (n = 3); mixed, a combination of more than one histologic type (n = 129); LumA, luminal A subtype; LumB, luminal B subtype; HER2E, HER2-enriched subtype.
Figure 2
Figure 2
Upregulated genes from the “raw” and “mol-subtype” comparisons for each of the six special histologic types of breast cancer (A) Heatmap representation of the top ten upregulated genes in the “raw” gene signatures constructed for 89 patients of CRIB (n = 6), MCPAP (n = 17), MED (n = 12), META (n = 14), MUC (n = 24), and PAP (n = 16) histologic subtypes (Bonferroni adjusted p value < 0.0001) along with important clinicopathological parameters like estrogen receptor (ER) status, progesterone receptor (PR) status, human epidermal growth factor receptor 2 (HER2) status, and American Joint Committee on Cancer (AJCC) stage for the respective histologies. (B) Venn diagrams showing the gene sets enriched via GSEA in “raw” versus “mol-sub” comparisons for respective special histologic types (FDR < 0.05).
Figure 3
Figure 3
Construction of a special histologic type-specific gene list that groups breast cancer patient samples according to histologic type (A) Supervised clustering utilizing the "upregulated mol-sub" intrinsic histologic gene list clusters samples predominately according to special histologic types with clustering driven by MCPAP-, META-, MED-, and MUC-associated genes and biological pathways (n = 89). (B and C) Supervised clustering utilizing the "upregulated mol-sub" intrinsic histologic gene list clusters samples predominately according to special histologic types and not according to the intrinsic molecular subtypes in the METABRIC (n = 78) (B) and NKI datasets (n = 57) (C).
Figure 4
Figure 4
Elastic net modeling using breast mucinous carcinoma genes predicts mucinous carcinomas of other cancer types in the TCGA Pan-Cancer Atlas dataset Schematic illustration of elastic net model for mucinous carcinoma histologic predictions in the TCGA Pan-Cancer Atlas dataset, containing 132 mucinous carcinomas from various organ systems. Solid red line, AUC for the training dataset; solid blue line, AUC for the testing dataset. At right, a bar plot of the coefficients of genes from the breast mucinous gene signature, in descending order, showing positive and negative contribution of genes in the mucinous histologic predictor. CEAC, cervical adenocarcinoma; COAD, colon adenocarcinoma; LUAD, lung adenocarcinoma; READ, rectal adenocarcinoma; STAD, stomach adenocarcinoma. All representative photomicrographs are of 10× magnification.
Figure 5
Figure 5
Metaplastic carcinomas of breast group away from other breast carcinomas into other subtypes dictated by their predominant type of metaplasia (A) Tabular representation of TCGA-BRCA samples according to the pan-cancer cluster of cluster assignment (CoCA) groups and histologic types. Colored rows represent breast samples clustering out of the predominant breast CoCA group. (B) Representative disease correlation using top upregulated genes obtained after differentially expressed (DE) gene analysis between META-squamous group versus META (right panel) and META-sarcoma group versus META (left panel). PAAD, TCGA pancreatic adenocarcinoma; SARC, TCGA sarcomas; Pan-Squam, TCGA pan-squamous group; LAML, TCGA acute myeloid leukemia; BRCA, TCGA breast cancer; multiple, no specific TCGA cancer study; B&H, Benjamini-Hochberg adjusted; FDR, false discovery rate.
Figure 6
Figure 6
Histologic types of breast cancer can be grouped based on normal mammary cell type differentiation score (D score), specific CNA events, mutation events, and immunologic gene signatures (A) Box-and-whisker plots of the 12 consensus groups defined by histology and gene expression (x axis) using the D score (y axis) indicate the median score (horizontal line), the interquartile range (IQR, box boundaries), and 1.5 times the IQR (whiskers). The heatmap indicates the clustering of the 7,000 most variable genes of 886 samples with D score. (B) Bar plots of significant CNA events high in “high differentiation” and “low differentiation” histologic groups. (C) Bar plots of significant CNA events unique to “high differentiation” versus “luminal” group. (D) Bar plot of Tp53 and Gata3 mutation events in the 12 biologically relevant breast cancer groups. (E) Box-and-whisker plots of the GSEA PD1 and IgG transcriptomic signatures (fourth row); median score (horizontal line), the interquartile range (IQR, box boundaries), and 1.5 times the IQR (whiskers). Broad groups are separated by dotted colored lines: brown, IDC-Basal; red, low differentiation group (MED, META); green, luminal group (IDC-HER2E, ILC-Luminal, MCPAP, IDC-LumA, IDC-LumB); blue, high differentiation group (MUC, CRIB, PAP-Luminal). MaSC, mammary stem cells. The original FACS-sorted population nomenclature and cell surface markers that the D score was based upon are highlighted. See also Table S7, Data S6, and Figures S4 and S5.
Figure 7
Figure 7
A TCGA breast cancer classification based on molecular and histologic features combined Schematic representation of 12 consensus groups defined by histology and gene expression analyses of the TCGA-BRCA dataset and organized by differentiation (D) score. These groups are connected by an outer ring based on D score (lowest differentiation to highest differentiation arranged in anticlockwise direction). From the D score ring inward: The second ring exhibits PAM50 subtype association with D score (red, basal; pink, HER2E; blue, LumA and LumB; yellow, claudin low). The next ring highlights the proliferation gene signature, which is high in all biological groups with a low D score but also in one group with a high D score, namely IDC-LumB. The next two rings represent the descending abundance of CNA events (4p loss, 2p gain) and mutation events (Tp53 mutation) associated with ascending D score. The final ring exhibits decreasing immunological gene signatures in relation to ascending D score. The innermost pie chart exhibits the clinical immunohistochemistry status found in these 12 breast cancer consensus groups.

References

    1. Tan P.H., Ellis I., Allison K., Brogi E., Fox S.B., Lakhani S., Lazar A.J., Morris E.A., Sahin A., Salgado R., et al. WHO Classification of Tumours Editorial Board The 2019 World Health Organization classification of tumours of the breast. Histopathology. 2020;77:181–185. doi: 10.1111/his.14091. - DOI - PubMed
    1. WHO . WHO Classification of Tumours. Fifth Edition. Volume 2. WHO; 2019. Breast Tumours.
    1. Dieci M.V., Orvieto E., Dominici M., Conte P., Guarneri V. Rare breast cancer subtypes: histological, molecular, and clinical peculiarities. Oncologist. 2014;19:805–813. doi: 10.1634/theoncologist.2014-0108. - DOI - PMC - PubMed
    1. Weigelt B., Horlings H.M., Kreike B., Hayes M.M., Hauptmann M., Wessels L.F., de Jong D., Van de Vijver M.J., Van’t Veer L.J., Peterse J.L. Refinement of breast cancer classification by molecular characterization of histological special types. J. Pathol. 2008;216:141–150. - PubMed
    1. Weigelt B., Geyer F.C., Reis-Filho J.S. Histological types of breast cancer: how special are they? Mol. Oncol. 2010;4:192–208. - PMC - PubMed