. 2022 Jun;10(3):e00952.
doi: 10.1002/prp2.952.

Docosahexaenoic acid and eicosapentaenoic acid strongly inhibit prostanoid TP receptor-dependent contractions of guinea pig gastric fundus smooth muscle

Affiliations

Docosahexaenoic acid and eicosapentaenoic acid strongly inhibit prostanoid TP receptor-dependent contractions of guinea pig gastric fundus smooth muscle

Keyue Xu et al. Pharmacol Res Perspect. 2022 Jun.

Abstract

The inhibitory effects of docosahexaenoic acid (DHA), eicosapentaenoic acid (EPA), and linoleic acid (LA) on the contractions induced by five prostanoids and U46619 (a TP receptor agonist) were examined in guinea pig gastric fundus smooth muscle (GFSM). Tension changes were isometrically measured, and the mRNA expression of prostanoid receptors was measured by RT-qPCR. DHA and EPA significantly inhibited contractions induced by the prostanoids and U46619, whereas LA inhibited those induced by prostaglandin D2 and U46619. The mRNA expression levels of the prostanoid receptors were TP ≈ EP3 >> FP > EP1 . The inhibition by DHA, EPA, and LA was positively correlated with that by SQ 29,548 (a TP receptor antagonist) but not with that by L-798,106 (an EP3 receptor antagonist). DHA and EPA suppressed high KCl-induced contractions by 35% and 25%, respectively, and the contractions induced by the prostanoids and U46619 were suppressed by verapamil, a voltage-dependent Ca2+ channel (VDCC) inhibitor, by 40%-85%. Although LA did not suppress high KCl-induced contractions, it suppressed U46619-induced contractions in the presence of verapamil. However, LA did not show significant inhibitory effects on U46619-induced Ca2+ increases in TP receptor-expressing cells. In contrast, LA inhibited U46619-induced contractions in the presence of verapamil, which was also suppressed by SKF-96365 (a store-operated Ca2+ channel [SOCC] inhibitor). These findings suggest that the TP receptor and VDCC are targets of DHA and EPA to inhibit prostanoid-induced contractions of guinea pig GFSM, and SOCCs play a significant role in LA-induced inhibition of U46619-induced contractions.

Keywords: docosahexaenoic acid; eicosapentaenoic acid; gastric fundus smooth muscle; n−3 polyunsaturated fatty acids; prostanoid TP receptor; prostanoids.


Figures

FIGURE 1
FIGURE 1
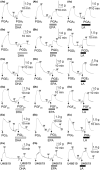
Representative traces showing the effects of docosahexaenoic acid (DHA, a), eicosapentaenoic acid (EPA, b), and linoleic acid (LA, c) (each 3 × 10−5 M) on guinea pig gastric fundus smooth muscle contractions induced by prostaglandin (PG) A2 (3 × 10−6 M, A), PGD2 (3 × 10−6 M, B), PGE2 (10−7 M, C), PGF (10−6 M, D), PGI2 (10−6 M, E), and U46619 (3 × 10−6 M, F). w, wash out
FIGURE 2
FIGURE 2
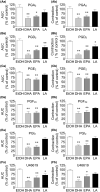
Quantified data of the effect of ethanol (EtOH, 0.1%), docosahexaenoic acid (DHA), eicosapentaenoic acid (EPA), and linoleic acid (LA) (each 3 × 10−5 M) on the area under the curve for 10 min (AUC, a) and maximum contractions (b) of guinea pig gastric fundus smooth muscle responses induced by prostaglandin (PG) A2 (3 × 10−6 M, A), PGD2 (3 × 10−6 M, B), PGE2 (10−7 M, C), PGF (10−6 M, D), PGI2 (10−6 M, E), and U46619 (3 × 10−6 M, F) shown in Figure 1. Data are expressed as the means ± SEM. (n = 13 (LA in F), n = 7 (EPA in F), n = 6 (LA in B), and n = 5 (all others)). *p < .05, **p < .01 versus EtOH (post hoc Dunnett's test after one‐way ANOVA)
FIGURE 3
FIGURE 3
Comparison of prostanoid receptor mRNA expression levels in guinea pig gastric fundus smooth muscle. The mRNA expression levels of TP (Tbxa2r), FP (Ptgfr), EP1 (Ptger1), EP2 (Ptger2), EP3 (Ptger3), EP4 (Ptger4), DP1 (Ptgdr), DP2 (Ptgdr2), and IP (Ptgir) receptors were determined using RT‐qPCR. The expression level of each mRNA is shown relative to the mRNA expression level of glyceraldehyde 3phosphate dehydrogenase (Gapdh), which is set as 1. Data are expressed as the means ± SEM (n = 5 each)
FIGURE 4
FIGURE 4
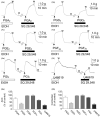
Representative traces (A) and quantified data (B) showing the effects of SQ 29,548 (3 × 10−5 M) on the area under the curve (AUC, Ba) and maximum contractions (Bb) of guinea pig gastric fundus smooth muscle responses induced by prostaglandin (PG) A2 (3 × 10−6 M, Aa), PGD2 (3 × 10−6 M, Ab), PGE2 (10−7 M, Ac), PGF (10−6 M, Ad), PGI2 (10−6 M, Ae), and U46619 (3 × 10−6 M, Af). Data are expressed as the means ± SEM (n = 11 (PGF), n = 10 (PGD2 and PGI2), and n = 5 (all others)). EtOH, ethanol (1.5%); w, wash out
FIGURE 5
FIGURE 5
Representative traces (A) and quantified data (B) showing the effects of L‐798,106 (3 × 10−7 M) on the area under the curve (AUC, Ba) and maximum contractions (Bb) of guinea pig gastric fundus smooth muscle responses induced by prostaglandin (PG) A2 (3 × 10−6 M, Aa), PGD2 (3 × 10−6 M, Ab), PGE2 (10−7 M, Ac), PGF (10−6 M, Ad), and PGI2 (10−6 M, Ae) in the presence of SQ 29,548 (3 × 10−5 M). Data are expressed as the means ± SEM (n = 12 (PGD2 and PGI2), n = 10 (PGF), and n = 5 (all others)). *p < .05, **p < .01 versus SQ 29,548 + DMSO (multiple t‐tests). EtOH: ethanol (1.5%); DMSO, dimethyl sulfoxide (0.015%); w, wash out
FIGURE 6
FIGURE 6
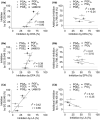
Relationships between the inhibitory effects of docosahexaenoic acid (DHA) (A), eicosapentaenoic acid (EPA) (B), and linoleic acid (LA) (C) on the area under the curve (AUC) of the contractions induced by prostanoids and U46619 (shown in Figure 2Aa–Fa) versus the inhibitory effects of SQ 29,548 on those contractions (shown in Figure 4Ba) (a) and versus the additional inhibitory effects of L‐798,106 on those contractions in the presence of SQ 29,548 (shown in Figure 5Ba) (b). Data are expressed as the means ± SEM. r: correlation coefficient; r 2: coefficient of determination
FIGURE 7
FIGURE 7
Effects of docosahexaenoic acid (DHA) (A) and eicosapentaenoic acid (EPA) (B) on the concentration‐response curve of U46619. (a) Summarized data of the effects of DHA (10−5 M and 3 × 10−5 M) on the concentration‐response curves of U46619. Data are presented as means ± SEM (n = 12 for control of Aa, n = 6 for 10−5 M DHA, n = 6 for 3 × 10−5 M DHA, n = 23 for control of Ba, n = 11 for 10−5 M EPA, n = 12 for 3 × 10−5 M EPA). (b) Schild plot analysis of DHA (A)/EPA (B) versus U46619. The slope and pA 2 values are presented as means with 95% confidence intervals (n = 12 for Ab and n = 22 for Bb)
FIGURE 8
FIGURE 8
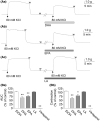
Representative traces (A) and quantified data (B) showing the effects of docosahexaenoic acid (DHA) (Aa), eicosapentaenoic acid (EPA) (Ab), and linoleic acid (LA) (Ac) (each 3 × 10−5 M) on the area under the curve (AUC) (Ba) and contractions (Bb) of guinea pig gastric fundus smooth muscle responses induced by 80 mM KCl. The quantified data of the effects of ethanol (EtOH, 0.1%) and verapamil (10−5 M) on those responses are also shown in Ba and Bb. Data are expressed as the means ± SEM (n = 7 (EPA) and n = 5 (all others)). *p < .05, **p < .01 versus EtOH (post hoc Dunnett's test after one‐way ANOVA). w, wash out
FIGURE 9
FIGURE 9
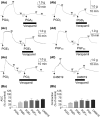
Representative traces (A) and quantified data (B) showing the effects of verapamil (10−5 M) on the area under the curve (AUC) (Ba) and maximum contractions (Bb) of guinea pig gastric fundus smooth muscle contractions induced by prostaglandin (PG) A2 (3 × 10−6 M, Aa), PGD2 (3 × 10−6 M, Ab), PGE2 (10−7 M, Ac), PGF (10−6 M, Ad), PGI2 (10−6 M, Ae), and U46619 (3 × 10−6 M, Af). Data are expressed as the means ± SEM (each n = 5). w, wash out
FIGURE 10
FIGURE 10
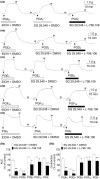
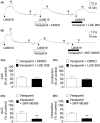
Representative traces (A, B) and quantified data (C, D) showing the effects of LOE 908 (3 × 10−5 M, A, C) and SKF‐96365 (3 × 10−5 M, B, D) on the area under the curve (AUC) (a) and maximum contractions (b) of guinea pig gastric fundus smooth muscle contractions induced by U46619 (3 × 10−6 M) in the presence of verapamil (10−5 M). Data are expressed as the means ± SEM (each n = 5). **p < .01 versus verapamil/verapamil + DMSO (paired t‐tests). DMSO, dimethyl sulfoxide (0.015%); w, wash out

References

    1. Aarsetoey H, Grundt H, Nygaard O, Nilsen DW. The role of long‐chained marine n‐3 polyunsaturated fatty acids in cardiovascular disease. Cardiol Res Pract. 2012;2012:303456. - PMC - PubMed
    1. Bang HO, Dyerberg J, Hjøorne N. The composition of food consumed by Greenland Eskimos. Acta Med Scand. 1976;200(1‐2):69‐73. - PubMed
    1. Manzi L, Costantini L, Molinari R, Merendino N. Effect of dietary ω‐3 polyunsaturated fatty acid DHA on glycolytic enzymes and Warburg phenotypes in cancer. Biomed Res Int. 2015;2015:137097. - PMC - PubMed
    1. Backes J, Anzalone D, Hilleman D, Catini J. The clinical relevance of omega‐3 fatty acids in the management of hypertriglyceridemia. Lipids Health Dis. 2016;15(1):118. - PMC - PubMed
    1. Zárate R, El Jaber‐Vazdekis N, Tejera N, Pérez JA, Rodríguez C. Significance of long chain polyunsaturated fatty acids in human health. Clin Transl Med. 2017;6(1):25. - PMC - PubMed

Publication types

MeSH terms