. 2022 May 25;96(10):e0016522.
doi: 10.1128/jvi.00165-22. Epub 2022 Apr 25.

Temperate Conditions Limit Zika Virus Genome Replication

Affiliations

Temperate Conditions Limit Zika Virus Genome Replication

Blanka Tesla et al. J Virol. .

Abstract

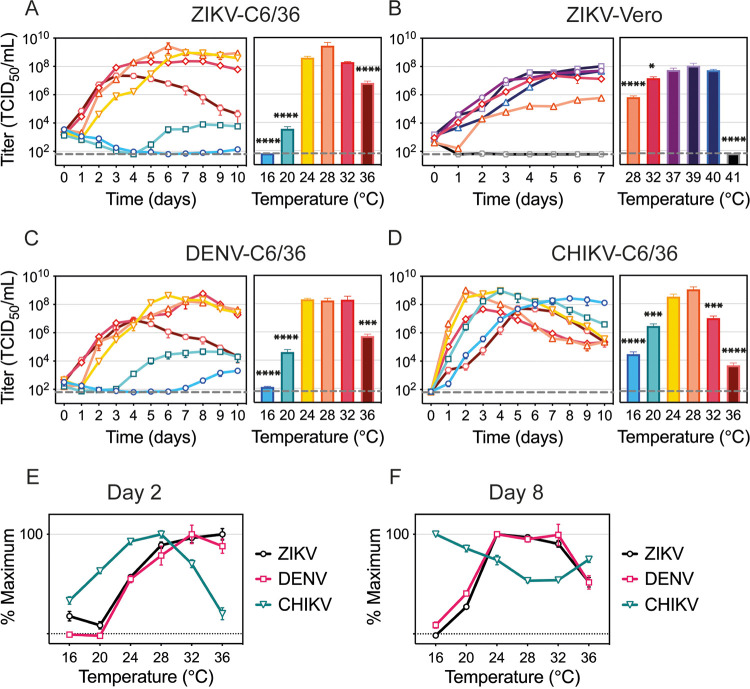
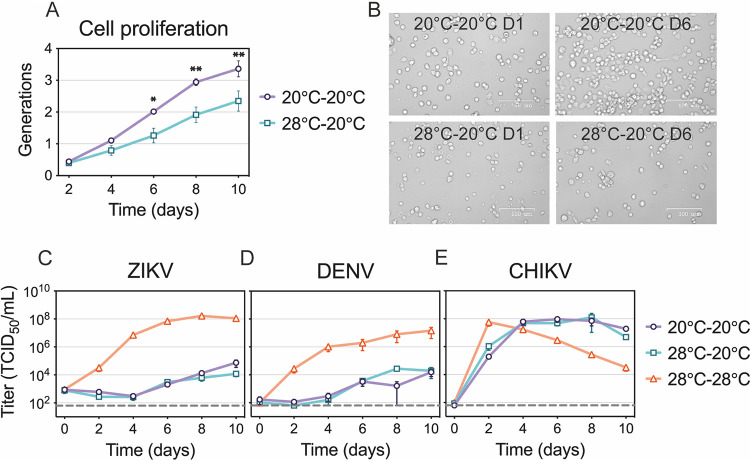
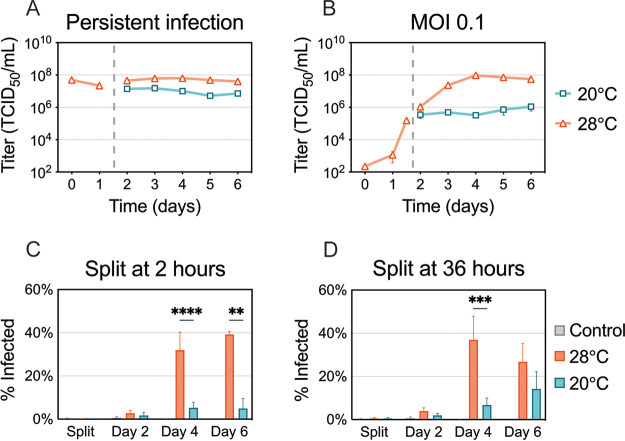
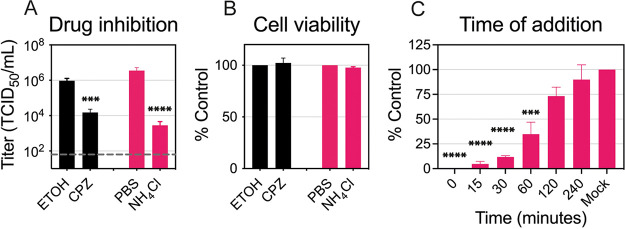
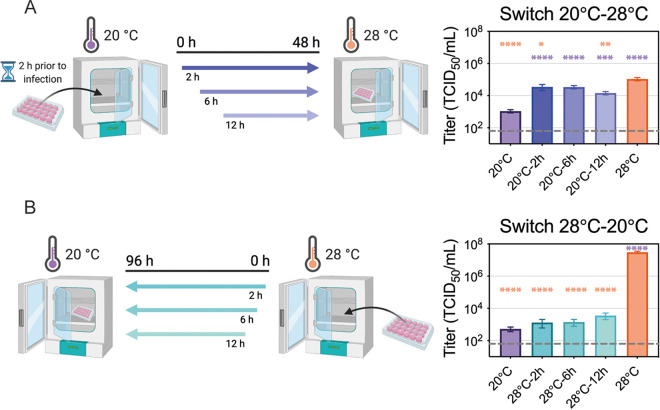
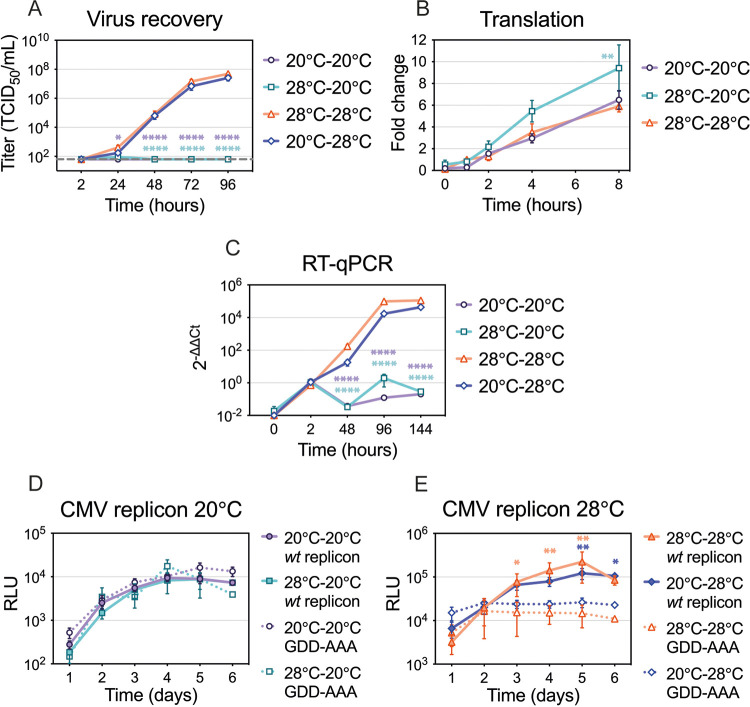
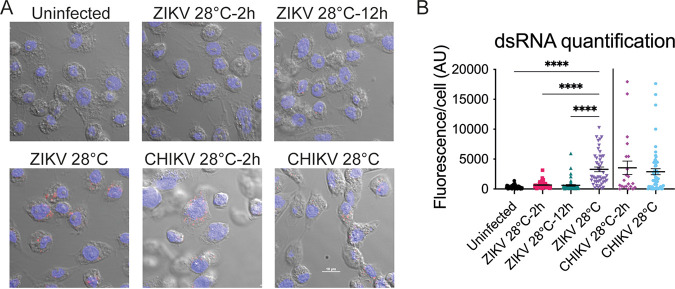
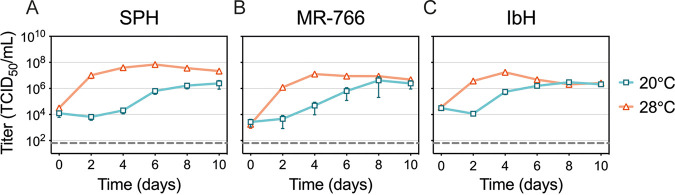
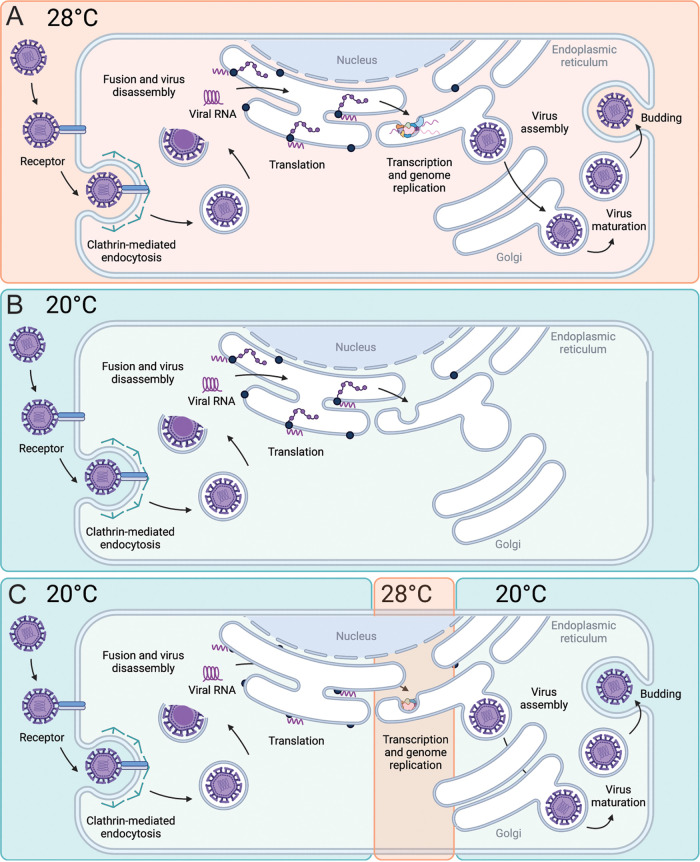
Zika virus is a mosquito-borne flavivirus known to cause severe birth defects and neuroimmunological disorders. We have previously demonstrated that mosquito transmission of Zika virus decreases with temperature. While transmission was optimized at 29°C, it was limited at cool temperatures (<22°C) due to poor virus establishment in the mosquitoes. Temperature is one of the strongest drivers of vector-borne disease transmission due to its profound effect on ectothermic mosquito vectors, viruses, and their interaction. Although there is substantial evidence of temperature effects on arbovirus replication and dissemination inside mosquitoes, little is known about whether temperature affects virus replication directly or indirectly through mosquito physiology. In order to determine the mechanisms behind temperature-induced changes in Zika virus transmission potential, we investigated different steps of the virus replication cycle in mosquito cells (C6/36) at optimal (28°C) and cool (20°C) temperatures. We found that the cool temperature did not alter Zika virus entry or translation, but it affected genome replication and reduced the amount of double-stranded RNA replication intermediates. If replication complexes were first formed at 28°C and the cells were subsequently shifted to 20°C, the late steps in the virus replication cycle were efficiently completed. These data suggest that cool temperature decreases the efficiency of Zika virus genome replication in mosquito cells. This phenotype was observed in the Asian lineage of Zika virus, while the African lineage Zika virus was less restricted at 20°C. IMPORTANCE With half of the human population at risk, arboviral diseases represent a substantial global health burden. Zika virus, previously known to cause sporadic infections in humans, emerged in the Americas in 2015 and quickly spread worldwide. There was an urgent need to better understand the disease pathogenesis and develop therapeutics and vaccines, as well as to understand, predict, and control virus transmission. In order to efficiently predict the seasonality and geography for Zika virus transmission, we need a deeper understanding of the host-pathogen interactions and how they can be altered by environmental factors such as temperature. Identifying the step in the virus replication cycle that is inhibited under cool conditions can have implications in modeling the temperature suitability for arbovirus transmission as global environmental patterns change. Understanding the link between pathogen replication and environmental conditions can potentially be exploited to develop new vector control strategies in the future.

Keywords: RNA replication; Zika virus; temperature.


Conflict of interest statement

The authors declare no conflict of interest.

Figures

FIG 1
FIG 1
Temperature effects on ZIKV, DENV, and CHIKV replication. (A to D) Replication rates for ZIKV in C6/36 cells and titers on day 6 (A), ZIKV in Vero cells and titers on day 7 (B), DENV in C6/36 cells and titers on day 7 (C), and CHIKV in C6/36 cells and titers on day 2 (D). (E and F) Percent maximum titer on day 2 (E) and day 8 (F). C6/36 cells were incubated with ZIKV (MOI, 0.1), DENV (MOI, 0.1), or CHIKV (MOI, 0.005) for 2 h at 28°C, when infectious medium was removed and replaced with fresh medium. The cells were kept at 16°C, 20°C, 24°C, 28°C, 32°C, or 36°C for 10 days. Vero cells were infected with ZIKV (MOI, 0.1) for 1 h at 37°C. The cells were incubated at 28°C, 32°C, 37°C, 39°C, 40°C, or 41°C for 7 days. Supernatants were collected every 24 h and titrated on Vero cells. Titers are given in TCID50 units/mL. Dashed lines represent the limit of detection. Data shown are means ± SEM from three independent replicates for each virus. Bar graphs represent viral titers on the day peak titers were reached at optimal temperature (28°C for C6/36, 37°C for Vero). Statistical differences were determined with a one-way ANOVA on log-transformed data for each experiment. Dunnett’s test was used for multiple comparisons, where the optimal temperature (28°C or 37°C) was compared to all other temperatures. *, P < 0.05; ***, P < 0.001; ****, P < 0.0001.
FIG 2
FIG 2
Temperature and virus effects on cell proliferation, viability, and protein production. (A) Cell proliferation of uninfected or infected C6/36 cells at different temperatures (16°C to 36°C). Dyed cells were infected with ZIKV, DENV, or CHIKV as described in the legend to Fig. 1 and were incubated at one of the six temperatures for 4 days. Intracellular fluorescence was normalized to that of uninfected cells on day 0. Data are presented as the mean ± SEM from three independent experiments. (B) Cell viability of uninfected or infected C6/36 cells incubated at six temperatures (16°C to 36°C) for 6 days. Cell viability was normalized to that of uninfected cells maintained at 28°C, and data are presented as the mean ± SEM from three independent experiments. Statistical differences for cell proliferation and viability were assessed by a two-way ANOVA with Dunnett’s correction for multiple comparisons. For each temperature, uninfected cells were compared to those infected with each virus. (C) Cell viability of uninfected or ZIKV-infected Vero cells incubated at six temperatures (28°C to 41°C) for 4 days. Cell viability was normalized to that of uninfected cells maintained at 37°C, and data are presented as the mean ± SEM from three independent experiments. Statistical differences were determined by a two-way ANOVA, followed by Bonferroni’s test for multiple comparisons. (D) Protein production at each temperature (16°C to 36°C) on days 1 and 3 was assessed after transfection of C6/36 cells with Ac5-STABLE2-neo plasmid. The data shown, expressed as mean GFP fluorescence, are means ± SEM from three replicates. Statistically significant mean fluorescence was assessed by using a two-way ANOVA on log-transformed data, followed by Dunnett’s test for multiple comparisons. For days 1 and 3, 28°C was compared to all other temperatures. The color of the significance symbol corresponds to the color for each day. (E) Total protein lysate was prepared for uninfected C6/36 cells incubated at six temperatures (16°C to 36°C) for 4 days. Seventy-five micrograms of total protein was denatured and run on a TGX Stain-Free gel (Bio-Rad). The gel was activated with UV light and imaged with a ChemiDoc XRS digital imaging system (Bio-Rad). *, P < 0.05; **, P < 0.01; ***, P < 0.001; ****, P < 0.0001.
FIG 3
FIG 3
ZIKV, DENV, and CHIKV replication in 20°C-adapted C6/36 cells. (A and B) Cell proliferation of 20°C-adapted C6/36 cells in comparison to standard cells at 20°C. Both cell types were stained and maintained at 20°C for 10 days. Fluorescence was measured every 2 days and normalized to either 20°C-adapted or standard cells on day 0. Pictures of the cells were taken on days 0 and 6, and representative images are shown in panel B. The data shown are means ± SEM from three replicates. Statistical differences were determined by using a two-way ANOVA with Bonferroni’s correction, where adapted cells were compared to standard cells at each time point. (C to E) Replication rates of ZIKV (C), DENV (D), and CHIKV (E) in 20°C-adapted cells were compared to those of standard cells at 20°C and 28°C. 20°C-adapted cells were infected and kept at 20°C, while standard cells were infected at 28°C and kept at 20°C or 28°C. Supernatants were collected every 48 h and titrated. Dashed lines represent the limit of detection. Data shown are means ± SEM of results from three independent experiments for each virus. *, P < 0.05; **, P < 0.01.
FIG 4
FIG 4
ZIKV production and spread at suboptimal temperature. (A) C6/36 cells with established ZIKV infection were split and incubated at 20°C or 28°C for 5 days. (B) C6/36 cells infected at an MOI of 0.1 were split at 36 h postinfection (p.i.) and incubated at 20°C and 28°C for 5 days. Supernatants were collected and replaced daily, and virus titers were determined. Data shown for persistent ZIKV infection are means ± SEM of results from two biological replicates, each consisting of three technical replicates (n = 6). Data shown for an MOI of 0.1 are means ± SEM of results from three independent experiments. Dashed lines represent when the cells were split. (C and D) The percentage of ZIKV-positive cells was assessed using flow cytometry. (C) Cells were infected with ZIKV (MOI 0.1) for 2 h at 28°C and then split and incubated at 20°C or 28°C. (D) Cells infected with ZIKV were kept at 28°C for 36 h and then split and incubated at 20°C or 28°C. ZIKV-positive cells were measured after splitting (2 or 36 h p.i.) and 2, 4, and 6 days p.i. Data shown are means ± SEM of results from seven independent experiments. Statistical differences were assessed by a two-way ANOVA with Bonferroni’s correction, where cells at 20°C were compared to cells at 28°C at every time point. **, P < 0.01; ***, P < 0.001; ****, P < 0.0001.
FIG 5
FIG 5
ZIKV entry dynamics in C6/36 cells. (A) Drug inhibition assay. CPZ (50 μM) and NH4Cl (25 mM) were added 2 h prior to ZIKV infection (MOI, 0.1) and were kept during infection. After 2 h of incubation at 28°C, the infectious medium with the drug or vehicle was removed and replaced with fresh medium. Supernatants were collected at 48 h p.i. and titrated. The dashed line represents the limit of detection. (B) Cell viability. The cells were treated with the same concentrations of the drug or the same amount of vehicle for 4 h, and ATP levels were measured after 2 days. Data are presented as the mean ± SEM from three independent experiments for each drug. Statistical differences were assessed by using a two-way ANOVA, followed by Bonferroni’s test for multiple comparisons. (C) Time of addition. NH4Cl (25 mM) was added to the ZIKV-infected cells at 0, 15, 30, 60, 120, and 240 min p.i. and kept for 4 h. Supernatants were collected at 48 h p.i. and titrated. Cell titers were normalized to mock infection, and data are presented as the mean ± SEM from three independent experiments. Statistical significance was determined by using a one-way ANOVA on log-transformed data with Dunnett’s correction, where mock infection was compared to the time of drug addition. *, P < 0.05.
FIG 6
FIG 6
ZIKV entry at suboptimal temperature. (A) Cool-to-warm temperature switch. C6/36 cells (6 × 105 cells/mL) were plated and incubated at 20°C 2 h prior to infection. Cells were then inoculated with ZIKV (MOI, 0.1) for 2 h and moved to 28°C at 2, 6, or 12 h p.i. As a control, one set of cells was maintained at 20°C while another was maintained at 28°C throughout the experiment. Supernatants were collected at 48 h p.i. and titrated. (B) Warm-to-cool temperature switch. C6/36 cells were plated at the same density as described for panel A and infected with ZIKV (MOI, 0.1) for 2 h. The cells were transferred from 28°C to 20°C at 2, 6, or 12 h p.i. As a control, one set of cells was maintained at 28°C while another was maintained at 20°C throughout the experiment. Supernatants were collected at 96 h p.i. and titrated. Dashed lines represent the limit of detection. Experimental designs were created with BioRender.com. Data are presented as the mean ± SEM from three replicates for each experiment. Statistical differences were determined by a one-way ANOVA on log-transformed data, followed by Dunnett’s test for multiple comparisons, where each condition was compared to both 20°C (purple significance symbol) and 28°C (orange significance symbol) controls. *, P < 0.05; **, P < 0.01; ***, P < 0.001; ****, P < 0.0001.
FIG 7
FIG 7
Virus recovery, translation, and replication at suboptimal temperature. (A) Virus recovery. Standard and 20°C-adapted cells were transfected with ZIKV RNA at their respective temperatures for 1 h. After transfection, one plate with standard cells was kept at 28°C and one was transferred to 20°C, and one plate with 20°C-adapted cells was kept at 20°C and one was transferred to 28°C. Supernatants were collected and titrated at the indicated time points. The dashed line represents the limit of detection. Data are presented as the mean ± SEM from at least three independent experiments. (B) Translation. Standard and 20°C-adapted C6/36 cells were transfected with a translation reporter construct at their respective temperatures. One plate with standard cells was kept at 28°C and one was switched to 20°C 1 h after transfection, while 20°C-adapted cells were kept at 20°C. At the indicated time points, cells were lysed and luminescence was measured. Luminescence was normalized to the 28°C control at 1 h after transfection. Data shown are means ± SEM from three independent experiments, each performed in duplicate wells. (C) Reverse transcription (RT)-qPCR. Standard and 20°C-adapted cells were infected with ZIKV (MOI, 0.1) at their respective temperatures for 2 h. After the virus inoculum was removed, one plate with standard cells was kept at 28°C and one was transferred to 20°C, and one plate with 20°C-adapted cells was kept at 20°C and one was transferred to 28°C. At the indicated time points, cell lysates were collected, RNA was isolated and reversed transcribed to cDNA, and genome copies were measured by using a qPCR. ZIKV copy numbers were compared to RPL32 transcripts (2−ΔΔCT) and normalized to 2 h after infection. Data shown are means ± SEM from three independent experiments, and each qPCR was performed in duplicate wells. Statistical significance was assessed by using a two-way ANOVA with Dunnett’s correction (data were first log transformed for panels A and C). For each time point, standard cells kept at 28°C (28°C-28°C) were compared to all other conditions. (D and E) ZIKV replicon. Standard and 20°C-adapted C6/36 cells were transfected with a CMV-driven ZIKV replicon or a control replicon containing a GDD-AAA mutation in NS5. Two plates were kept at their respective temperatures, and two were placed in the opposite-temperature incubators after transfection for 6 days. Luminescence was measured each day from duplicate wells. Data shown are means ± SEM from three or six independent experiments. Statistical significance was determined by using a two-way ANOVA on log-transformed data, followed by Bonferroni’s test for multiple comparisons. For each time point, wt replicon was compared to its control replicon. The color of the significance symbol corresponds to the color for each condition. *, P < 0.05; **, P < 0.01; ****, P < 0.0001.
FIG 8
FIG 8
dsRNA production at suboptimal temperature. (A) Accumulation of dsRNA intermediates. C6/36 cells were infected with a high MOI of ZIKV (MOI >10) and with CHIKV (MOI 1) at 28°C and were shifted to 20°C at 2 or 12 h p.i. Cells were processed for immunofluorescence using a monoclonal antibody to detect dsRNA at 48 h p.i. Uninfected cells were used as a control for specificity of the antibody against dsRNA. Nuclei are shown in blue, and dsRNA intermediates are shown in red. (B) Quantification of dsRNA fluorescence signal in ZIKV- and CHIKV-infected cells as described for panel A. Points represent individual cells analyzed. Statistical significance for ZIKV was assessed by using a one-way ANOVA with Dunnett’s correction, where cells infected and kept at 28°C were compared to each condition. Statistical significance for CHIKV was determined by using an unpaired t test with Welch’s correction. AU, arbitrary units. ****, P < 0.0001.
FIG 9
FIG 9
Replication of different ZIKV strains at suboptimal temperatures. Replication rates for SPH (A), MR-766 (B), and IbH (C) at cool temperature. The cells were infected at an MOI of 0.1 for 2 h at 28°C and incubated at either 20°C or 28°C for 10 days. Supernatants were collected every 48 h and titrated. Dashed lines represent the limit of detection. Data shown are means ± SEM of results from five replicates for each virus.
FIG 10
FIG 10
Model of ZIKV replication cycle at 20°C and 28°C. (A) Replication of ZIKV efficiently occurs at 28°C, with all steps completed. (B) When ZIKV infection is initiated at 20°C, infection is stalled after capsid disassembly but before dsRNA intermediates can be detected. (C) Late stages in the ZIKV replication cycle can occur at 20°C if RNA replication steps occur at 28°C (C). Created in Biorender.com.

Similar articles

Cited by

References

    1. Brady OJ, Gething PW, Bhatt S, Messina JP, Brownstein JS, Hoen AG, Moyes CL, Farlow AW, Scott TW, Hay SI. 2012. Refining the global spatial limits of dengue virus transmission by evidence-based consensus. PLoS Negl Trop Dis 6:e1760. 10.1371/journal.pntd.0001760. - DOI - PMC - PubMed
    1. Mlakar J, Korva M, Tul N, Popovic M, Poljsak-Prijatelj M, Mraz J, Kolenc M, Resman Rus K, Vesnaver Vipotnik T, Fabjan Vodusek V, Vizjak A, Pizem J, Petrovec M, Avsic Zupanc T. 2016. Zika virus associated with microcephaly. N Engl J Med 374:951–958. 10.1056/NEJMoa1600651. - DOI - PubMed
    1. Cao-Lormeau V-M, Blake A, Mons S, Lastère S, Roche C, Vanhomwegen J, Dub T, Baudouin L, Teissier A, Larre P, Vial A-L, Decam C, Choumet V, Halstead SK, Willison HJ, Musset L, Manuguerra J-C, Despres P, Fournier E, Mallet H-P, Musso D, Fontanet A, Neil J, Ghawché F. 2016. Guillain-Barre syndrome outbreak associated with Zika virus infection in French Polynesia: a case-control study. Lancet 387:1531–1539. 10.1016/S0140-6736(16)00562-6. - DOI - PMC - PubMed
    1. World Health Organization. 2016. WHO statement on the first meeting of the International Health Regulations (2005) (IHR 2005) Emergency Committee on Zika virus and observed increase in neurological disorders and neonatal malformations. http://www.who.int/mediacentre/news/statements/2016/1st-emergency-commit.... Accessed July 19, 2017.
    1. Mordecai EA, Caldwell JM, Grossman MK, Lippi CA, Johnson LR, Neira M, Rohr JR, Ryan SJ, Savage V, Shocket MS, Sippy R, Stewart Ibarra AM, Thomas MB, Villena O. 2019. Thermal biology of mosquito-borne disease. Ecol Lett 22:1690–1708. 10.1111/ele.13335. - DOI - PMC - PubMed