Measurement of Protein Turnover Rates in Senescent and Non-Dividing Cultured Cells with Metabolic Labeling and Mass Spectrometry
- PMID: 35467654
- PMCID: PMC9899546
- DOI: 10.3791/63835
Measurement of Protein Turnover Rates in Senescent and Non-Dividing Cultured Cells with Metabolic Labeling and Mass Spectrometry
Abstract
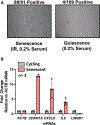
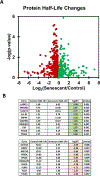
Mounting evidence has shown that the accumulation of senescent cells in the central nervous system contributes to neurodegenerative disorders such as Alzheimer's and Parkinson's diseases. Cellular senescence is a state of permanent cell cycle arrest that typically occurs in response to exposure to sub-lethal stresses. However, like other non-dividing cells, senescent cells remain metabolically active and carry out many functions that require unique transcriptional and translational demands and widespread changes in the intracellular and secreted proteomes. Understanding how protein synthesis and decay rates change during senescence can illuminate the underlying mechanisms of cellular senescence and find potential therapeutic avenues for diseases exacerbated by senescent cells. This paper describes a method for proteome-scale evaluation of protein half-lives in non-dividing cells using pulsed stable isotope labeling by amino acids in cell culture (pSILAC) in combination with mass spectrometry. pSILAC involves metabolic labeling of cells with stable heavy isotope-containing versions of amino acids. Coupled with modern mass spectrometry approaches, pSILAC enables the measurement of protein turnover of hundreds or thousands of proteins in complex mixtures. After metabolic labeling, the turnover dynamics of proteins can be determined based on the relative enrichment of heavy isotopes in peptides detected by mass spectrometry. In this protocol, a workflow is described for the generation of senescent fibroblast cultures and similarly arrested quiescent fibroblasts, as well as a simplified, single-time point pSILAC labeling time-course that maximizes coverage of anticipated protein turnover rates. Further, a pipeline is presented for the analysis of pSILAC mass spectrometry data and user-friendly calculation of protein degradation rates using spreadsheets. The application of this protocol can be extended beyond senescent cells to any non-dividing cultured cells such as neurons.
Figures


Similar articles
-
Toward a hypothesis-free understanding of how phosphorylation dynamically impacts protein turnover.Proteomics. 2023 Feb;23(3-4):e2100387. doi: 10.1002/pmic.202100387. Epub 2022 Dec 7. Proteomics. 2023. PMID: 36422574 Free PMC article.
-
A mass spectrometry workflow for measuring protein turnover rates in vivo.Nat Protoc. 2019 Dec;14(12):3333-3365. doi: 10.1038/s41596-019-0222-y. Epub 2019 Nov 4. Nat Protoc. 2019. PMID: 31685960
-
Global analysis of protein turnover dynamics in single cells.Cell. 2025 May 1;188(9):2433-2450.e21. doi: 10.1016/j.cell.2025.03.002. Epub 2025 Mar 31. Cell. 2025. PMID: 40168994
-
Proteome Turnover in the Spotlight: Approaches, Applications, and Perspectives.Mol Cell Proteomics. 2021;20:100016. doi: 10.1074/mcp.R120.002190. Epub 2020 Dec 7. Mol Cell Proteomics. 2021. PMID: 33556866 Free PMC article. Review.
-
Advances in stable isotope labeling: dynamic labeling for spatial and temporal proteomic analysis.Mol Omics. 2022 Aug 15;18(7):579-590. doi: 10.1039/d2mo00077f. Mol Omics. 2022. PMID: 35723214 Free PMC article. Review.
Cited by
-
Determining and interpreting protein lifetimes in mammalian tissues.Trends Biochem Sci. 2023 Feb;48(2):106-118. doi: 10.1016/j.tibs.2022.08.011. Epub 2022 Sep 23. Trends Biochem Sci. 2023. PMID: 36163144 Free PMC article. Review.
References
-
- Hayflick L The cell biology of aging. Journal of Investigative Dermatology 73 (1), 8–14 (1979). - PubMed
-
- Gorgoulis V et al. Cellular senescence: Defining a path forward. Cell 179 (4), 813–827 (2019). - PubMed
-
- Borghesan M, Hoogaars WMH, Varela-Eirin M, Talma N, Demaria M A senescence-centric view of aging: Implications for longevity and disease. Trends in Cell Biology 30 (10), 777–791 (2020). - PubMed
Publication types
MeSH terms
Substances
Grants and funding
LinkOut - more resources
Full Text Sources
