. 2022 Apr 25;17(4):e0266701.
doi: 10.1371/journal.pone.0266701. eCollection 2022.

SARS-CoV2 wild type and mutant specific humoral and T cell immunity is superior after vaccination than after natural infection

Affiliations

SARS-CoV2 wild type and mutant specific humoral and T cell immunity is superior after vaccination than after natural infection

Jennifer R Richardson et al. PLoS One. .

Abstract

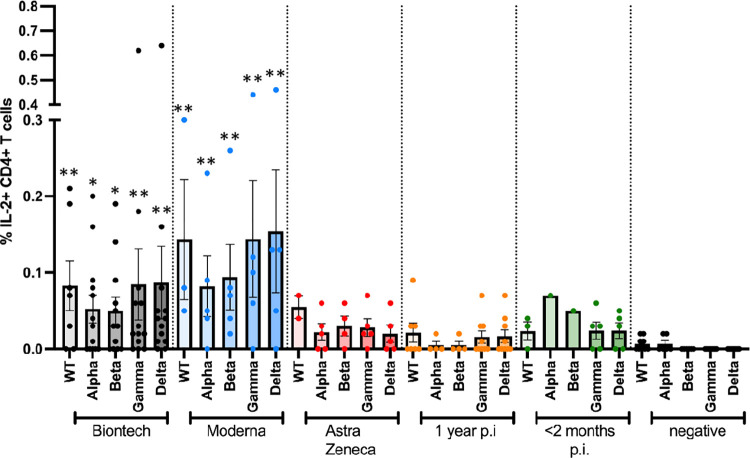
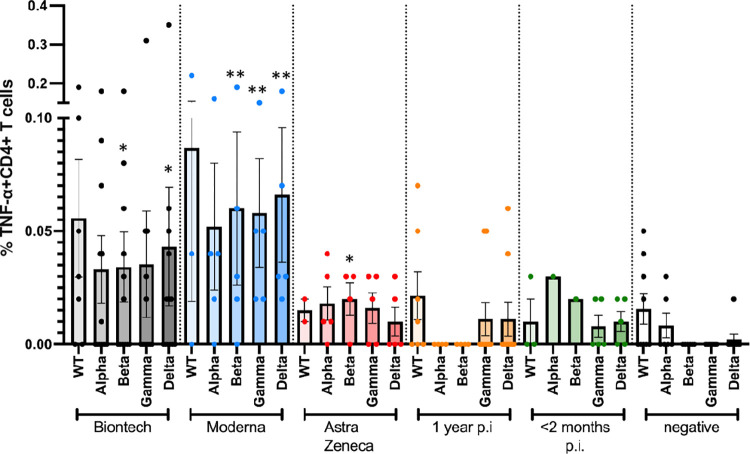
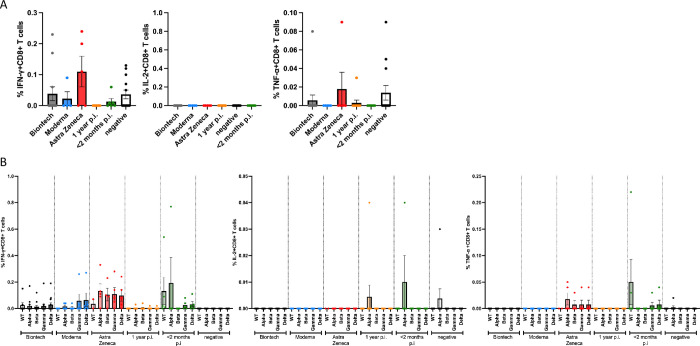
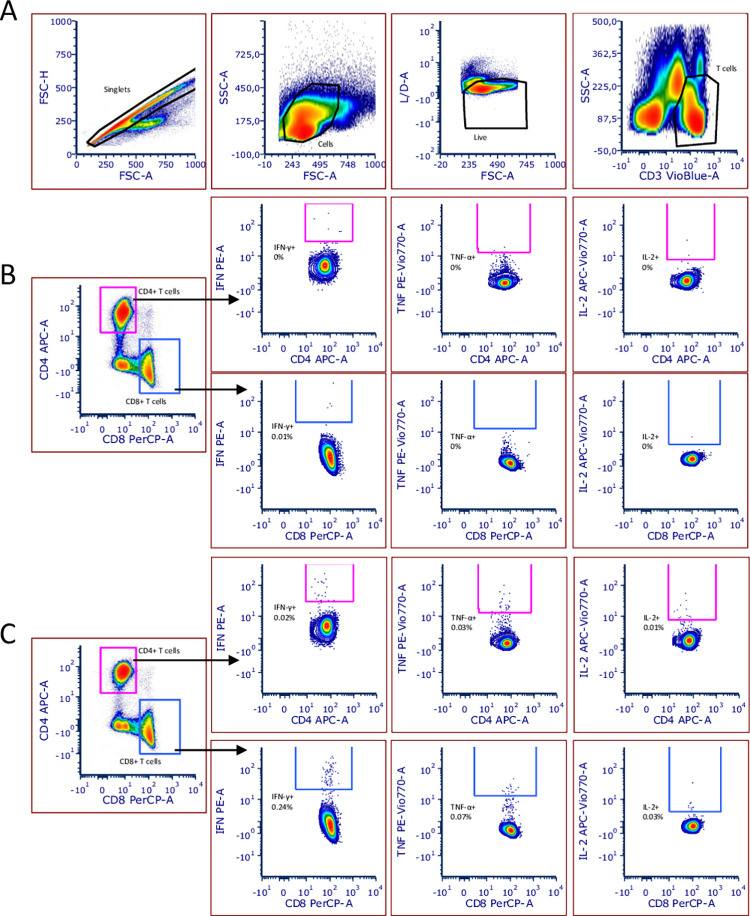
Objective: We investigated blood samples from fully SARS-CoV2-vaccinated subjects and from previously positive tested patients up to one year after infection with SARS-CoV2, and compared short- and long-term T cell and antibody responses, with a special focus on the recently emerged delta variant (B.1.617.2).

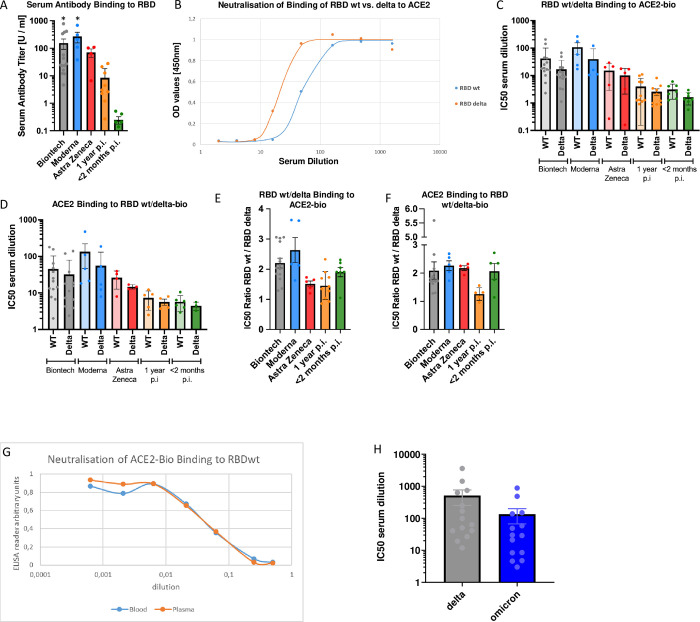
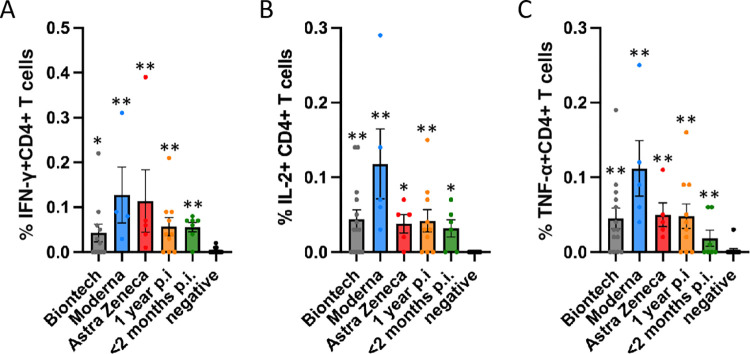
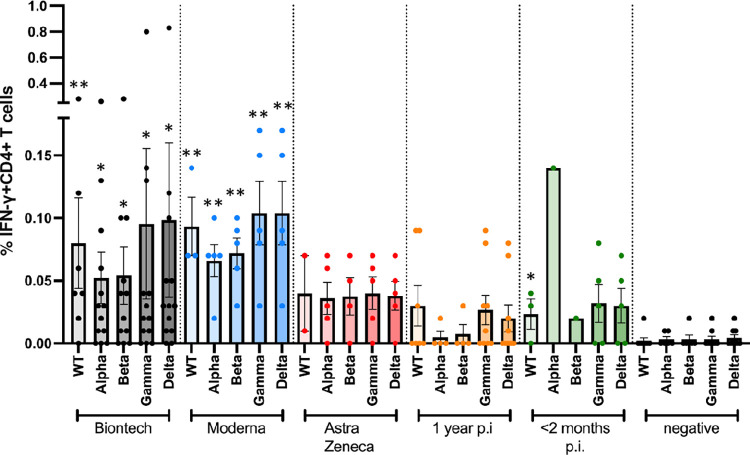
Methods and results: In 23 vaccinated subjects, we documented high anti-SARS-CoV2 spike protein receptor binding domain (RBD) antibody titers. Average virus neutralization by antibodies, assessed as inhibition of ACE2 binding to RBD, was 2.2-fold reduced for delta mutant vs. wild type (wt) RBD. The mean specific antibody titers were lower one year after natural infection than after vaccination; ACE2 binding to delta mutant vs. wt RBD was 1.65-fold reduced. In an additional group, omicron RBD binding was reduced compared to delta. Specific CD4+ T cell responses were measured after stimulation with peptides pools from wt, alpha, beta, gamma, or delta variant SARS-CoV2 spike proteins by flow cytometric intracellular cytokine staining. There was no significant difference in cytokine production of IFN-γ, TNF-α, or IL-2 between vaccinated subjects. T cell responses to wt or mutant SARS-CoV2 spike were significantly weaker after natural occurring infections compared to those in vaccinated individuals.

Conclusion: Antibody neutralisation of the delta mutant was reduced compared to wt, as assessed in a novel inhibition assay with a finger prick blood drop. Strong CD4 T cell responses were present against wt and mutant SARS-CoV2 variants, including the delta (B.1.617.2) strain, in fully vaccinated individuals, whereas they were partly weaker 1 year after natural infection. Hence, immune responses after vaccination are stronger compared to those after naturally occurring infection, pointing out the need of the vaccine to overcome the pandemic.


Conflict of interest statement

The fact that all authors are employees of the non-profit ISAR Bioscience Institute which formally acts as a biotech company does not alter our adherence to PLOS ONE policies on sharing data and materials. The authors or ISAR do not impose any restrictions on sharing of data and/or materials.

Figures

Fig 1
Fig 1
A: Representative Coomassie gel electrophoresis (left panel) and silver stain (right panel) of SARS-CoV2 wild type spike RBD protein (A) and of nucleocapsid protein (B).
Fig 2
Fig 2. Serum antibodies and neutralisation.
The bar graphs show results of n = 13 independent individuals after vaccination with BioNtech (grey), n = 5 Moderna (blue), n = 5 AstraZeneca (red), and n = 10 independent individuals one year (orange), and n = 7 subjects < 2 months (green) after natural infection with standard errors of the mean (SEM). Significance was tested by one-way ANOVA (A) or by Kruskal-Wallis test for non-parametric values (B–E). **p < 0.05 vs. naturally infected subjects. A: Anti RBD antibody titres; B: Representative curve of a single experiment to determine IC50-values for the inhibition of biotinylated ACE2 binding to immobilized wt vs. delta mutant RBD. C: Absolute IC50-values calculated for the inhibition of biotinylated ACE2 binding to immobilized wt vs. delta mutant RBD. D: Absolute IC50-values calculated for the inhibition of biotinylated wt vs. delta mutant RBD binding to immobilized ACE2. E: Ratios between IC50-values calculated for inhibition of ACE2 binding to immobilized wt vs. delta mutant RBD. F: Ratios between IC50-values calculated for inhibition of wt vs. delta mutant RBD binding to immobilized ACE2. G: Read-out of a representative experiment showing the comparison between inhibition of biotinylated ACE2 binding to immobilized RBD with serum taken by venous sampling vs a drop of full blood. H: In additional, independent group of 14 subjects who had been fully vaccinated with BNT 162b2, we also investigated ratios between IC50 values calculated for inhibition of ACE2 binding to immobilized omicron vs. delta mutant RBD.
Fig 3
Fig 3. Antigen-specific CD4+ T cell responses to the Miltenyi peptide S protein pool.
Antigen-specific CD4+ T cell responses elicited by the Miltenyi wt S protein peptide pool after vaccination with BioNtech (grey), Moderna (blue) or AstraZeneca (red), or one year (orange) or < 2 months (dark green) after naturally occurring infection with SARS-CoV2. In comparison, samples of healthy control subjects, who tested negative for SARS-CoV2-antibodies, are shown on the right of each panel. The bar graphs show frequencies of (A) interferon-γ (IFN-γ), (B) interleukin-2 (IL-2)- and (C) tumor necrosis factor-α (TNF-α)-positive CD4+ T cells. The figure shows results of n = 13 independent individuals after vaccination with BioNtech, n = 5 Moderna, n = 5 AstraZeneca, and n = 10 independent individuals one year and n = 7 subjects < 2 months after natural infection with standard errors of the mean (SEM). For comparison, 13 negative healthy controls were included. Significance levels were tested by Kruskal-Wallis test for non-parametric values. *p < 0.05, **p < 0.01 vs. healthy controls.
Fig 4
Fig 4. Antigen-specific IFN-γ CD4+ T cell responses to JPT peptide S protein wt and mutant pools.
Antigen-specific CD4+ T cell responses elicited by the JPT peptide S protein pools after vaccination with BioNtech (grey), Moderna (blue) or AstraZeneca (red), or one year (orange) or < 2 months (dark green) after naturally occurring infection with SARS-CoV2, or negative controls. The bar graphs show frequencies of IFNγ+CD4+ T cells for wild type, and for alpha (B.1.1.7), beta (B.1.351), gamma (P.1) and delta (B.1.617.2) mutants. The figure shows results of n = 13 independent individuals after vaccination with BioNtech, n = 5 Moderna, n = 5 AstraZeneca, and n = 10 independent individuals one year and n = 7 subjects < 2 months after natural infection, and n = 9 negative controls, with standard errors of the mean (SEM). Significance levels were tested with Kruskal-Wallis test for non-parametric samples. *p < 0.05 vs. healthy controls; **p < 0.01 vs. healthy controls and p < 0.05 vs 1 year after infection.
Fig 5
Fig 5. Antigen-specific IL2+ CD4+ T cell responses to JPT peptide S protein wt and mutant pools.
Antigen-specific CD4+ T cell responses elicited by the JPT peptide S protein pools after vaccination with BioNtech (grey), Moderna (blue) or AstraZeneca (red), or one year (orange) or < 2 months (dark green) after naturally occurring infection with SARS-CoV2, or negative controls. The bar graphs show frequencies of interleukin-2 (IL-2)-positive CD4+ T cells for wild type, and for alpha (B.1.1.7), beta (B.1.351), gamma (P.1) and delta (B.1.617.2) mutants. The figure shows results of n = 13 independent individuals after vaccination with BioNtech, n = 5 Moderna, n = 5 AstraZeneca, and n = 10 independent individuals one year and n = 7 < 2 months after natural infection with standard errors of the mean (SEM). Samples of non infected individuals tested negative (not shown in the figure to enhance legibility). Significance levels were tested by Kruskal-Wallis test for non-parametric values. **p < 0.01 vs. healthy controls, and p < 0.05 vs. 1 year after infection.
Fig 6
Fig 6. Antigen-specific TNF-α+ CD4+ T cell responses to JPT peptide S protein wt and mutant pools.
Antigen-specific CD4+ T cell responses elicited by the JPT peptide S protein pools after vaccination with BioNtech (grey), Moderna (blue) or AstraZeneca (red), or one year (orange) or < 2 months (dark green) after naturally occurring infection with SARS-CoV2, or negative controls. The bar graphs show frequencies of TNF-α+CD4+ T cells for wild type, and for alpha (B.1.1.7), beta (B.1.351), gamma (P.1) and delta (B.1.617.2) mutants. The figure shows results of n = 13 independent individuals after vaccination with BioNtech, n = 5 Moderna, n = 5 AstraZeneca, and n = 10 independent individuals one year and n = 7 < 2 months after natural infection with standard errors of the mean (SEM). Samples of non infected individuals tested negative (not shown in the figure to enhance legibility). At least 200,000 events were counted for each individual condition. Significance levels were tested by Kruskal-Wallis test for non-parametric values. *p < 0.05 vs. healthy controls, **p < 0.01 vs. healthy controls and also p < 0.05 vs. 1 year after infection.
Fig 7
Fig 7. Antigen-specific CD8+ T cell responses to JPT and Miltenyi peptide S protein wt and mutant pools.
Antigen-specific CD8+ T cell responses elicited by the JPT peptide S protein pools after vaccination with BioNtech (grey), Moderna (blue) or AstraZeneca (red), or one year (orange) or < 2 months (dark green) after naturally occurring infection with SARS-CoV2, or negative controls. The bar graphs show frequencies of TNF-α+, IL-2+ or IFNγ+ CD8+ T cells for wild type, and for alpha (B.1.1.7), beta (B.1.351), gamma (P.1) and delta (B.1.617.2) mutants. At least 200,000 events were counted for each individual condition.
Fig 8
Fig 8. Gating strategy of the intracellular cytokine staining.
The figure shows a representative flow cytometry gating strategy for one of the donors. Cells were gated as follows: Singlets, Cells, Live, CD3+ T cells (A) and further T cells were divided into CD4+ and CD8+ T cells and from each of the subsets IFN-γ+, TNF-α+, or IL-2+ cells were gated (B, C). Panel B shows the negative control and Panel C shows the restimulated condition with the Miltenyi peptide mix of the same representative donor.

References

    1. Krammer F. SARS-CoV-2 vaccines in development. Nature 2020; 586: 516–527. doi: 10.1038/s41586-020-2798-3 - DOI - PubMed
    1. Polack FP, et al.. Safety and Efficacy of the BNT162b2 mRNA Covid-19 Vaccine. N Engl J Med 2020; 383: 2603–2615. doi: 10.1056/NEJMoa2034577 - DOI - PMC - PubMed
    1. Baden LR, et al.. Efficacy and Safety of the mRNA-1273 SARS-CoV-2 Vaccine. N Engl J Med 2020; 384: 403–416. doi: 10.1056/NEJMoa2035389 - DOI - PMC - PubMed
    1. Voysey M, et al.. Safety and efficacy of the ChAdOx1 nCoV-19 vaccine (AZD1222) against SARS-CoV-2: an interim analysis of four randomised controlled trials in Brazil, South Africa, and the UK. Lancet. 2020; 397: 99–111. doi: 10.1016/S0140-6736(20)32661-1 - DOI - PMC - PubMed
    1. Long QX, et al.. Genomic characterisation and epidemiology of 2019 novel coronavirus: implications for virus origins and receptor binding. Lancet 2020; 395: 565–574. doi: 10.1016/S0140-6736(20)30251-8 - DOI - PMC - PubMed

Supplementary concepts