

Selective excitation localized by the Bloch-Siegert shift and a gradient
- PMID: 35468232
- PMCID: PMC9246893
- DOI: 10.1002/mrm.29271
Selective excitation localized by the Bloch-Siegert shift and a gradient
Abstract
Purpose: To perform -selective excitation using the Bloch-Siegert shift for spatial localization.
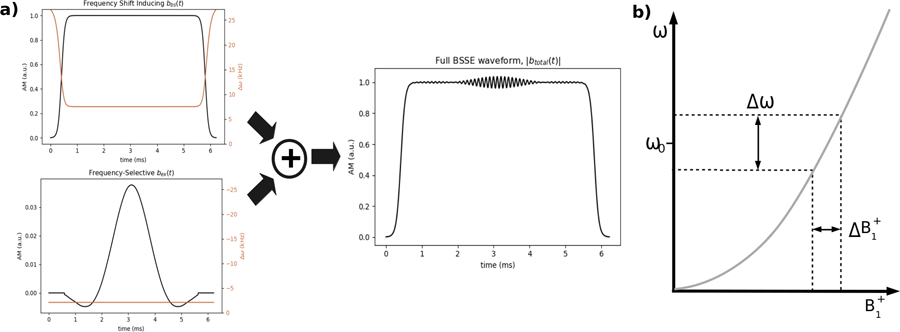
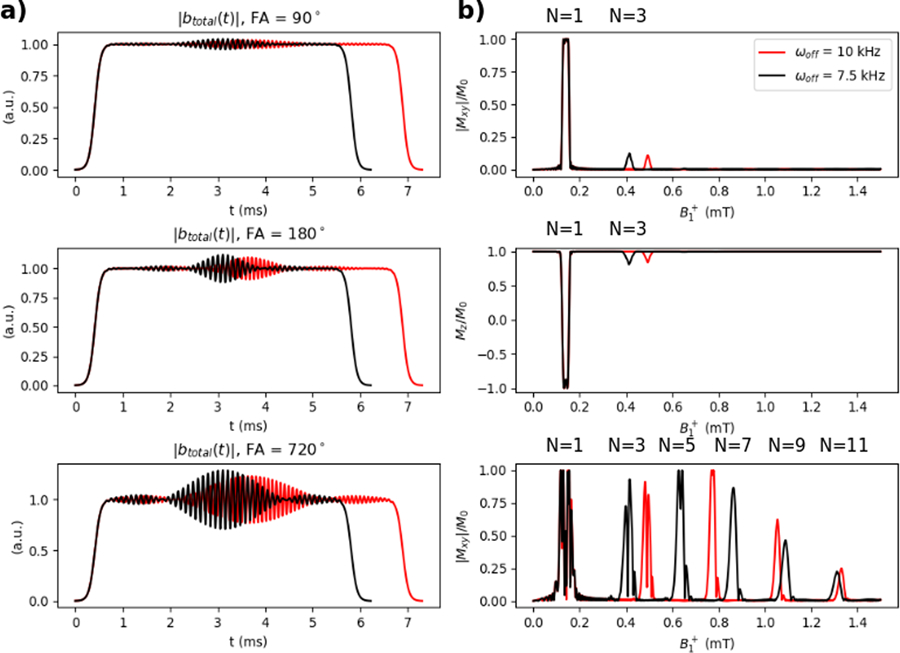
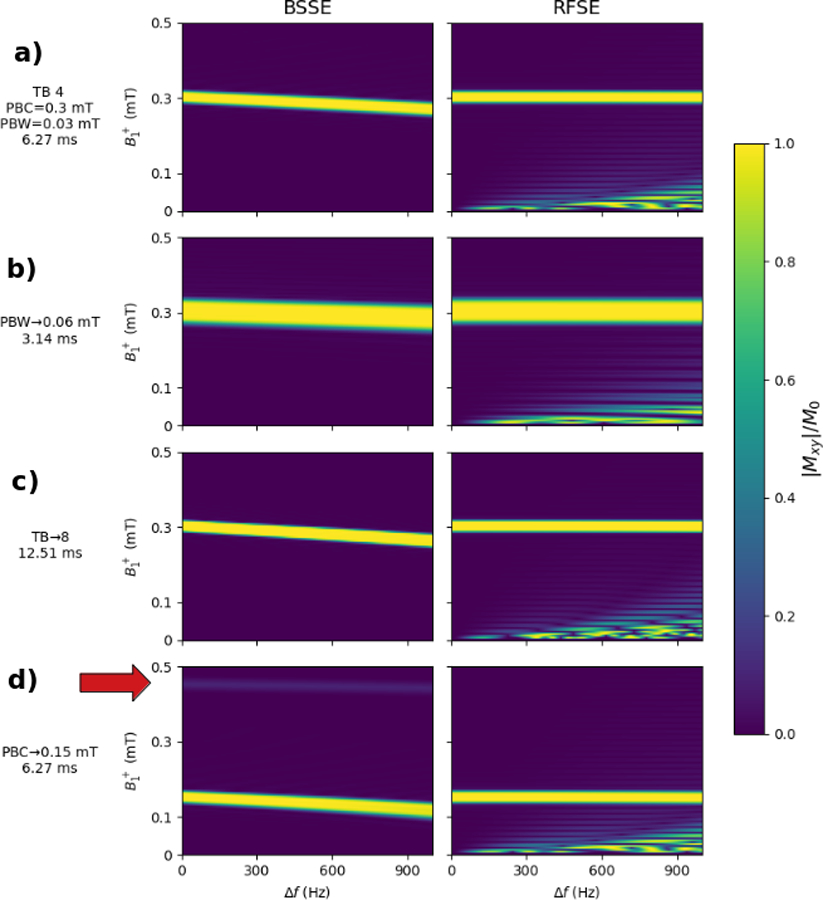
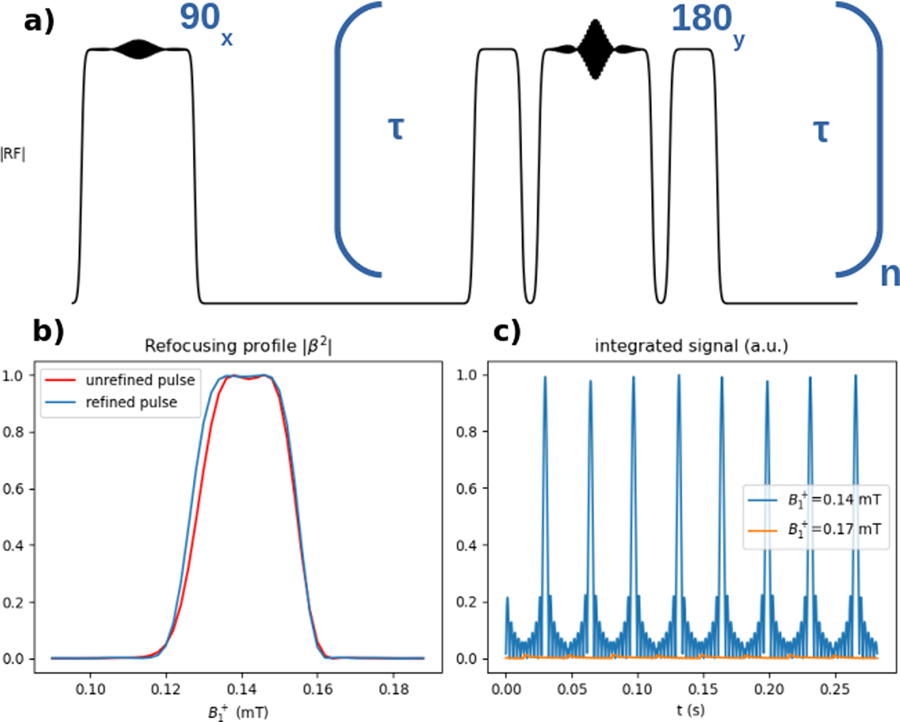
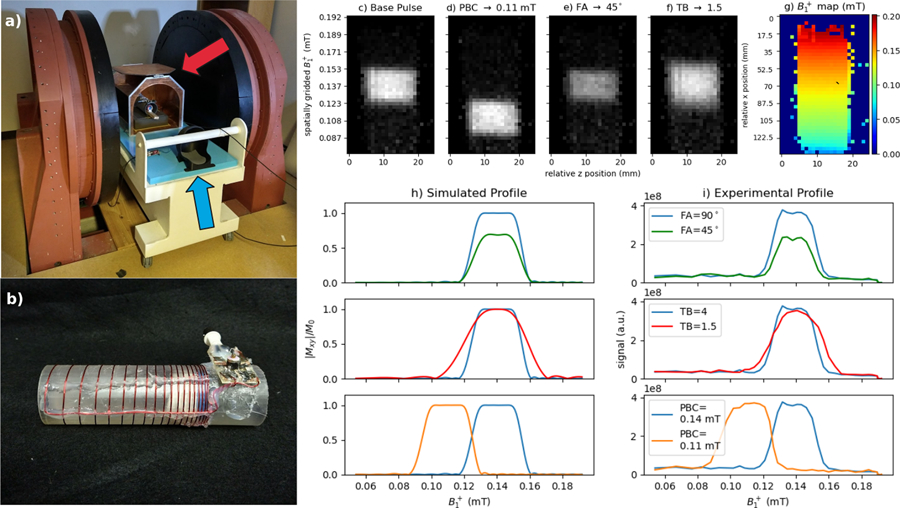
Theory and methods: A -selective excitation is produced by an radiofrequency (RF) pulse consisting of two summed component pulses: an off-resonant pulse that induces a -dependent Bloch-Siegert frequency shift and a frequency-selective excitation pulse. The passband of the pulse can be tailored by adjusting the frequency content of the frequency-selective pulse, as in conventional gradient-localized excitation. Fine magnetization profile control is achieved by using the Shinnar-Le Roux algorithm to design the frequency-selective excitation pulse. Simulations analyzed the pulses' robustness to off-resonance, their suitability for multi-echo spin echo pulse sequences, and how their performance compares to that of rotating-frame selective excitation pulses. The pulses were evaluated experimentally on a 47.5 mT MRI scanner using an RF gradient transmit coil. Multiphoton resonances produced by the pulses were characterized and their distribution across predicted.
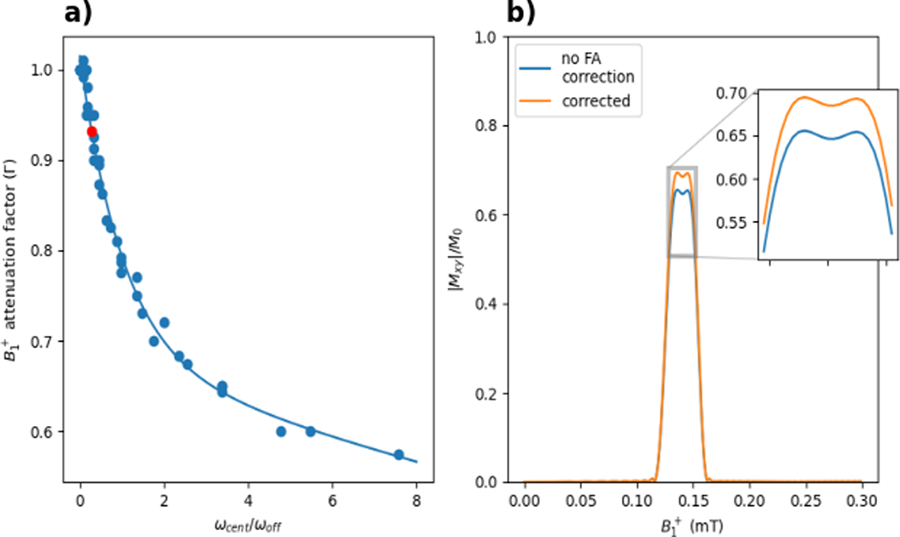
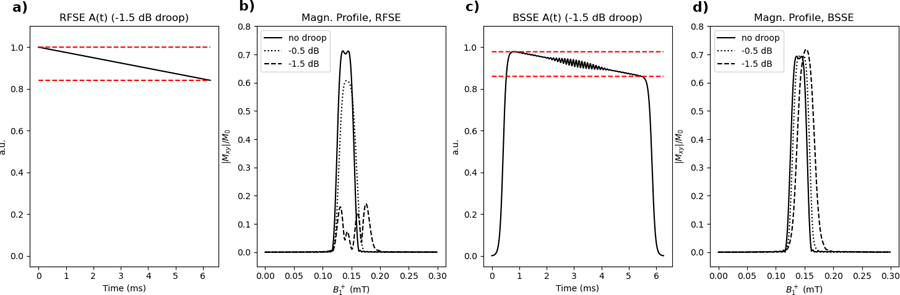
Results: With correction for varying across the desired profile, the proposed pulses produced selective excitation with the specified profile characteristics. The pulses were robust against off-resonance and RF amplifier distortion, and suitable for multi-echo pulse sequences. Experimental profiles closely matched simulated patterns.
Conclusion: The Bloch-Siegert shift can be used to perform -gradient-free selective excitation, enabling the excitation of slices or slabs in RF gradient-encoded MRI.
Keywords: Bloch-Siegert shift; RF pulse design; RF-encoded MRI; low-field MRI; multiphoton; selective RF excitation.
© 2022 International Society for Magnetic Resonance in Medicine.
Figures
References
-
- Bernstein MA, Zhou XJ, Polzin JA, King KF, Ganin A, Pelc NJ, Glover GH. Concomitant gradient terms in phase contrast MR: Analysis and correction. Magnetic Resonance in Medicine 1998; 39(2):300–308. - PubMed
-
- Hoult DI. Rotating frame zeugmatography. Journal of Magnetic Resonance 1979; 33(1):183–197. - PubMed
-
- Sharp JC, King SB. MRI using radiofrequency magnetic field phase gradients. Magnetic Resonance in Medicine 2010; 63(1):151–161. - PubMed
-
- Kartäusch R, Driessle T, Kampf T, BasseLüsebrink TC, Hoelscher UC, Jakob PM, Fidler F, Helluy X. Spatial phase encoding exploiting the Bloch–Siegert shift effect. Magnetic Resonance Materials in Physics, Biology and Medicine 2014; 27:363–371. - PubMed
Publication types
MeSH terms
Grants and funding
LinkOut - more resources
Full Text Sources
Other Literature Sources
Medical
