. 2022 Jun;101(6):474-482.
doi: 10.1002/cyto.a.24563. Epub 2022 May 5.

Simultaneous analysis of antigen-specific B and T cells after SARS-CoV-2 infection and vaccination

Affiliations

Simultaneous analysis of antigen-specific B and T cells after SARS-CoV-2 infection and vaccination

Krista L Newell et al. Cytometry A. 2022 Jun.

Abstract

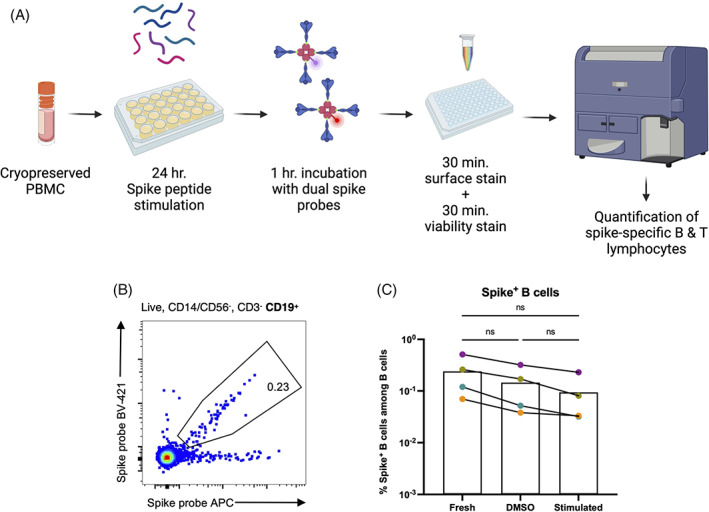
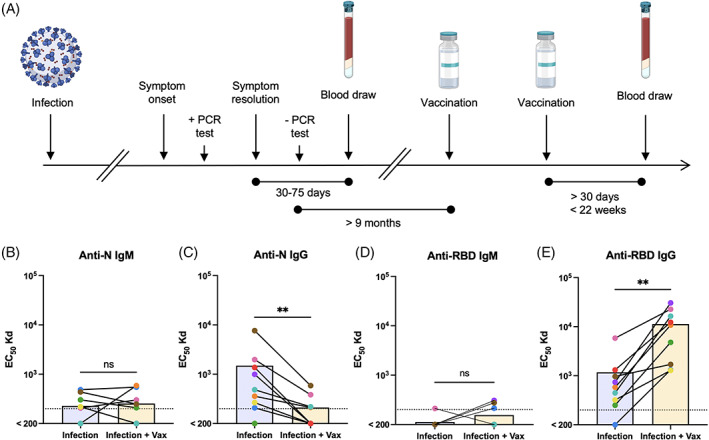
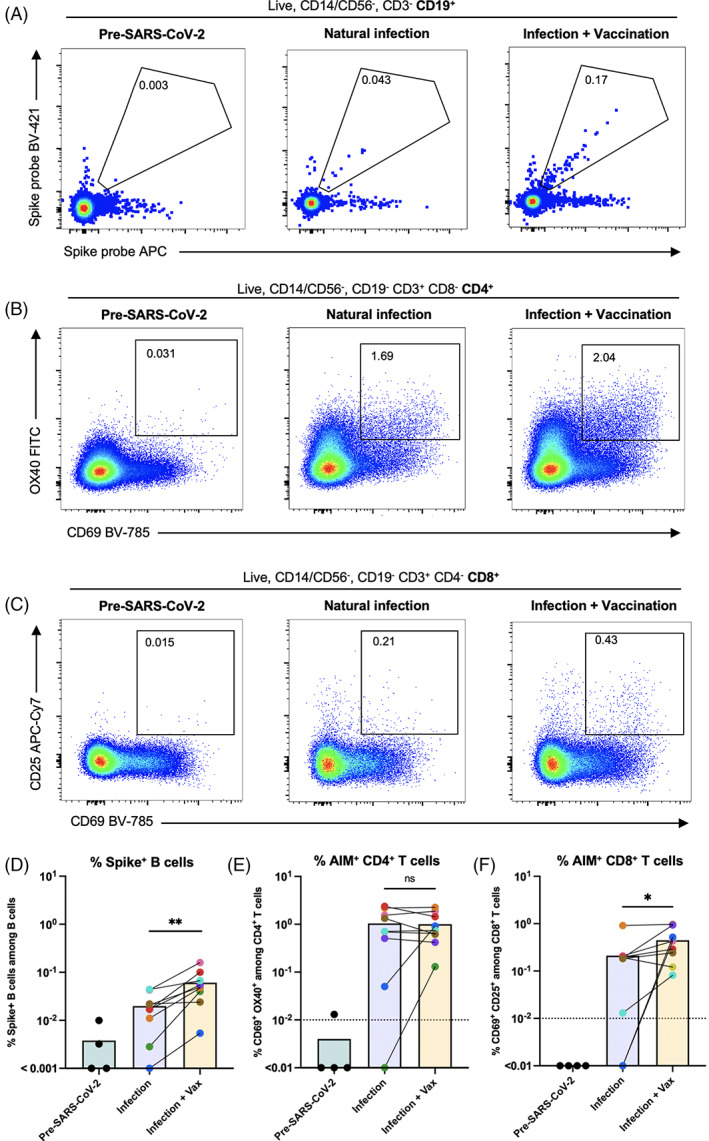
Conventional methods for quantifying and phenotyping antigen-specific lymphocytes can rapidly deplete irreplaceable specimens. This is due to the fact that antigen-specific T and B cells have historically been analyzed in independent assays each requiring millions of cells. A technique that facilitates the simultaneous detection of antigen-specific T and B cells would allow for more thorough immune profiling with significantly reduced sample requirements. To this end, we developed the B and T cell tandem lymphocyte evaluation (BATTLE) assay, which allows for the simultaneous identification of SARS-CoV-2 Spike reactive T and B cells using an activation induced marker (AIM) T cell assay and dual-color B cell antigen probes. Using this assay, we demonstrate that antigen-specific B and T cell subsets can be identified simultaneously using conventional flow cytometry platforms and provide insight into the differential effects of mRNA vaccination on B and T cell populations following natural SARS-CoV-2 infection.

Keywords: B cells; SARS-CoV-2; T cells; antigen-specific; natural infection; spike protein; vaccination.


Conflict of interest statement

Stephen J. Thomas reports compensation from Pfizer, during the conduct of the study; personal fees from Merck, Sanofi, Takeda, Themisbio, and Janssen, outside the submitted work. All other authors declare that the research was conducted in the absence of any commercial or financial relationships that could be construed as a potential conflict of interest.

Figures

FIGURE 1
FIGURE 1
BATTLE: B and T tandem lymphocyte evaluation. (A) Schematic of BATTLE assay workflow. (B) Representative flow cytometry plot of SARS‐CoV‐2 spike protein‐specific B cells detected from the PBMC of a vaccinated individual using the BATTLE assay. Pre‐gating is shown above the plot. The frequency of cells within the double‐positive gate among B cells is shown inside the gate. (C) Total PBMC from SARS‐CoV‐2 mRNA vaccinated individuals were stimulated with overlapping spike peptide pools or DMSO alone and baited with dual spike BCR probes. An aliquot of each sample was also stained with the probes directly following thawing from cryopreservation (“Fresh”) for comparison. The frequency among B cells of B cells positive for both probes are shown, with each dot representing an individual. Matched fresh, DMSO control and peptide pool‐stimulated samples from the same individual are connected by a solid line. Matched groups were analyzed by Repeated Measures one‐way ANOVA, with the Geisser–Greenhouse correction (n = 4, exact p = 0.0682), and Tukey's multiple comparison's test, with individual variances computed for each comparison (n = 4, adjusted p = 0.1311, p = 0.1392, and p = 0.2038 for fresh vs. DMSO, fresh vs. stim., and DMSO vs. stim., respectively). [Color figure can be viewed at wileyonlinelibrary.com]
FIGURE 2
FIGURE 2
Study design and serology. (A) Timeline of SARS‐CoV‐2 convalescent study and sample collection. (B–E) Paired sera following natural infection and after subsequent vaccination from the same individual were assessed for IgM and IgG binding to SARS‐CoV‐2 nucleocapsid (B, C) or spike RBD (D, E) proteins. Each dot color represents an individual and a solid line connects pairs. Differences between infection and infection + vaccination groups were analyzed by Wilcoxon matched‐pairs signed rank test (n = 9, exact two‐tailed p > 0.9999 (B), p = 0.0078, 0.2500, 0.0039 [C–E]). The LOD is represented as a dotted line [Color figure can be viewed at wileyonlinelibrary.com]
FIGURE 3
FIGURE 3
Spike‐specific lymphocyte responses following natural infection and subsequent vaccination. (A–C) Representative flow cytometry plots of SARS‐CoV‐2 spike protein‐specific B cells (A), OX40/CD69+ CD4+ (B) and CD25/CD69+ CD8+ (C) T cells detected from PBMC using the BATTLE assay from a sample collected independently prior to the onset of the pandemic, and following natural infection and subsequent vaccination in the same individual (left to right, respectively). Pre‐gating is shown above each panel. The frequency of cells within the double‐positive gate among B cells, CD4+ T cells, and CD8+ T cells is shown inside the gates, respectively. (D) The frequency among B cells of cells positive for both probes are shown, with each dot or dot pair representing an individual. Paired postinfection and postinfection plus vaccination samples from the same individual are connected by a solid line. Paired groups were analyzed by Wilcoxon matched‐pairs signed rank test (n = 9, exact two‐tailed p = 0.0039). (E) The frequency among CD4+ T cells of cells positive for activation‐induced markers OX40 and CD69 are shown, following subtraction of DMSO control values. Each dot or dot pair represents an individual. Paired postinfection and postinfection plus vaccination samples from the same individual are connected by a solid line. Paired groups were analyzed by Wilcoxon matched‐pairs signed rank test (n = 9, exact two‐tailed p > 0.9999). The LOD is represented as a dotted line. (F) The frequency among CD8+T cells of cells positive for activation‐induced markers CD25 and CD69 are shown, following subtraction of DMSO control values. Each dot or dot pair represents an individual. Paired postinfection and postinfection plus vaccination samples from the same individual are connected by a solid line. Paired groups were analyzed by Wilcoxon matched‐pairs signed rank test (n = 9, exact two‐tailed p = 0.0234). The LOD is represented as a dotted line. [Color figure can be viewed at wileyonlinelibrary.com]

References

    1. Altman JD, Moss PA, Goulder PJ, Barouch DH, McHeyzer‐Williams MG, Bell JI, et al. Phenotypic analysis of antigen‐specific T lymphocytes. Science. 1996;274:94–6. - PubMed
    1. Dan JM, Lindestam Arlehamn CS, Weiskopf D, da Silva Antunes R, Havenar‐Daughton C, Reiss SM, et al. A cytokine‐independent approach to identify antigen‐specific human germinal center T follicular helper cells and rare antigen‐specific CD4+ T cells in blood. J Immunol. 2016;1950(197):983–93. - PMC - PubMed
    1. Dan JM, Mateus J, Kato Y, Hastie KM, Yu ED, Faliti CE, et al. Immunological memory to SARS‐CoV‐2 assessed for up to 8 months after infection. Science. 2021;371:eabf4063. - PMC - PubMed
    1. Frentsch M, Arbach O, Kirchhoff D, Moewes B, Worm M, Rothe M, et al. Direct access to CD4+ T cells specific for defined antigens according to CD154 expression. Nat Med. 2005;11:1118–24. - PubMed
    1. Kern F, Faulhaber N, Frömmel C, Khatamzas E, Prösch S, Schönemann C, et al. Analysis of CD8 T cell reactivity to cytomegalovirus using protein‐spanning pools of overlapping pentadecapeptides. Eur J Immunol. 2000;30:1676–82. - PubMed

Publication types