. 2022 Apr 25;10(1):60.
doi: 10.1186/s40478-022-01355-2.

Duchenne muscular dystrophy trajectory in R-DMDdel52 preclinical rat model identifies COMP as biomarker of fibrosis

Affiliations

Duchenne muscular dystrophy trajectory in R-DMDdel52 preclinical rat model identifies COMP as biomarker of fibrosis

Valentina Taglietti et al. Acta Neuropathol Commun. .

Abstract

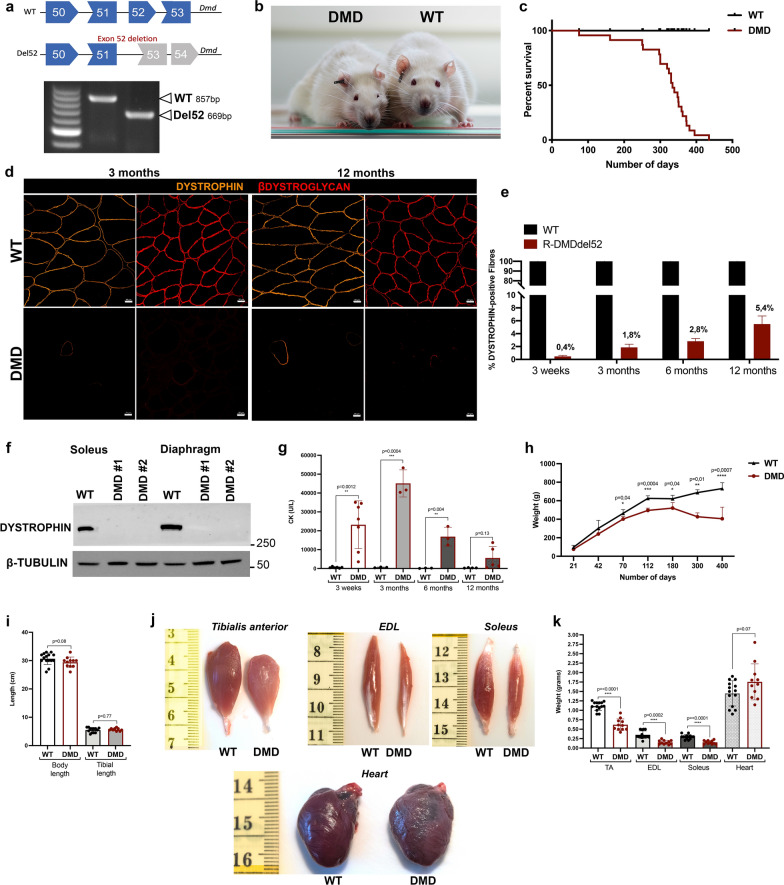
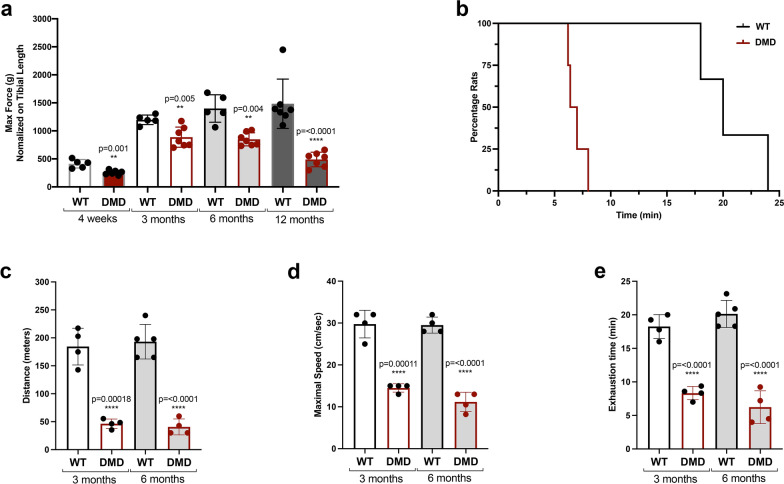
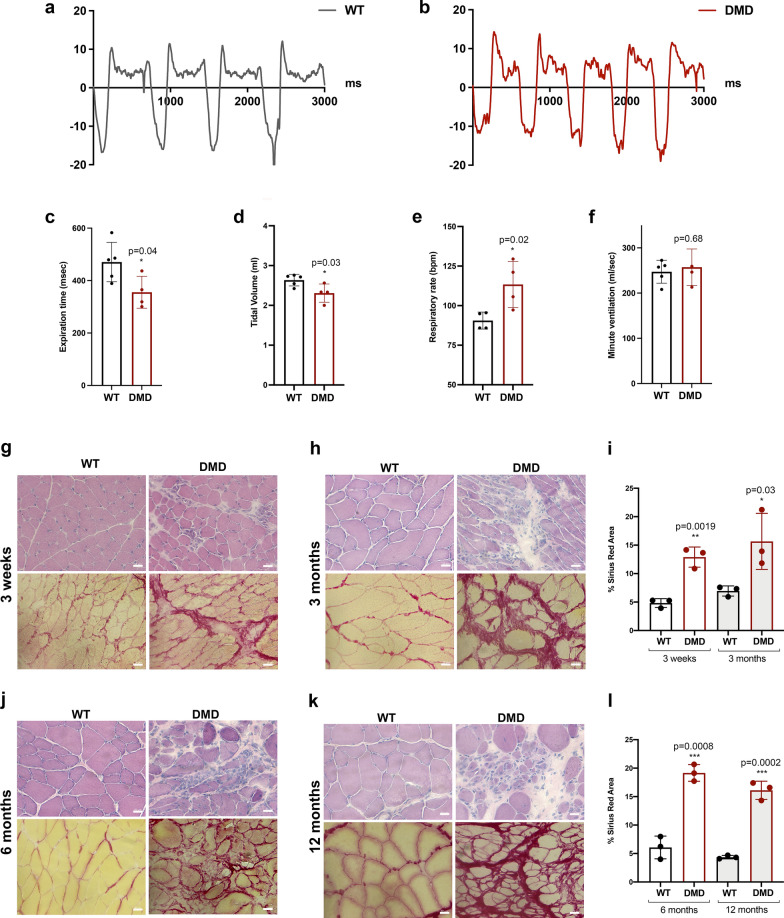
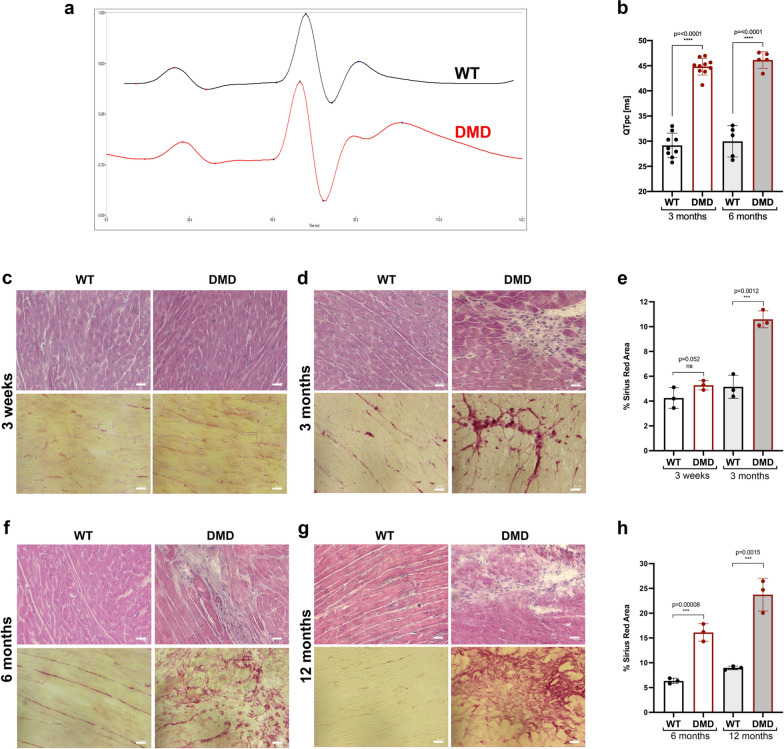
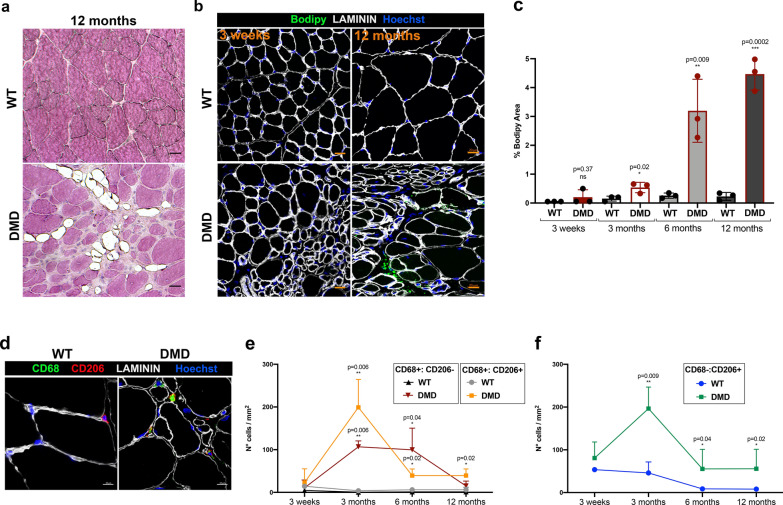
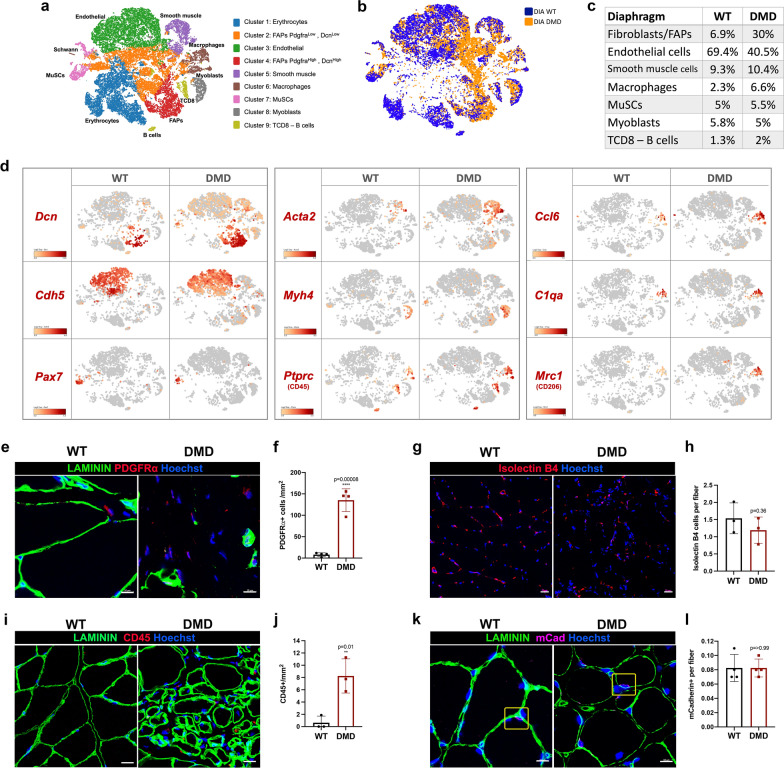
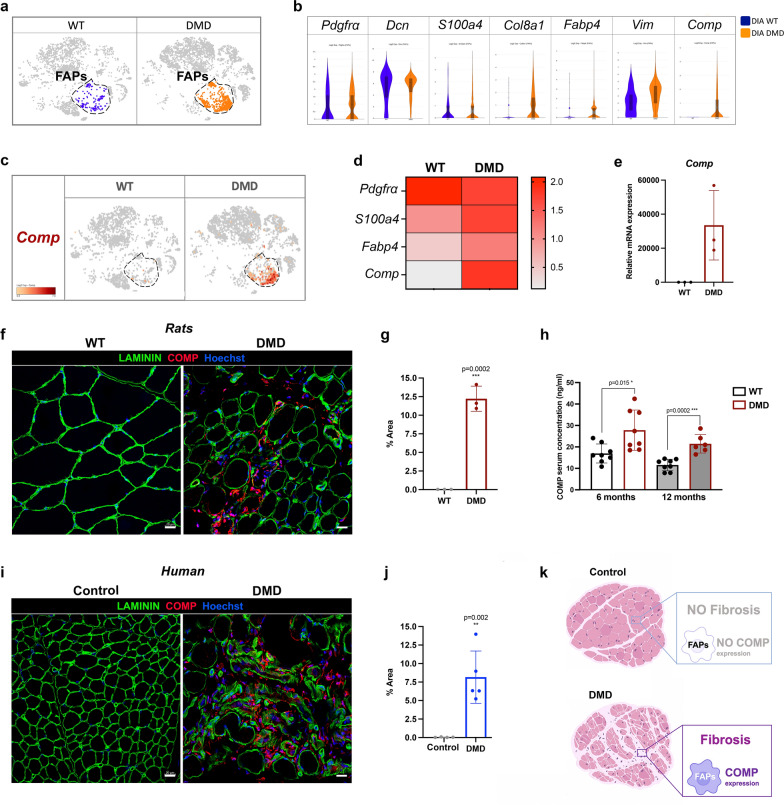
Duchenne muscular dystrophy (DMD) is a fatal muscle-wasting disorder caused by mutations in the Dystrophin gene and for which there is currently no cure. To bridge the gap between preclinical and therapeutic evaluation studies, we have generated a rat model for DMD that carries an exon 52 deletion (R-DMDdel52) causing a complete lack of dystrophin protein. Here we show that R-DMDdel52 animals recapitulated human DMD pathophysiological trajectory more faithfully than the mdx mouse model. We report that R-DMDdel52 rats displayed progressive and severe skeletal muscle loss associated with fibrotic deposition, fat infiltration and fibre type switch. Early fibrosis was also apparent in the cardiac muscle. These histological modifications led to severe muscle, respiratory and cardiac functional impairments leading to premature death around 1 year. Moreover, DMD muscle exhibited systemic inflammation with a mixed M1/M2 phenotype. A comparative single cell RNAseq analysis of the diaphragm muscle was performed, revealing cellular populations alteration and molecular modifications in all muscle cell types. We show that DMD fibroadipogenic progenitors produced elevated levels of cartilage oligomeric matrix protein, a glycoprotein responsible for modulating homeostasis of extracellular matrix, and whose increased concentration correlated with muscle fibrosis both in R-DMDdel52 rats and human patients. Fibrosis is a component of tissue remodelling impacting the whole musculature of DMD patients, at the tissue level but most importantly at the functional level. We therefore propose that this specific biomarker can optimize the prognostic monitoring of functional improvement of patients included in clinical trials.

Keywords: Duchenne muscular dystrophy; Long QT; Preclinical modelling; Skeletal muscle; Translational medicine; scRNAseq.


Conflict of interest statement

The authors have no relevant financial or non-financial interests to disclose and no competing interests to declare that are relevant to the content of this article. All the procedures including animal handling were validated by the ethic committee of the French ministry (APAFIS#25606-202005311746599) and all the DMD patients and controls gave their informed consent after the explanation of the research studies.

Figures

Fig. 1
Fig. 1
Premature death, absence of dystrophin expression and muscle atrophy in R-DMDdel52 rats. a Scheme of CRISPR-mediated gene deletion in rats and genotyping data from WT and R-DMDdel52 animals. Position of WT and deletion (del52) bands is indicated. b Pictures of R-DMDdel52 rats (left) and a WT littermate (right) aged 12 months, showing a marked facial muscle atrophy that modifies the appearance of the animal. c Kaplan Meier Curve for the frequency of WT (black curve) and R-DMDdel52 (red curve) rat survival. d Representative immunofluorescence for DYSTROPHIN (orange) and ßDYSTROGLYCAN (red) in tibialis anterior sections of 3-month-old (left panels) and 12-month-old (right panels) WT and R-DMDdel52 rats. Scale bar 20 μm. e Quantification of the percentage of dystrophin-positive fibres in WT and R-DMDdel52 TA at 3 weeks, 3, 6, 12 months of age. f Western blot analysis of WT and R-DMDdel52 proteins extracted from soleus and diaphragm tissues. The amount of loaded proteins was normalized on β-TUBULIN levels. g CK levels of WT and R-DMDdel52 rats aged 3 weeks, 3 months, 6 months and 12 months. h Weight curve showing that R-DMDdel52 rats exhibited a progressive loss of weight compared to their healthy littermates (WT). i) Graph showing the body and tibial length in centimetres of R-DMDdel52 and WT rats. j) Pictures of R-DMDdel52 muscles at 12 months of age: tibialis anterior, extensor digitorum longus, soleus, and heart. k) Graph showing the weight in grams of different skeletal muscles from R-DMDdel52 rats and WT aged 12 months
Fig. 2
Fig. 2
Functional impairment of R-DMDdel52 animals. a Maximum force applied during grip test at 3 weeks, 3, 6 and 12 months of age in WT and R-DMDdel52 rats. b Graph showing the percentage of exhausted rats in time during the treadmill test, performed on WT and R-DMDdel52 animals aged 6 months. ce Maximal distance in meters (c), maximal speed expressed in cm/s (d) and exhaustion time in minutes (e) measured during the treadmill test performed on R-DMDdel52 and WT rats aged 3 and 6 months
Fig. 3
Fig. 3
Diaphragm and respiration assessment in R-DMDdel52 rats. a, b Recording trace of respiratory flow of WT (a) and R-DMDdel52 rats (b) aged 6 months under baseline conditions. Negative flow peaks indicate depression in the box, i.e. the inspiration step for the animal, while the positive ones reflect the expiration. cf exhalation time (c), tidal volume (d), respiratory rate (e) and minute ventilation (f) measured by whole body plethysmography in R-DMDdel52 and WT rats aged 6 months. g, h Hematoxylin and eosin (upper panels) and Picro Sirius red (lower panels) staining of diaphragm of 3-week-old (g) and 3-month-old (h) WT and R-DMDdel52 rats (scale bar 50 μm). i Percentage of Sirius red area in diaphragm of 3-week-old and 3-month-old WT and DMDdel52 rats. j, k Hematoxylin and eosin (upper panels) and Picro Sirius red (lower panels) staining of diaphragm at 6 months (j) and 12 months (k) of age of both WT and R-DMDdel52 rats (scale bar 50 μm). l Percentage of Sirius red area in diaphragm of WT and DMDdel52 rats aged 6 and 12 months
Fig. 4
Fig. 4
Heart functional and histological evaluation in R-DMDdel52 rats. a ECG signal of (black) control and (red) R-DMDdel52 rat at 6 months of age. b Quantification of the QTpc interval in WT and R-DMDdel52 rats at 3 and 6 months of age. c Hematoxylin and eosin (upper panel) and Sirius red (lower panel) staining of heart of 3-week-old WT and R-DMDdel52 rats (scale bar = 50 μm). d Hematoxylin and eosin (upper panel) and Sirius red (lower panel) staining of heart of WT and R-DMDdel52 rats aged 3 months (scale bar = 50 μm). e Quantification of fibrotic area in the hearts of WT and R-DMDdel52 rats aged 3 weeks and 3 months. f Hematoxylin and eosin (upper panel) and Sirius red (lower panel) staining of heart of WT and R-DMDdel52 rats aged 6 months (scale bar = 50 μm). g Hematoxylin and eosin (upper panel) and Sirius red (lower panel) staining of heart WT and R-DMDdel52 rats aged 12 months (scale bar = 50 μm). h Quantification of fibrotic area in the hearts of WT and R-DMDdel52 rats aged 6 and 12 months
Fig. 5
Fig. 5
Alterations in fat deposition and inflammatory status in R-DMDdel52 diaphragms. a Hematoxylin and eosin staining of TA from WT and R-DMD-del52 rats aged 12 months (scale bar 20 μm). b Lipid droplet staining by Bodipy immunofluorescence (green) on TA of WT and R-DMDdel52 rats aged 3 weeks and 12 months (scale bar 20 μm). Laminin (white) delineates muscle fibres and nuclei are counterstained with Hoechst (blue). c Quantifications of b. d Immunofluorescence for CD68 (green), CD208 (red), and laminin (white) performed on diaphragms isolated from WT and R-DMDdel52 rats aged 6 months. Nuclei were counterstained with Hoechst (blue). Scale bar 10 μm. e Quantification of the number of CD68-positive or CD206-positive macrophages in 3-week-old and 3-, 6-, 12-month-old WT and R-DMDdel52 muscles. f Quantification of the number of CD68-negative and CD206-positive macrophages (CD206:CD68+) in 3-week-old and 3-, 6-, 12-month-old WT and R-DMDdel52 muscles
Fig. 6
Fig. 6
scRNAseq on 12-month-old R-DMDdel52 diaphragm compared to WT. a T-SNE clustering of rat muscle single-cell into nine populations. b Clustering overlay of WT and DMD muscle single-cells. c Proportion of major cell time of rat WT and DMD muscle cells. d Profiles of known markers in each cell population cluster (Dcn, Cdh5, Pax7, Acta2, Myh4, Ptprc, Ccl6, C1qa, Mrc1). e Representative immunofluorescence for PDGFRα (red) and LAMININ (green) in WT and DMD diaphragms at 12 months of age. Nuclei are counterstained with Hoechst (blue) (scale bar = 10 μm). f Quantification of the number of PDGFRα-positive cells per mm2 in WT and DMD diaphragms at 12 months of age. g Representative staining for ISOLECTIN B4 (red) and nuclei (blue) in diaphragms isolated from WT and DMD rats aged 12 months (scale bar = 20 μm). h Quantification of ISOLECTIN B4-positive vessels per fibre in TA of WT and DMD rats aged 12 months. i Representative immunofluorescence for CD45 (red) and LAMININ (green) in WT and DMD diaphragms at 12 months of age. Nuclei are counterstained with Hoechst (blue) (scale bar = 10 μm). j Quantifications of CD45-positive cells per mm2 in WT and DMD diaphragms at 12 months of age. k Representative immunofluorescence for mCADHERIN (purple) and LAMININ (green) in WT and DMD diaphragms at 12 months of age. Nuclei are counterstained with Hoechst (blue) (scale bar = 10 μm). l Quantifications of the number of mCADHERIN-positive satellite cells per fibre in diaphragms isolated from WT and DMD rats at 12 months
Fig. 7
Fig. 7
Specific Comp expression in DMD FAPs. a T-SNE clustering highlighting FAP population. b Violin plots showing the level of expression of Pdgfrα, Dcn, S100a4, Col8a1, Fabp4, Vim and Comp in WT and DMD diaphragms at 12 months of age. c T-SNE visualisation of Comp expression in WT and DMD FAPs. d Heatmap showing the relative expression of Pdgfrα, S100a4, Fabp4 and Comp in WT and DMD FAPs. e Validation of Comp mRNA expression level in WT and DMD quadriceps at 12 months of age. f Representative immunofluorescence of COMP (red), LAMININ (green) and nuclei (blue) in 12-month-old WT and DMD rat tibialis anterior (scale bar = 20 μm). g Quantification of COMP expression area (f) at 12 months for WT and DMD rats. h Concentration of circulation COMP in sera of WT and R-DMDdel52 rats at 6 and 12 months of age. Values are expressed in ng/ml. i Representative immunofluorescence of COMP (red), LAMININ (green) and nuclei (blue) on control and DMD deltoid biopsies (scale bar = 20 μm). j Quantification the percentage of COMP-positive area on control and DMD human biopsies. k Graphic scheme of COMP expression in DMD fibrotic deposition

References

    1. Acharya C, Yik JH, Kishore A, Van Dinh V, Di Cesare PE, Haudenschild DR. Cartilage oligomeric matrix protein and its binding partners in the cartilage extracellular matrix: interaction, regulation and role in chondrogenesis. Matrix Biol. 2014;37:102–111. doi: 10.1016/j.matbio.2014.06.001. - DOI - PubMed
    1. Agarwal P, Zwolanek D, Keene DR, Schulz JN, Blumbach K, Heinegard D, Zaucke F, Paulsson M, Krieg T, Koch M, et al. Collagen XII and XIV, new partners of cartilage oligomeric matrix protein in the skin extracellular matrix suprastructure. J Biol Chem. 2012;287:22549–22559. doi: 10.1074/jbc.M111.335935. - DOI - PMC - PubMed
    1. Aikawa T, Takeda A, Oyama-Manabe N, Naya M, Yamazawa H, Koyanagawa K, Ito YM, Anzai T. Progressive left ventricular dysfunction and myocardial fibrosis in Duchenne and Becker muscular dystrophy: a longitudinal cardiovascular magnetic resonance study. Pediatr Cardiol. 2019;40:384–392. doi: 10.1007/s00246-018-2046-x. - DOI - PubMed
    1. Andreasson K, Jonsson G, Hesselstrand R, Norrgren H. Persistent elevation of fibrosis biomarker cartilage oligomeric matrix protein following hepatitis C virus eradication. World J Hepatol. 2019;11:330–334. doi: 10.4254/wjh.v11.i3.330. - DOI - PMC - PubMed
    1. Ankala A, Kohn JN, Hegde A, Meka A, Ephrem CL, Askree SH, Bhide S, Hegde MR. Aberrant firing of replication origins potentially explains intragenic nonrecurrent rearrangements within genes, including the human DMD gene. Genome Res. 2012;22:25–34. doi: 10.1101/gr.123463.111. - DOI - PMC - PubMed