. 2022 Apr 25;10(1):61.
doi: 10.1186/s40478-022-01360-5.

Impaired signaling for neuromuscular synaptic maintenance is a feature of Motor Neuron Disease

Affiliations

Impaired signaling for neuromuscular synaptic maintenance is a feature of Motor Neuron Disease

Qiao Ding et al. Acta Neuropathol Commun. .

Abstract

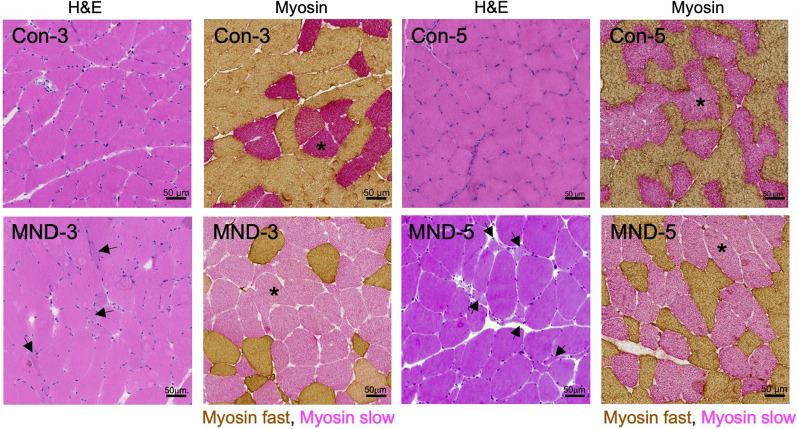
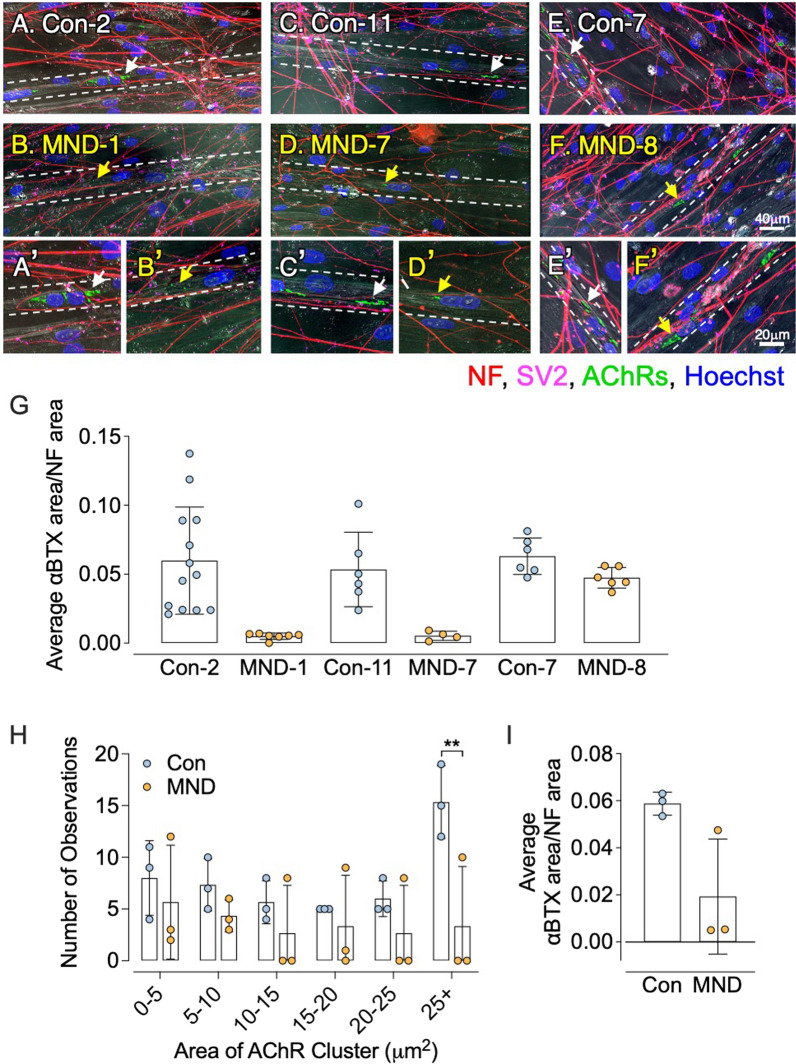
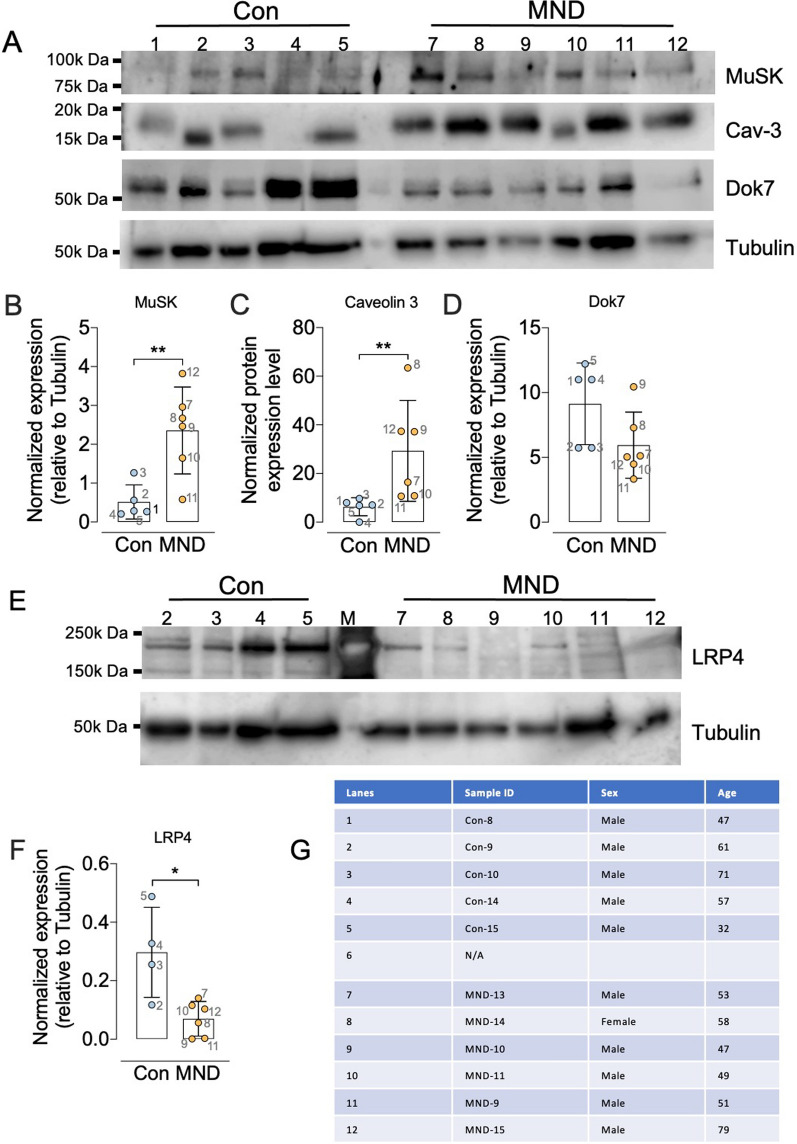
A central event in the pathogenesis of motor neuron disease (MND) is the loss of neuromuscular junctions (NMJs), yet the mechanisms that lead to this event in MND remain to be fully elucidated. Maintenance of the NMJ relies upon neural agrin (n-agrin) which, when released from the nerve terminal, activates the postsynaptic Muscle Specific Kinase (MuSK) signaling complex to stabilize clusters of acetylcholine receptors. Here, we report that muscle from MND patients has an increased proportion of slow fibers and muscle fibers with smaller diameter. Muscle cells cultured from MND biopsies failed to form large clusters of acetylcholine receptors in response to either non-MND human motor axons or n-agrin. Furthermore, levels of expression of MuSK, and MuSK-complex components: LRP4, Caveolin-3, and Dok7 differed between muscle cells cultured from MND patients compared to those from non-MND controls. To our knowledge, this is the first time a fault in the n-agrin-LRP4-MuSK signaling pathway has been identified in muscle from MND patients. Our results highlight the n-agrin-LRP4-MuSK signaling pathway as a potential therapeutic target to prolong muscle function in MND.

Keywords: ALS; Acetylcholine receptors; Agrin; Amyotrophic Lateral Sclerosis; Motor neurons; MuSK; Neuromuscular junction.


Conflict of interest statement

All authors declare no competing interests.

Figures

Fig. 1
Fig. 1
Muscle fiber type grouping occurs in MND patients. Sample cross sections of muscle from non-MND (Con-3 and -5) and from MND patients (MND-3 and -5). Sections were stained with H&E or combination anti-fast plus anti-slow myosin staining (brown stain and red stain respectively). Sections from MND-3 and -5 muscles reveal more grouping of slow myosin fibers (type I fibers;* red stained fibers in 2nd and 4th panels of second row) compared to those from Con-3 and -5, top row. Examples of atrophied (small) muscle fibers can also be seen in the MND sections (arrows). Scale bars = 50 μm
Fig. 2
Fig. 2
Muscle denervation-reinnervation and NMJ disassembly is evident in MND patients. A Maximum projection images of individual NMJs from non-MND and MND muscle biopsies. Motor endplates from four non-MND patients (Con-1, -2, -3 and -4) displayed presynaptic motor terminal endings (red bulbous structures), surrounded by dense clusters of postsynaptic AChRs (green halos, white arrows). NMJs from three MND patients (MND-2, -3 and -4) display varying stages of disassembly indicated by a reduced density or complete loss of postsynaptic AChR clusters that normally surround the nerve terminal endings (single arrows); shrinkage of nerve terminal relative to AChR cluster area (double arrows); terminal axonal thinning and sprouting (black arrow and lightning bolt respectively). NF-SNP = neurofilament and synaptophysin immuno-stain; AChR = 488 Alexa α-bungarotoxin stain. Scale bars = 10 µm. B Transmission electron micrograph of an NMJ from a non-MND subject (Con-4) displays the motor nerve terminal filled with synaptic vesicles (blue arrows), intact mitochondria (yellow arrow), and a terminal Schwann cell (green and pink arrows in all panels) demarcating the pre- and postsynaptic membrane apposition. Deep infoldings of the opposing postsynaptic muscle membrane (postsynaptic junctional folds) contain basal lamina (red arrows in all panels). NMJs from MND-3 (middle panel) shows motor terminal and a flattened motor endplate, with no overlying nerve terminal (black arrow), and signs of damaged mitochondria within the terminal ending (yellow arrow). Right panel reveals terminal Schwann cell invasion into the synaptic cleft (green and arrows)
Fig. 3
Fig. 3
MuSK staining is more diffuse relative to the AChR-rich motor endplate. A Compares the staining areas for acetylcholine receptors (AChRs) and MuSK at the motor endplate from a non-MND (Con-2) donor, and from an MND patient (MND-3). At the motor endplate of MND-3, MuSK staining occupied a larger area compared to the AChR area. By contrast, the MuSK area was a closer match to AChR at the Con-2 motor endplate. B Shows the relative pixel area occupied by AChR and MuSK staining per motor endplate from non-MND donors (Con-1, -2, and 4) and MND patients (MND-1, -3 and -5). At non-MND motor endplates, there appeared to be tight co-localization of AChR and MuSK staining as depicted by the closeness of their respective AChR and MuSK data points. By contrast at MND motor endplates, MuSK occupied a larger area of staining compared to AChR area. Scale bar = 20 μm
Fig. 4
Fig. 4
Differentiation of H9 human embryonic stem cells in culture. A–E Quantification of mRNAs encoding Pax6 (A), Olig2 (B), HB9 (C), ChAT (D) and Islet-1 (E) (n = 3). F Sample visual field of differentiated H9 cells labeled for ChAT, Islet-1, and nuclei (DAPI). Lower right panel shows the merge of ChAT and Islet-1 fluorescence. Scale bar for F = 100 μm. G A time series showing the calcium flux in differentiated neurons after addition of 50 mM KCl at time zero. Scale bar for G = 160 μm. The inset graph shows the time course of intracellular Ca2+ mobilization revealed by Ca2+ sensor fluorescence GCaMP6f. ΔF/F0 represents the fluorescence intensity relative to the initial fluorescence intensity. Data presented in A–E are means ± SDs, expression data analyzed using one-way ANOVA with Bonferroni’s multiple comparisons test. *p ≤ 0.05, **p ≤ 0.01, ***p ≤ 0.001, ****p ≤ 0.0001
Fig. 5
Fig. 5
Muscle grown from MND patients responded poorly to human motor axons. A Timeline for human derived MNs innervating human skeletal muscle in a microfluidic culture system. B Representative visual fields showing axons of H9 stem cell-derived motor neurons (H9 MNs) immunostained for neurofilament (NF, white arrow). MN axons grew along the microgrooves (white arrow) to enter the muscle chamber. Direction of axonal growth is indicated by the yellow arrow. D Representative visual field from the muscle chamber, showing neurofilament (red) and SV2 (pink) positive H9 motor axons intermingled with muscle cells grown from a non-MND donor. White arrows indicate large AChR clusters (green) that were located close to NF/SV2-positive axons.  E Muscle cells sourced from an MND patient displaying small AChR clusters (green, yellow arrows) adjacent to NF/SV2 positive axons. Muscle cell nuclei in C, D were labelled with Hoechst 33,342 (blue)
Fig. 6
Fig. 6
Nerve-induced acetylcholine receptor clustering is impaired in muscle from MND patients. A–F Sample visual fields showing human myotube cultures innervated by H9 human axons labeled for neurofilament-SV2 (red-pink) and AChRs clusters (green). Three paired sets of non-MND versus MND muscle cells (matched for sex and approximate age) are compared (A vs B, C vs D, E vs F). Insets (A′, B′, C′, D′, E and F′) show the AChR clusters indicated by arrows at higher magnification. Dotted white lines indicate the edge of the myotubes. White arrows in A′, C′ and E′ indicate large AChR clusters proximal to NF-SV2 labeled motor axons. Yellow arrows in B′, and D′ indicate small AChR clusters close to NF-SV2 labeled motor axons. Yellow arrows in F′ show large AChR clusters close to NF-SV2 labeled motor axons. Scale bars for AF = 40 µm, and for A′F′ = 20 µm. G Quantitation of the area of AChR clusters, expressed as a fraction of the total area of axons averaged from 3 visual fields per MN-muscle sample, as per [56]. H Frequency histogram showing a significantly greater number of large AChR clusters (> 25 µm2) on myotubes of control cultures compared to MND cultures (n = 3 patients). I Total area of AChR clustering (large plus small clusters) per microscope field. Data points show results from individual data presented in G, (n = 3 patients). Data presented as mean ± SD. For H, data was analyzed using two-way ANOVA, followed by Bonferroni’s multiple comparisons test (**p ≤ 0.01)
Fig. 7
Fig. 7
Muscle cells from MND patients show similar proliferation and fusion capacity, but a lower plate density. (A left panels) Desmin staining (red fluorescence) identifies mono-nucleated muscle cells sourced from a non-MND donor (Con-8) and a MND donor (MND-16) at 3 days in culture (~ 80% confluency). (A right panels) Desmin-labeled multinucleated myotubes from Con-8 and MND-16 (arrows). Scale bar = 20 µm. B First two bars show the number of days required for mononucleated cells to proliferate and reach 80% confluency. Non-MND and MND sourced cells appeared to proliferate at a similar rate. The third and fourth bars compare the days required for myoblasts from non-MND and MND donors to fuse to form multinucleated myotubes. There was no difference between MND and non-MND in the time required for myotube formation (n = 8 for control and n = 10 for MND). C Shows representative visual fields of myosin heavy chain (MHC) positive myotubes from matched control (Con) donors and MND patients (Con-2/MND-1, Con-11/MND-7, Con-7/MND-8). White dashed lines delineate the upper edge of a myotube. Scale bar = 20 μm. D Percentage of MHC positive multi-nucleated myotubes (≥ 3 nuclei/visual field) that were averaged across 6 visual fields per muscle sample. All non-MND (control) muscle cultures produced more MHC positive myotubes per visual field, compared to cultures from MND patients. E Quantitation of myotube diameters. MND myotubes were slender compared to non-MND myotubes. Each symbol represents the average for a single non-MND or MND donor. All data presented as mean ± SD. B Data analyzed by two-way ANOVA followed by Bonferroni multiple comparisons test. E Data analyzed by unpaired t test, where **p ≤ 0.01
Fig. 8
Fig. 8
Cells cultured from muscle of MND patients produce fewer desmin-positive myoblasts, compared those from matched non-MND donors. A Representative visual field of desmin-positive cells cultured from matched control donors (Con, non-MND) and MND patients, black bars in B indicate the relative pairing of Con (non-MND) with MND samples. Scale bar = 40 μm. B Percentage of cells that stained positive for desmin, 3 days after removal of the growth medium (mean ± SD). Each symbol represents results from one non-MND or MND donor (averaged across 4–7 visual  fields per cultured muscle sample). Cells cultured from MND donor muscle revealed a lower percentage of myoblasts, when compared to their matched non-MND control muscle culture. C Pooled data showing a significantly lower percentage of desmin-positive cells in cultures from MND muscle compared to cultures from control (Con) muscle. All data presented as mean ± SD. For C, data analyzed by unpaired t test where *p ≤ 0.05
Fig. 9
Fig. 9
Transcriptomic analysis of muscle cell culture nuclei derived from human muscle stem cells identifies fibroblastic and muscle cell types with no apparent bias across MND status. A Whole-transcriptome expression profile patterns for individual nuclei derived from control (Con-13, Con-16) and MND donor (MND-16, MND-9) lines. Distinct expression profile patterns have been reduced to two-dimensions in this Uniform Manifold Approximation and Projection (UMAP) plot. Each point shows results for a single nucleus. MND and non-MND nuclei (pink and blue) are co-clustered in the UMAP, indicating similar patterns of whole-transcriptome expression between MND and controls. B Nuclei annotated for cell-type, identifying two distinct populations: mature skeletal muscle and fibroblasts. C Transcript dot plot comparing levels of expression for some key components of the n-agrin-MuSK signaling cascade in two MND samples versus two non-MND samples (see Additional file 1: Figure S5 for full data set). All four samples show transcripts consistent with their expression in muscle cells. Expression patterns of n-agrin-MuSK signaling transcripts appeared comparable between MND and control. Further, all samples do have nuclei that express transcripts associated with maturing muscle skeletal muscle
Fig. 10
Fig. 10
Sample images showing AChR clusters on myotubes cultured from non-MND and MND muscle before and after n-agrin treatment. A Sample field of desmin-positive myotubes cultured from muscle of non-MND patient Con-6, prior to n-agrin treatment. Small and occasional large AChR clusters are evident (yellow and white arrows respectively). A′ and A″ These AChR clusters at higher magnification. B Sample field of desmin-positive myotubes from Con-6 after n-agrin treatment. Large and small AChR clusters appear more numerous after n-agrin treatment (arrows and magnified views are shown in B′ and B″). C, D Comparable sample fields of myotubes cultured from MND-8 (C) before and (D) after n-agrin treatment. Only small AChR clusters are visible both before and after n-agrin treatment (white arrows in C and D and their high-powered views: C′C″ no n-agrin, and D′D″ plus n-agrin). Scale bars = 50 µm
Fig. 11
Fig. 11
Muscle cells cultured from MND patients fail to grow AChR clusters in response to n-agrin treatment. A Myotubes cultured from individual non-MND donors formed large AChR clusters in response to n-agrin. Histograms compare the frequency of large (> 25 µm2) AChR clusters in cultures treated with (+) and without (−) n-agrin. Six out of seven non-MND donors showed an increase in the frequency of large AChR clusters in response to n-agrin treatment (exception being Con-9, see also Additional file 1: Figure S6). B Myotubes cultured from MND patients responded poorly to n-agrin. Apart from MND-14, none of the MND patient cultures showed any increase in the frequency of large (> 25 µm2) AChR clusters in response to n-agrin treatment. C Frequency distributions compare the sizes of AChR clusters on myotubes with and without n-agrin treatment. Each symbol represents the means ± SD for technical replicates; Additional file 1: Figure S6. (C upper graph) Myotubes cultured from non-MND (control) muscle with and without n-agrin treatment (pooled data from 7 donors). (C lower graph) Myotubes cultured from MND patient muscle with and without n-agrin treatment (pooled data from 9 patients: Additional file 1: Figure S7). D After n-agrin treatment, total area of clustered AChRs was significantly increased in control myotubes (n = 7, blue and white symbols). No significant change in total area of clustered AChRs was found in MND myotubes after n-agrin treatment (n = 9, yellow and white symbols; data presented as a log of plus (+) n-agrin over no (minus, −) n-agrin treatment). All data presented as mean ± SD and analyzed by two-way ANOVA with Bonferroni’s multiple comparison test where **p ≤ 0.01
Fig. 12
Fig. 12
Levels of n-agrin effector proteins are altered in muscle cultures from MND patients. A Sample immunoblot comparing the relative intensity of MuSK, Caveolin-3 and Dok7 bands in myotube cultures derived from 4–5 non-MND donors and 6 MND patients. Antibodies revealed bands of the expected molecular weight for MuSK (~ 97 kDa), Caveolin-3 (~ 20 kDa) and Dok7 (~ 55 kDa). Each band was normalized to a tubulin loading control band from the same lane (shown beneath). Comparison of the normalized band intensities for B MuSK, C Caveolin-3, and D Dok7. E Sample immunoblot for LRP4 (~ 212 kDa). F Compares the normalized band intensities for LRP4 in non-MND and MND myotube cultures. Symbols each represent cultures from an individual donor (blue and yellow data). G Key showing the source of the samples run in the indicated lanes of the immunoblots. All data presented as mean ± SD and were analyzed using unpaired t-tests where *p ≤ 0.05 and **p ≤ 0.01

References

    1. Al-Chalabi A, et al. Amyotrophic lateral sclerosis: moving towards a new classification system. Lancet Neurol. 2016;15(11):1182–1194. doi: 10.1016/S1474-4422(16)30199-5. - DOI - PubMed
    1. Maselli RA, et al. Neuromuscular transmission in amyotrophic lateral sclerosis. Muscle Nerve. 1993;16(11):1193–1230. doi: 10.1002/mus.880161109. - DOI - PubMed
    1. Moloney EB, de Winter F, Verhaagen J. ALS as a distal axonopathy: molecular mechanisms affecting neuromuscular junction stability in the presymptomatic stages of the disease. Front Neurosci. 2014;8:252. doi: 10.3389/fnins.2014.00252. - DOI - PMC - PubMed
    1. Bruneteau G, et al. Endplate denervation correlates with Nogo-A muscle expression in amyotrophic lateral sclerosis patients. Ann Clin Transl Neurol. 2015;2:362–372. doi: 10.1002/acn3.179. - DOI - PMC - PubMed
    1. Campanari ML, Bourefis AR, Kabashi E. Diagnostic challenge and neuromuscular junction contribution to ALS pathogenesis. Front Neurol. 2019;10:68. doi: 10.3389/fneur.2019.00068. - DOI - PMC - PubMed

Publication types

LinkOut - more resources