. 2022 Apr 25;13(1):2231.
doi: 10.1038/s41467-022-29673-y.

A structural exposé of noncanonical molecular reactivity within the protein tyrosine phosphatase WPD loop

Affiliations

A structural exposé of noncanonical molecular reactivity within the protein tyrosine phosphatase WPD loop

Huanchen Wang et al. Nat Commun. .

Abstract

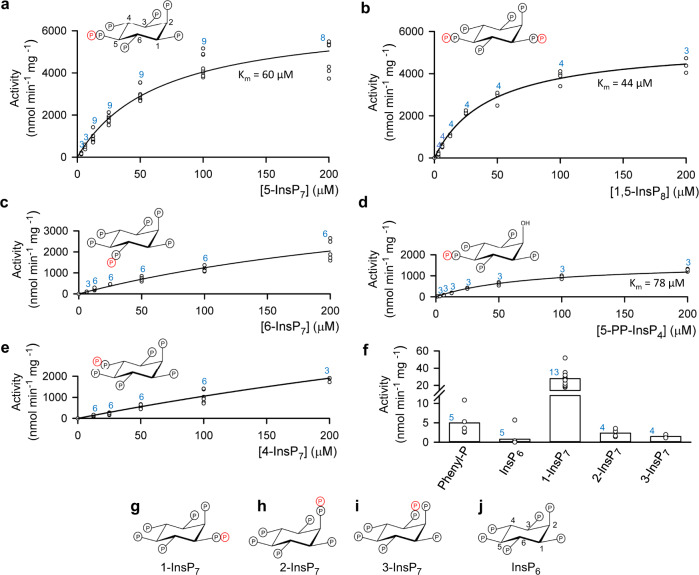
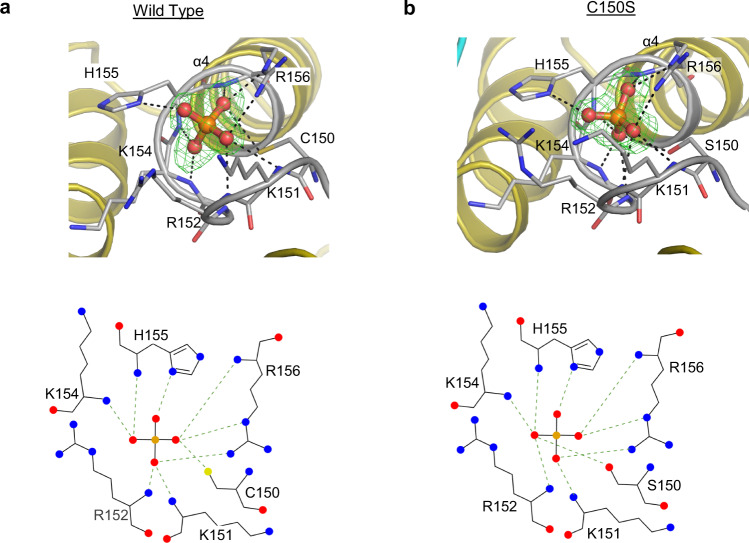
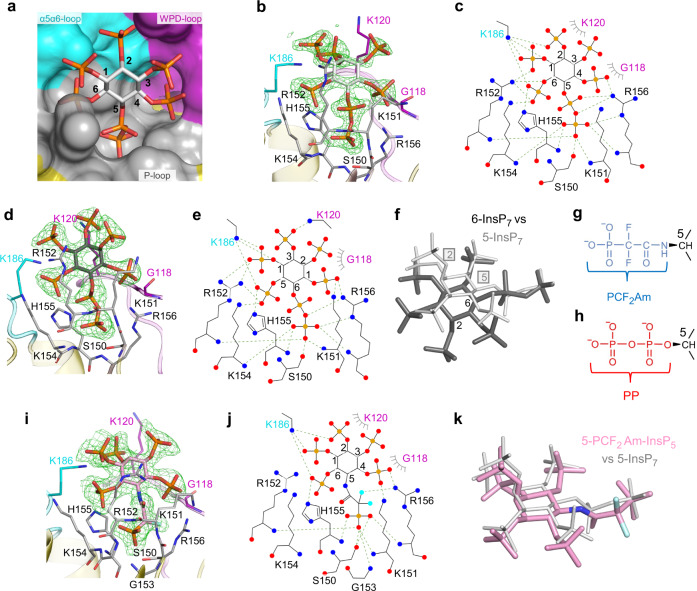
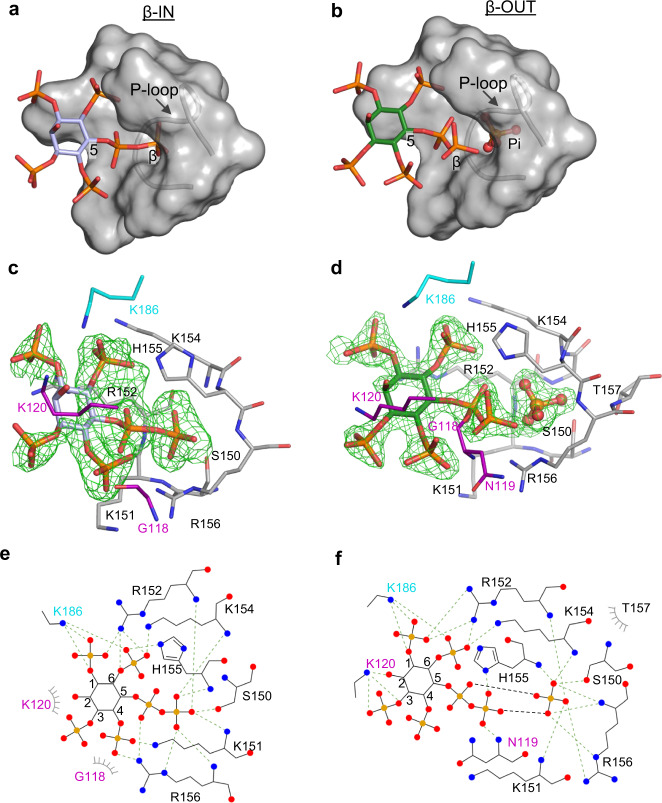
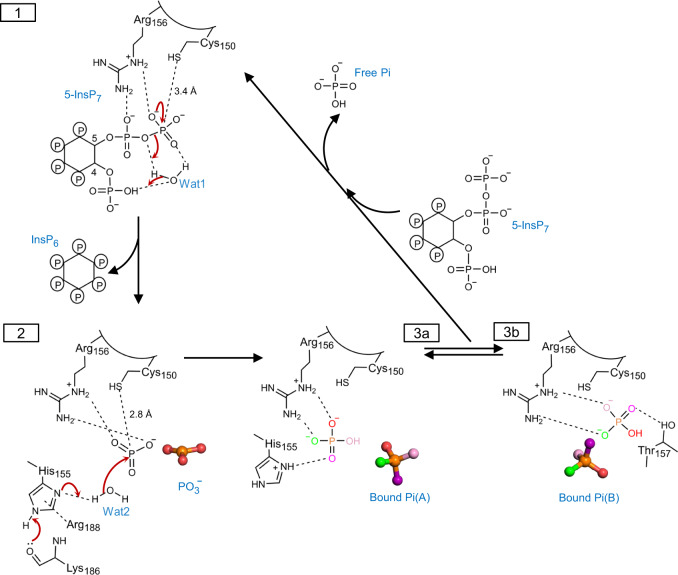
Structural snapshots of protein/ligand complexes are a prerequisite for gaining atomic level insight into enzymatic reaction mechanisms. An important group of enzymes has been deprived of this analytical privilege: members of the protein tyrosine phosphatase (PTP) superfamily with catalytic WPD-loops lacking the indispensable general-acid/base within a tryptophan-proline-aspartate/glutamate context. Here, we provide the ligand/enzyme crystal complexes for one such PTP outlier: Arabidopsis thaliana Plant and Fungi Atypical Dual Specificity Phosphatase 1 (AtPFA-DSP1), herein unveiled as a regioselective and efficient phosphatase towards inositol pyrophosphate (PP-InsP) signaling molecules. Although the WPD loop is missing its canonical tripeptide motif, this structural element contributes to catalysis by assisting PP-InsP delivery into the catalytic pocket, for a choreographed exchange with phosphate reaction product. Subsequently, an intramolecular proton donation by PP-InsP substrate is posited to substitute functionally for the absent aspartate/glutamate general-acid. Overall, we expand mechanistic insight into adaptability of the conserved PTP structural elements.


Conflict of interest statement

The authors declare no competing interests.

Figures

Fig. 1
Fig. 1. Structures of ligands used in this study and their rates of hydrolysis by AtPFA-DSP1.
Michaelis–Menten kinetic plots are shown for the phosphatase activities of AtPFA-DSP1 towards: (a), 5-InsP7, (b), 1,5-InsP8, (c), 6-InsP7, (d), 5-PP-InsP4 and (e), 4-InsP7. Activity data (circles, some overlapping) are from each independent experiment at which the indicated substrate concentration was tested; the total number of such experiments is given above each data set in blue font. Km values were calculated when statistically appropriate. The insets in panels (ae) depict chair conformations of each substrate; the positions of each β-phosphate are emphasized in red. In panel (f), vertical bars represent mean values of activities against the weakest substrates when all were assayed at 10 µM concentrations. Activity data (circles, some overlapping) are from each independent experiment; the total number of such experiments is given above each data set in blue font. Phenylphosphate is abbreviated as Phenyl-P. Structures of the inositol phosphates are given as chair conformations in panels (g) (1-InsP7), (h) (2-InsP7, (i) (3-InsP7) and (j) (InsP6). Locants (using standard nomenclature for myo-inositol) are provided with the structures of 5-InsP7 and InsP6. Source data are provided as a Source Data file.
Fig. 2
Fig. 2. Description of the Pi(A) orientation associated with crystals of freshly purified AtPFA-DSP149–215 and AtPFA-DSP149–150,C150S,151–215.
Panels (a, b), show the phosphate ion in stick and ball format (phosphorus is orange and oxygen in red) within a mixed stick- and ribbon-style rendition of the catalytic center of wild type and the C150S protein constructs, respectively (nitrogen is blue, sulfur is yellow). The omit Fo-Fc electron density maps, contoured at 5σ, are shown in green mesh; broken black lines show polar contacts. Corresponding ligand–protein interactions created by Ligplot+ are shown below each graphic. Source data are provided for (a, b) as PDB accession codes 7MOK and 7MOD, respectively.
Fig. 3
Fig. 3. Binding of 5-InsP7, 6-InsP7 and 5-PCF2Am-InsP5 by AtPFA-DSP149–215.
a Surface representation colored to match structural elements correspond to gray for P-loop, cyan for α5-α6 loop, purple for WPD-loop, and yellow for the remainder. The 5-InsP7 is shown in stick format; carbon is white, phosphorus is orange and oxygen is red. Phosphate groups are numbered according to standard nomenclature. Panel (b) shows a similar orientation of 5-InsP7, with key interacting residues in stick format; nitrogen is blue, and oxygen. Panel (c) is a rendering of the ligand–protein interactions created by Ligplot+. Polar contacts within 3.2 Å are depicted with broken green lines. Hydrophobic interactions are shown in grey eyelash style. Equivalent data are shown in panels (d, e) for 6-InsP7 as the ligand; the latter’s carbons are colored dark gray. Panel (f) superimposes 6-InsP7 (dark gray; numbers denote positions of 2- and 6-phosphates) upon 5-InsP7 (light gray; boxed numbers denote 2- and 5-phosphates). Panels (g, h) compare the chemical structures of the α-phosphono-α,α-difluoroacetamide group (PCF2Am; blue) and the 5-diphosphate group (PP; red)respectively. Panels (i, j), show binding interactions for 5-PCF2Am-InsP5 (carbon is pink, and fluorine is cyan). Panel (k) superimposes 5-PCF2Am-InsP5 upon 5-InsP7 using the same color schemes as in panels (i, f) The omit Fo-Fc electron density maps, contoured at 5σ, are shown in green mesh. Source data files are provided as PDB accession codes 7MOE, 7MOF and 7MOG.
Fig. 4
Fig. 4. AtPFA-DSP1 binds 5-PP-InsP4 in two orientations, which are associated with either the presence or absence of Pi.
Panels (a, b) are surface representations of the ligand binding pocket, with 5-PP-InsP4 drawn in stick format, in poses labeled β-IN (pale lavender carbons) and β-OUT (green carbons), respectively; phosphorus is orange and oxygens are red. Note the presence of Pi(B) (in stick and ball format) in panel (b). Panels (c, d) show the corresponding stick depictions of 5-PP-InsP4 and its interacting amino-acid residues (nitrogens are colored blue). The Fo-Fc electron density maps (green mesh) are contoured at 3σ in panel (c) and 5σ in panel (d). Panels (e, f) are renderings of the corresponding ligand–protein interactions created by Ligplot+. The source data file is provided as PDB accession code 7MOH.
Fig. 5
Fig. 5. Analysis of Pi mobility inside the catalytic center.
a Pi(B), in stick and ball format (phosphorus is orange, oxygen is red), in a crystal structure complex with AtPFA-DSP149–215 (PDB accession code 7MOL) obtained in the absence of mercaptoethanol (see text). Broken lines depict polar interactions of Pi(B) (≤3.2 Å) with nearby residues (nitrogens are blue). The Fo-Fc electron density map (green mesh) is contoured at 5σ. b corresponding rendering of the ligand–protein interactions created by Ligplot+. c Pi(B) from panel (a) is superimposed upon Pi(A) (taken from Fig. 2a); the P-loops of the corresponding proteins are colored gray for Pi(B) and light brown/dark brown for Pi(A). Note the two conformations of Cys150, one of which may form a disulfide bond (see panel a). d, e the movement of the phosphorus atom is indicated by the orange trace, and each of the oxygen atoms of Pi(A) were arbitrarily colored either purple, light pink, red or green; this color scheme illustrates the predicted movements of each atom during molecular dynamics simulations, with reference to the plane of the backbone residues of the P-loop (blue rectangle; residues 151–156). Horizontal bars illustrate the switching between Pi poses A (black) and B (white). The coloration in this simulation has been transferred to Pi(B) in panels (c) and (e). Three additional replicates of the data in panel (d) are provided in Supplementary Fig. S8, and the initial 1000 ns of each of these aspects of all four simulations are animated in Supplementary Movies 1, 2, 3 and 4. Source data are provided as a Source Data file.
Fig. 6
Fig. 6. The formation of a metaphosphate-like reaction intermediate in AtPFA-DSP149–215.
a the relative positions of a catalytic water (Wat1; pink sphere) and 5-InsP7 (stick format) in a crystal complex with AtPFA-DSP149–150,C150S,151–215 (PDB accession code 7MOD); polar interactions are highlighted with broken black lines, with bond distances marked in Å. The omit Fo-Fc electron density map is contoured at 5σ and shown in green mesh. b a reaction intermediate that we designate to be a metaphosphate anion (ball and stick format; orange for phosphorus, red for oxygens). The crystal complex depicted in this panel was obtained by soaking 0.1 mM 5-InsP7 into AtPFA-DSP149–215 at pH 8.0 for 2 h (7MOM; Supplementary Table 1). Broken black lines designate polar interactions with residues (stick format; blue for nitrogen, yellow for sulfur). The omit Fo-Fc electron density map is contoured at 4σ and shown in green mesh. A putative reactive water molecule (Wat2) is shown as a purple sphere. Distances are described in Å. His155 is shown in Nε2-protonated τ tautomer state. c relative positions of Wat2 and the putative metaphosphate to illustrate distances between elements (Å); those within polar interaction distance are depicted as broken gray lines. The omit Fo-Fc electron density map is contoured at 4σ and shown in green mesh. Panel (d) is a rendering of the corresponding ligand–protein interactions created by Ligplot+. Panel (e) shows polar interactions (<3.2 Å; broken black lines) that Cys150 has with Thr157 and His149.
Fig. 7
Fig. 7. Proposed relationship between structural snapshots for AtPFA-DSP1 in the context of 5-InsP7 hydrolysis.
Key polar contacts are highlighted with black dashed lines. Coloring of oxygen atoms is only for illustrative purposes. State 1 depicts presumed canonical nucleophilic attack by Cys150 on the β-phosphate of enzyme-bound 5-InsP7. We presume a thiophosphate intermediate is formed, although we did not capture one in our crystals. Also shown is a water molecule (Wat1) that we postulate to shuttle a proton from the substrate’s 4-phosphate to the diphosphate’s bridging oxygen, with the release of InsP6 product. State 2 depicts the proposed activation by His155 of a second reactive water (Wat2) to facilitate its capture by an enzyme-stabilized metaphosphate intermediate. The resulting enzyme-bound Pi, rotating between its ‘A’ and ‘B’ orientations, are depicted in States 3a and 3b. Despite this limited mobility, Pi remains trapped within the active site until a prisoner exchange with fresh substrate, so that a new catalytic cycle can begin. Some cautionary notes: all protonation states are illustrative and not definitive (nevertheless, there is consensus that the phosphate group that is targeted for hydrolysis by PTPs is di-anionic), and it has previously been argued a metaphosphate intermediate cannot exist (see main text for further discussion).

References

    1. Hengge AC. Kinetic isotope effects in the characterization of catalysis by protein tyrosine phosphatases. Biochim Biophys. Acta. 2015;1854:1768–1775. doi: 10.1016/j.bbapap.2015.03.010. - DOI - PMC - PubMed
    1. Alonso A, Pulido R. The extended human PTPome: a growing tyrosine phosphatase family. FEBS J. 2015;283:1404–1429. doi: 10.1111/febs.13600. - DOI - PubMed
    1. Tautz L, Critton DA, Grotegut S. Protein tyrosine phosphatases: structure, function, and implication in human disease. Methods Mol. Biol. 2013;1053:179–221. doi: 10.1007/978-1-62703-562-0_13. - DOI - PMC - PubMed
    1. Tonks NK. Protein tyrosine phosphatases-from housekeeping enzymes to master regulators of signal transduction. FEBS J. 2013;280:346–378. doi: 10.1111/febs.12077. - DOI - PMC - PubMed
    1. Bheri M, Mahiwal S, Sanyal SK, Pandey GK. Plant protein phosphatases: what do we know about their mechanism of action? FEBS J. 2021;288:756–785. doi: 10.1111/febs.15454. - DOI - PubMed

Publication types