. 2022 Apr 25;13(1):2226.
doi: 10.1038/s41467-022-29644-3.

Transcription factors AP-2α and AP-2β regulate distinct segments of the distal nephron in the mammalian kidney

Affiliations

Transcription factors AP-2α and AP-2β regulate distinct segments of the distal nephron in the mammalian kidney

Joseph O Lamontagne et al. Nat Commun. .

Abstract

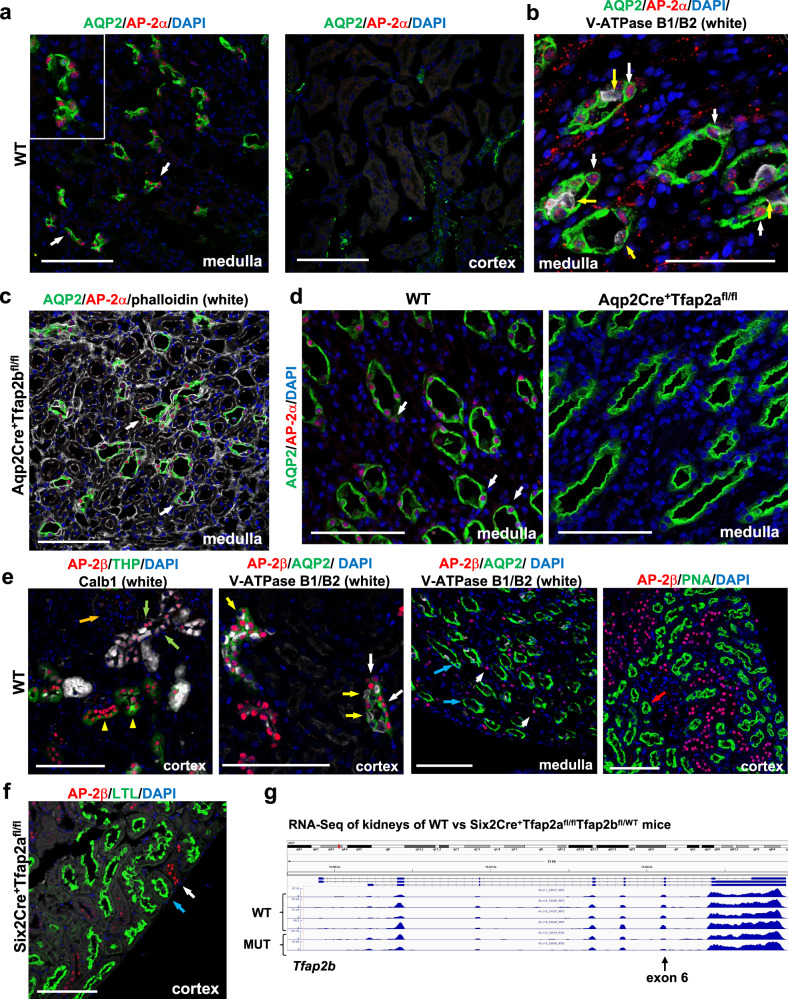
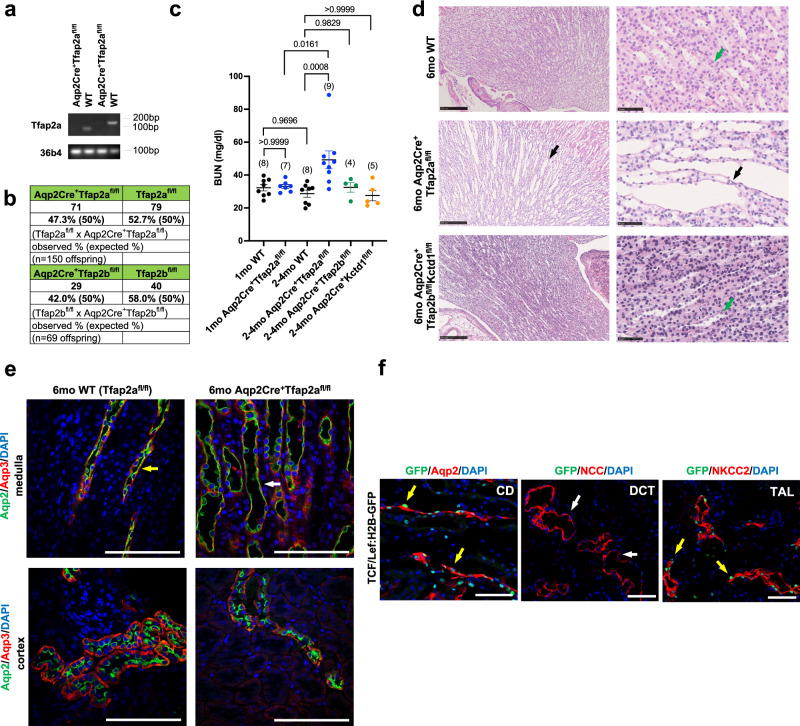
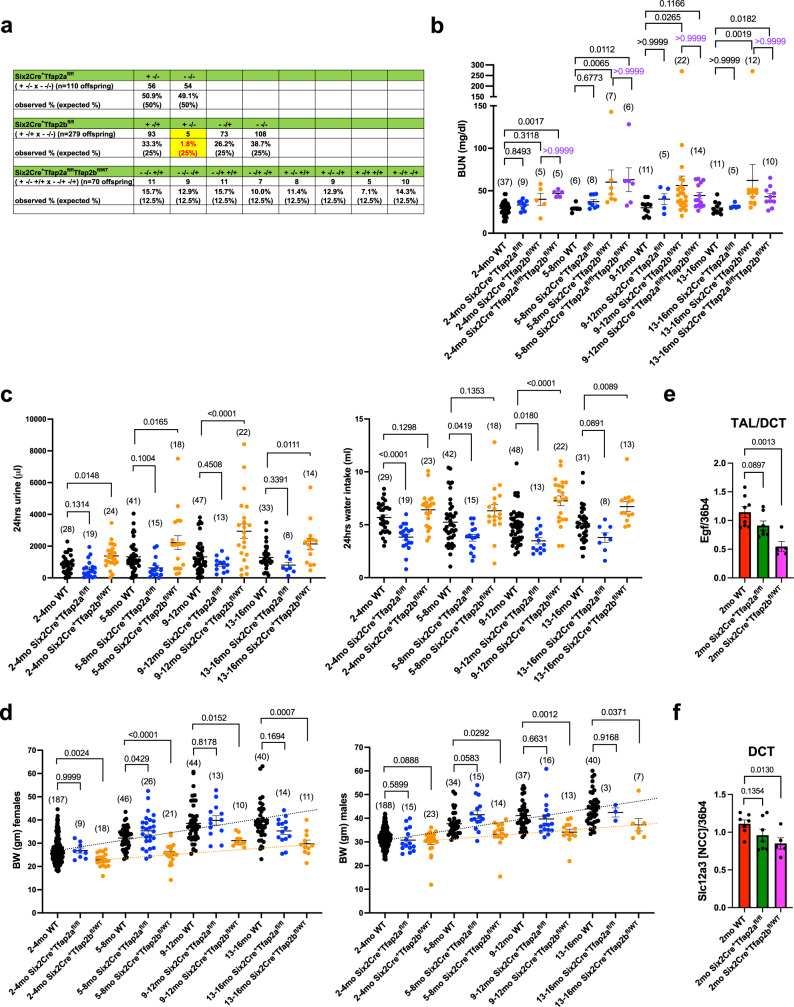
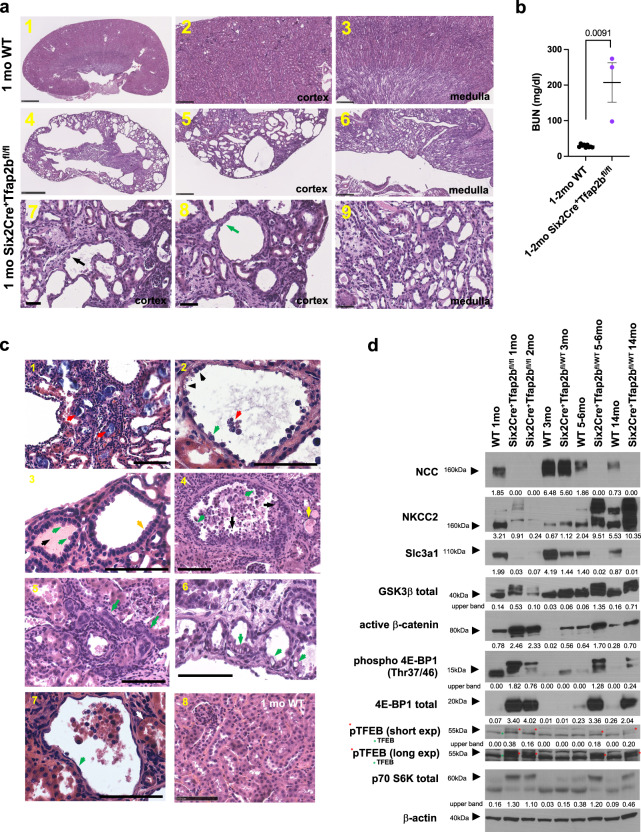
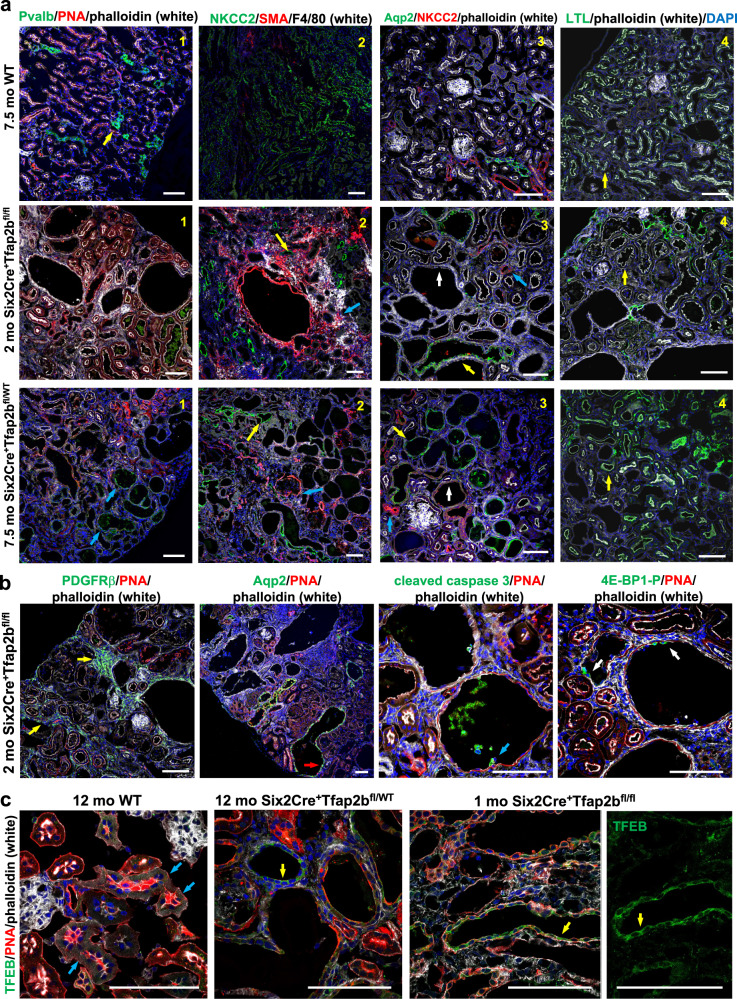
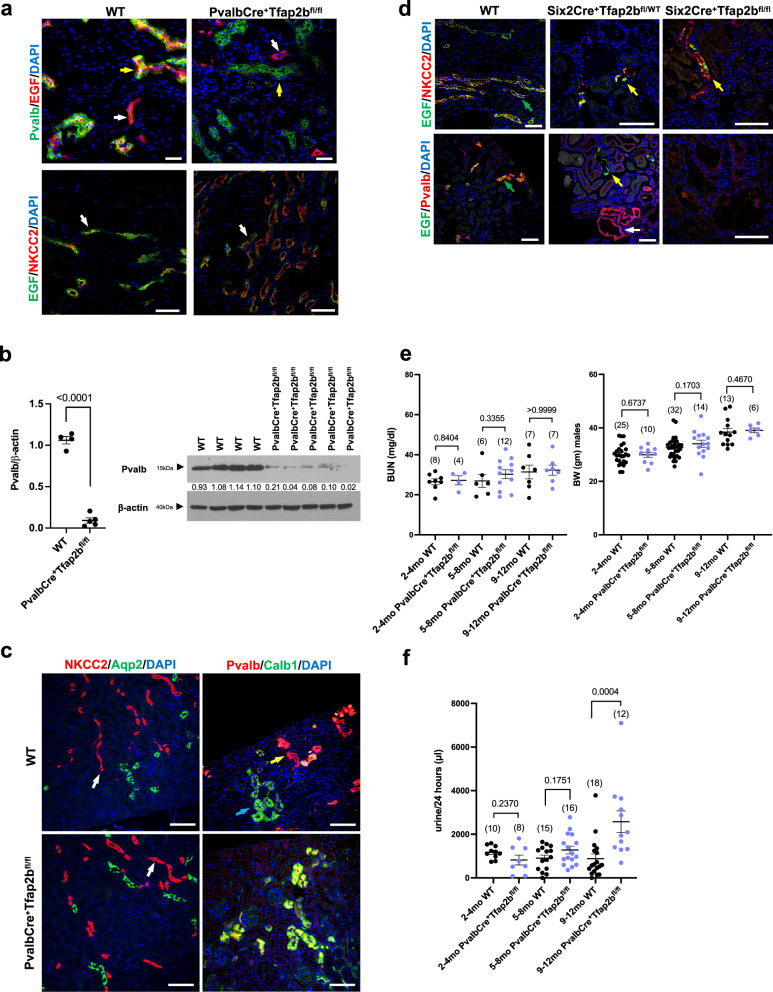
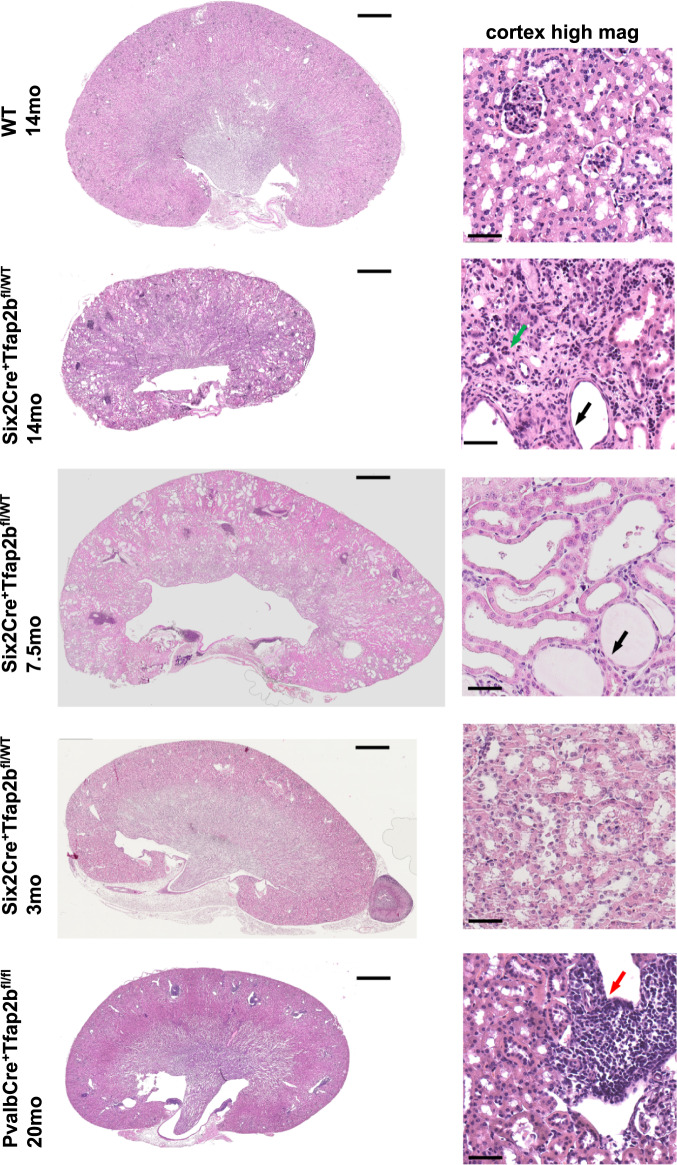
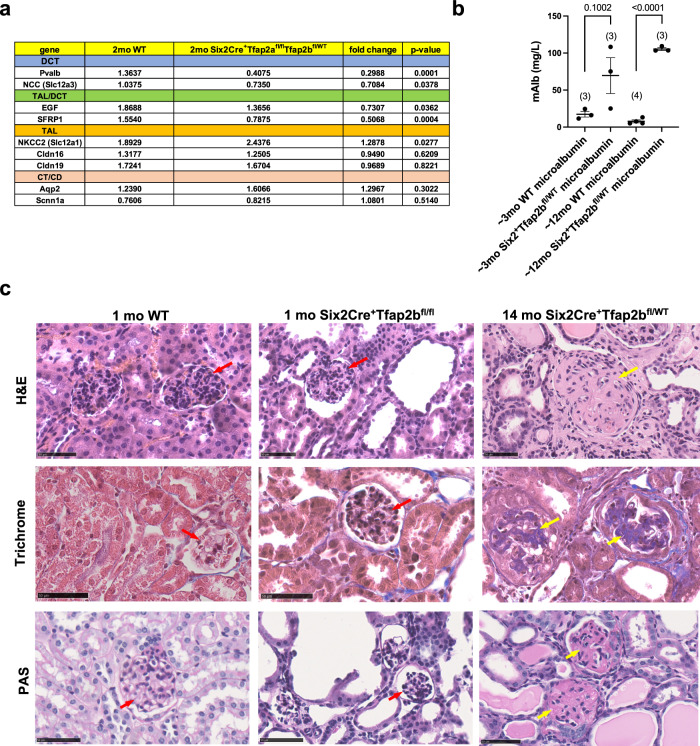
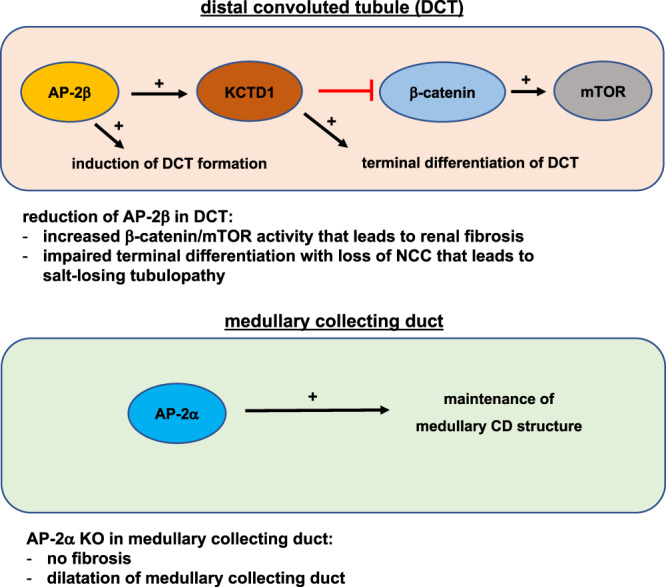
Transcription factors AP-2α and AP-2β have been suggested to regulate the differentiation of nephron precursor populations towards distal nephron segments. Here, we show that in the adult mammalian kidney AP-2α is found in medullary collecting ducts, whereas AP-2β is found in distal nephron segments except for medullary collecting ducts. Inactivation of AP-2α in nephron progenitor cells does not affect mammalian nephrogenesis, whereas its inactivation in collecting ducts leads to defects in medullary collecting ducts in the adult. Heterozygosity for AP-2β in nephron progenitor cells leads to progressive distal convoluted tubule abnormalities and β-catenin/mTOR hyperactivation that is associated with renal fibrosis and cysts. Complete loss of AP-2β in nephron progenitor cells caused an absence of distal convoluted tubules, renal cysts, and fibrosis with β-catenin/mTOR hyperactivation, and early postnatal death. Thus, AP-2α and AP-2β have non-redundant distinct spatiotemporal functions in separate segments of the distal nephron in the mammalian kidney.


Conflict of interest statement

The authors declare no competing interests.

Figures

Fig. 1
Fig. 1. AP-2α and AP-2β proteins are present in distinct distal nephron segments of the adult mouse kidney, and their expression occurs independently of each other.
a Immunolabeling for AP-2α shows nuclear localization in medullary Aqp2+ CDs (left [arrows]; inset shows magnified area) but not in cortical Aqp2+ CDs or CTs (right). Scale bars, 100 μm. b AP-2α protein localization to Aqp2+ principal cells of medullary CDs (white arrows), but no or low levels of AP-2α are detected in intercalated cells (V-ATPase B1/B2; yellow arrows) of medullary CDs. Scale bar, 50 μm. c Medullary CD localization of AP-2α is not affected by inactivation of AP-2β activity in Aqp2Cre+Tfap2bfl/fl mice (white arrows). Scale bars, 100 μm. d Immunolocalization of AP-2α protein to Aqp2+ principal cells of medullary CDs, as seen in WT mice (white arrows), is lost in Aqp2Cre+Tfap2afl/fl mice. 5-months-old littermates. Scale bars, 100 μm. e Co-Immunolabelings for AP-2β with the anti-AP-2β antibody from Atlas in adult WT kidneys show that AP-2β is detected in TALs (THP+; yellow arrowheads), DCTs (Calb1+; green arrows), and cortical CTs/CDs (Aqp2+; yellow arrows) but not in glomeruli (orange arrow) or in PTs (PNA labeling; red arrow). In CTs/cortical CDs, AP-2β is detected in principal cells (Aqp2+; white arrows) but not in intercalated cells (V-ATPase B1/B2+; yellow arrows). In the inner medulla, medullary CDs (Aqp2+; blue arrows) show no immunolabeling for AP-2β that is only detected in adjacent non-CD nephron segments (short white arrows). Scale bars, 100 μm. f The distal nephron localization of AP-2β protein is not affected by the lack of AP-2α activity in these nephron segments (Six2Cre+Tfap2afl/fl mice; white arrow). PTs (LTL+) show no AP-2β immunolabeling (blue arrow). Immunolabeling with anti-AP-2β antibody from Cell Signaling Technology. Scale bars, 100 μm. g RNA-Seq data of whole kidney lysates from two 2-months-old Six2Cre+Tfap2afl/flTfap2bfl/WT mice and from four Cre-negative control littermates (WT) show that Cre activity effectively removes exon 6 of the Tfap2b gene, which is critical for DNA binding and activity of AP-2β. Transcription of the Tfap2b gene occurs despite the inactivation of AP-2α function in the same cells.
Fig. 2
Fig. 2. AP-2α regulates medullary CD structure in the adult but is not required for CD development.
a RT-PCR of whole kidney lysates of Aqp2Cre+Tfap2afl/fl mice and Cre-negative littermates (WT) with two different PCR primer pairs that span exons 5/6 of Tfap2a. Kidneys of Aqp2Cre+Tfap2afl/fl mice show efficient inactivation of Tfap2a. 36b4 housekeeping gene. DNA ladder band size is indicated. b Aqp2Cre+Tfap2afl/fl mice and Aqp2Cre+Tfap2bfl/fl mice show a normal Mendelian ratio at 4-weeks of age. c Serum BUN levels are normal in 1-month-old Aqp2Cre+Tfap2afl/fl mice but they are increased at 2–4 months of age, whereas at that age BUN levels remain normal in Aqp2Cre+Tfap2bfl/fl mice or Aqp2Cre+KCTD1fl/fl mice. Adjusted p values are shown (one-way ANOVA with Tukey’s multiple comparisons test). Graphs represent data as mean ± SEM. Number of mice per group is indicated in brackets. Source data are provided as a Source Data File. d Dilated medullary CDs with flattened epithelial cells (black arrows) in 6-months-old Aqp2Cre+Tfap2afl/fl mice, but not in WT littermates (Tfap2afl/fl mice) or Aqp2Cre+Tfap2bfl/flKctd1fl/fl mice (green arrows). Scale bars, 250 μm left, and 50 μm right. e Immunolabeling for Aqp2 and Aqp3 show dilated medullary CDs in 6-months-old Aqp2Cre+Tfap2afl/fl mice (white arrow) compared to WT littermates (yellow arrow), whereas cortical CDs/CTs appear normal. Scale bars, 100 μm. f TCF/Lef:H2B-GFP mice serve as reporter mice for cellular β-catenin activity (GFP+ cells): GFP+ cells (yellow arrows) are detected in CDs (Aqp2+) in the medulla as well as in TALs (NKCC2+), whereas DCTs (NCC+) show no GFP+ cells (white arrows). 23-months-old TCF/Lef:H2B-GFP mouse kidney. Scale bars, 50 μm.
Fig. 3
Fig. 3. Progressive deterioration of kidney function in Six2Cre+Tfap2bfl/WT mice but not in Six2Cre+Tfap2afl/fl mice.
a Mendelian ratios in 4-weeks-old offspring from indicated crosses. Absolute numbers and percentiles are shown. Parentheses show expected Mendelian ratios. Deficiency of AP-2α function in the distal nephron proximal to the CDs in Six2Cre+Tfap2afl/fl mice does not affect the viability of the mice. In contrast, deficiency of AP-2β function leads to early postnatal lethality, and only a few mice survive to ~4–8 weeks of age (1.8% instead of the expected 25%). Heterozygosity for normal Tfap2b in Six2Cre+Tfap2bfl/WT mice does not affect viability, even in the absence of normal Tfap2a in Six2Cre+Tfap2afl/flTfap2bfl/WT mice. Groups with the Cre allele are indicated as “+”, groups without the Cre allele as “−”. Heterozygosity or homozygosity for floxed alleles is indicated as “−/+” or “−/−” respectively (WT alleles “+/+”). b Measurements of BUN in Six2Cre+Tfap2afl/fl mice, Six2Cre+Tfap2bfl/WT mice, Six2Cre+Tfap2afl/flTfap2bfl/WT mice, and Cre-negative WT littermates in different age groups up to 13-16 months of age. BUN is normal in Six2Cre+Tfap2afl/fl mice even with advanced age. In contrast, Six2Cre+Tfap2bfl/WT mice and Six2Cre+Tfap2afl/flTfap2bfl/WT mice show a progressive deterioration of renal function with a steady increase in BUN with age progression. This increase is due to heterozygosity of AP-2β function, as the additional inactivation of AP-2α in these mice does not further exacerbate renal function. P values were determined by a Kruskal-Wallis test followed by Dunn’s multiple comparisons test. BUN in mg/dl. All graphs represent data as mean ± SEM. Each dot represents a different mouse. Number of mice per group is indicated in brackets. Source data are provided as a Source Data File. c The progressive age-dependent deterioration of renal function in Six2Cre+Tfap2bfl/WT mice is accompanied by an increase in 24-h urine production (polyuria) and water intake (polydipsia), whereas Six2Cre+Tfap2afl/fl mice have no polyuria or polydipsia. Adjusted p values are shown (one-way ANOVA with Dunnett’s multiple comparisons test; comparisons to age-matched WT control groups). All graphs represent data as mean ± SEM. Each dot represents a different mouse. Number of mice per group is indicated in brackets. Source data are provided as a Source Data File. d An age-dependent progressive growth retardation is observed in both male and female Six2Cre+Tfap2bfl/WT mice (yellow dotted line) but not in Six2Cre+Tfap2afl/fl mice when compared to WT littermates (black dotted line). Body weight (BW) shown in gm. Adjusted p values are shown (one-way ANOVA with Dunnett’s multiple comparisons test; comparisons to age-matched WT control groups). All graphs represent data as mean ± SEM. Each dot represents a different mouse. Number of mice per group is indicated in brackets. Source data are provided as a Source Data File. e, f Semiquantitative RT-PCR with whole kidney lysates of 2-months-old Six2Cre+Tfap2afl/fl mice (n = 7), Six2Cre+Tfap2bfl/WT mice (n = 5), and WT littermates (n = 8 mice). Six2Cre+Tfap2afl/fl mice show normal renal expression of the terminal differentiation marker of TALs/DCTs EGF (e) and of the DCT marker Slc12a3 (NCC) (f). In contrast, heterozygosity for AP-2β function in kidneys of Six2Cre+Tfap2bfl/WT mice leads to significantly reduced renal transcripts of Egf and Slc12a3. P values were determined by a two-tailed t test. Graphs represent data as mean ± SEM. Each dot represents the average value from triplicate experiments performed for each sample. Source data are provided as a Source Data File.
Fig. 4
Fig. 4. Deficiency of AP-2β in Six2+ NPCs results in severe cystic renal degeneration, kidney fibrosis, and renal failure.
a, b Whereas most Six2Cre+Tfap2bfl/fl mice died perinatally due to lack of DCTs, a few mice survived to 1–2 months of age, when they succumbed to renal failure with a very high BUN (b). These mice showed cystic degeneration of their renal cortex and tubulointerstitial fibrosis. Renal cysts were lined by either flattened epithelium (green arrow) or epithelial cells with a hobnail-like morphology (black arrow). H&E sections. Top: 1 month-old WT; middle and bottom panels: 1 month-old Six2Cre+Tfap2bfl/fl mouse. Scale bars: 1,4: 1 mm; 2,3,5,6: 250 μm; 7-9: 50 μm. P value determined by a two-tailed Mann–Whitney test (b). BUN in mg/dl. Graph represents data as mean ± SEM. Source data are provided as a Source Data File. b N = 9 WT, n = 3 Six2Cre+Tfap2bfl/fl mice. c H&E images show renal pathologies in 1–2 months-old Six2Cre+Tfap2bfl/fl mice (1–7) compared to an age-matched littermate WT mouse (8). 1: Bluish calcified intratubular deposits are observed (red arrows). 2: Hobnail-like epithelial cells (green arrow) lining renal cysts with extrusion of cells into the lumen (red arrow). Some cells show clear cell-like appearance of their cytoplasm (black arrows). 3: Subset of dilated cortical distal nephron tubules show cuboidal epithelium (yellow arrow) with apical blebbing (green arrows). Protein casts are seen in some dilated tubules (black arrow). 4: In some dilated tubules, a multilayered epithelium (black arrows) and formation of micropapillae (green arrows) were observed. Inflammatory cells and extruded epithelial cells are seen in the lumen. Some tubules are filled with protein casts (yellow arrow). 5: In addition, atrophic tubules with diminished tubular lumen were observed (green arrows). Glomeruli appeared normal (white arrow). 6: A subset of epithelial cells of dilated distal tubules had a clear-cell-like appearance with cytoplasmic vacuoles (green arrows). 7: Some distal tubule cysts are lined by flattened epithelium (green arrow), whereas proximal tubules do not show epithelial flattening (white arrow). 8: WT littermates showed none of these pathologies. Scale bars, 100 μm. d Western blotting with whole kidney lysates of 1- and 2-months-old Six2Cre+Tfap2bfl/fl mice, Six2Cre+Tfap2bfl/WT mice (3, 5–6, and 14-months old), and WT littermate controls. Lack of AP-2β function results in absence of differentiated DCTs (the DCT marker NCC is not detected), whereas heterozygosity of AP-2β function leads to loss of NCC with age progression. This loss of NCC is accompanied by an increase in GSK-3β phosphorylation, in active non-phospho Ser33/37/Thr41 β-catenin, and in an increase in mTOR signaling (increased Thr37/46 phosphorylation of 4E-BP1 and total 4E-BP1; increased phosphorylation of p70 S6 kinase; increased TFEB phosphorylation [low and high exposure shown to demonstrate upper phospho-TFEB bands (red stars); lower TFEB bands marked with green stars]). Kidneys of Six2Cre+Tfap2bfl/fl mice have diminished NKCC2, whereas aged Six2Cre+Tfap2bfl/WT mice have increased NKCC2. Both have decreased protein levels of the PT protein Slc3a1. β-actin as a loading control. Densitometric values for Western blot bands normalized to β-actin are shown. Size markers are indicated by arrowheads.
Fig. 5
Fig. 5. Effects of homozygous versus heterozygous loss of AP-2β activity in Six2+ NPCs.
Immunolabeling of kidneys from a 2-months-old Six2Cre+Tfap2bfl/fl mouse, a 7.5-months-old Six2Cre+Tfap2bfl/WT mouse and a 7.5-months-old Cre-negative control mouse. Representative images are shown. a 1: Six2Cre+Tfap2bfl/fl kidneys show an absence of DCTs (no Pvalb+ segments, which are seen in WT mice [yellow arrow]), whereas dilated Pvalb+ DCTs (blue arrows) are seen in kidneys of Six2Cre+Tfap2bfl/WT mice. 2: NKCC2+ TALs (yellow arrows) are moderately dilated in kidneys of both Six2Cre+Tfap2bfl/fl and Six2Cre+Tfap2bfl/WT mice. Severe tubulointerstitial fibrosis with SMA+ myofibroblasts and a macrophage-rich (F4/80+) inflammatory infiltrate (blue arrows) is observed in kidneys of Six2Cre+Tfap2bfl/fl mice and to a lesser extent in kidneys of Six2Cre+Tfap2bfl/WT mice. 3: In Six2Cre+Tfap2bfl/fl mice and Six2Cre+Tfap2bfl/WT mice dilated CTs/cortical CDs (Aqp2+) are seen (yellow arrows), whereas NKCC2+ TALs show less or no dilatation (blue arrows). In addition, dilated tubules and cysts are observed that show no immunolabeling for Aqp2 or NKCC2 and do not show a brush border membrane that is typical of PTs (white arrows). 4: PTs (yellow arrows) show thinned and irregular brush border membranes (LTL+, strong signal with phalloidin labeling) in Six2Cre+Tfap2bfl/fl mice and Six2Cre+Tfap2bfl/WT mice. Scale bars, 100 μm. b Immunolabeling of a kidney from a 2-months-old Six2Cre+Tfap2bfl/fl mouse (as in a) shows that renal fibrosis is accompanied by an abundance of PDGFRβ+ myofibroblasts (yellow arrows). Dilated cortical CDs/CTs (Aqp2+) are observed as well (red arrow). Dilated tubules show extrusion of apoptotic cells into the lumen (cleaved caspase-3+; blue arrow) and some cells with strong staining for phosphorylated 4E-BP1 (Thr37/46) (white arrows). Scale bars, 100 μm. c Immunolabeling for TFEB shows increased cytoplasmic staining in dilated distal nephron tubules in kidneys of Six2Cre+Tfap2bfl/fl mice and Six2Cre+Tfap2bfl/WT mice (yellow arrows), compared to the low staining intensity in distal nephron segments of WT mice (blue arrows). Scale bars, 100 μm.
Fig. 6
Fig. 6. Inactivation of AP-2β in DCT1s impairs their terminal differentiation and function in the adult.
a Lack of AP-2β function in DCT1s (PvalbCre+Tfap2bfl/fl mice) leads to loss of EGF protein in DCT1s (Pvalb+; yellow arrows), whereas EGF immunoreactivity remains in TALs (NKCC2+; white arrows) that are not targeted by PvalbCre. 16-months-old mice. Scale bars, 50 μm. b Reduced Pvalb protein levels in whole kidney lysates of 12-months-old PvalbCre+Tfap2bfl/fl mice compared to WT littermates. Values show densitometric values for Western blot bands normalized to β-actin. Size markers are indicated. P value was determined by a two-tailed t test. Graph represents data as mean ± SEM. N = 4 WT mice; n = 5 PvalbCre+Tfap2bfl/fl mice. Source data are provided as a Source Data File. c Immunolabeling shows that PvalbCre+Tfap2bfl/fl mice have normal-appearing TALs (NKCC2) (white arrows). Co-immunolabeling for Pvalb (DCT1 marker) and Calb1 (stronger expressed in CTs than in DCTs) identifies in WT mice CTs (stronger Calb1 staining compared to Pvalb) (blue arrows) and DCT1s (stronger Pvalb staining compared to Calb1) (yellow arrows). In PvalbCre+Tfap2bfl/fl mice immunolabeling for Pvalb is reduced in DCT1s, leading to similar staining intensity for Calb1 and Pvalb in both nephron segments. 16-months-old mice. Scale bars, 100 μm. d Left: EGF immunolabeling is detected in a cytoplasmic localization in TALs (NKCC2+) and DCTs (Pvalb+) in WT mouse kidneys (green arrows). Middle: No or severely diminished EGF immunolabeling is detected in DCTs (Pvalb+ [red]; white arrow) of Six2Cre+Tfap2bfl/WT mice (heterozygous for functional AP-2β in the kidney), whereas their TALs show EGF immunolabeling (NKCC2+; yellow arrows). Right: Six2Cre+Tfap2bfl/fl mice (null for functional AP-2β in the kidney) lack DCTs, but their TALs show immunolabeling for EGF (yellow arrow). Scale bars, 100 μm. e Inactivation of Tfap2b in DCT1s (PvalbCre+Tfap2bfl/fl mice) does not lead to an increase in BUN and does not affect body weight. P values were determined by a two-tailed Mann–Whitney test. BUN in mg/dl. Graphs represent data as mean ± SEM. Each dot represents a different mouse. Number of mice per group is indicated in brackets. Source data are provided as a Source Data File. f PvalbCre+Tfap2bfl/fl mice show with progressive age (9-12 months) an increase in 24-hour urine production. P values were determined by a two-tailed Mann–Whitney test. Graphs represent data as mean ± SEM. Each dot represents a different mouse. Number of mice per group is indicated in brackets. Source data are provided as a Source Data File.
Fig. 7
Fig. 7. Progressive histomorphologic renal abnormalities in mice with heterozygous inactivation of AP-2β in NPC-derived nephron segments.
H&E sections (left: whole kidney; right: high magnification image of the same kidney) show that Six2Cre+Tfap2bfl/WT mice have a normal-appearing kidney at 3-months of age but develop severe distal nephron abnormalities with distal tubule dilatation (black arrows) and a tubulointerstitial inflammatory infiltrate (green arrow) at 7.5 and 14 months of age. In contrast, 20-monhts-old PvalbCre+Tfap2bfl/fl mice show less severe abnormalities and inflammatory infiltrates (red arrow). Scale bars, 1 mm left and 50 μm right.
Fig. 8
Fig. 8. Severe glomerulosclerosis in aged Six2Cre+Tfap2bfl/WT mice.
a Semiquantitative RT-PCR with whole kidney lysates of 2-months-old Six2Cre+Tfap2afl/flTfap2bfl/WT mice and WT littermates. Expression of DCT markers Pvalb and Slc12a3 is strongly reduced in kidneys of Six2Cre+Tfap2afl/flTfap2bfl/WT mice, as is the expression of genes that are expressed in both TALs and DCTs (Egf, Sfrp1). The TAL marker Slc12a1 is upregulated in these kidneys, whereas the expression of CT/CD markers (Aqp2, Scnn1a) is unchanged. N = 9 kidneys per group. P values are shown (two-tailed, unpaired t test). Source data are provided as a Source Data File. b An increase in urinary microalbumin is observed in aged Six2Cre+Tfap2bfl/WT mice. P values are shown (two-tailed t test). Graph represents data as mean ± SEM. Each dot represents a different mouse. Number of mice per group is indicated in brackets. Source data are provided as a Source Data File. c H&E, Trichrome, and PAS staining of kidneys form a 1-months-old WT mouse, a 1-months-old Six2Cre+Tfap2bfl/fl mouse, and a 14-months-old Six2Cre+Tfap2bfl/WT mouse. Whereas glomeruli show no glomerulosclerosis in the 1-months-old Six2Cre+Tfap2bfl/fl mouse kidney (red arrows), eosinophilic, PAS+, and Trichrome+ staining is observed in glomeruli with strong expansion of the glomerular matrix in the 14-months-old Six2Cre+Tfap2bfl/WT mouse kidney (yellow arrows), consistent with severe glomerulosclerosis. Scale bars, 50 μm.
Fig. 9
Fig. 9. Proposed model for the distinct non-redundant roles of AP-2α and AP-2β for nephrogenesis and postnatal renal function in the mammalian kidney.
AP-2β is critical for the formation of DCTs during nephrogenesis. Continued activity of the AP-2β/KCTD1 axis after nephrogenesis is necessary for maintaining terminal differentiation and function of DCTs, in part by repressing β-catenin/mTOR activity. Loss of even a single AP-2β allele leads to progressive DCT defects, β-catenin/mTOR hyperactivation, and renal fibrosis. In contrast, AP-2α is not required for distal nephron development but plays a role in maintaining the proper morphology of medullary CDs in the adult.

Similar articles

Cited by

References

    1. Lindstrom NO, et al. Progressive recruitment of mesenchymal progenitors reveals a time-dependent process of cell fate acquisition in mouse and human nephrogenesis. Dev. Cell. 2018;45:651–660 e654. doi: 10.1016/j.devcel.2018.05.010. - DOI - PMC - PubMed
    1. Lindstrom NO, et al. Conserved and divergent features of mesenchymal progenitor cell types within the cortical nephrogenic niche of the human and mouse kidney. J. Am. Soc. Nephrol. 2018;29:806–824. doi: 10.1681/ASN.2017080890. - DOI - PMC - PubMed
    1. McMahon AP. Development of the Mammalian kidney. Curr. Top. Dev. Biol. 2016;117:31–64. doi: 10.1016/bs.ctdb.2015.10.010. - DOI - PMC - PubMed
    1. Cheng HT, et al. Notch2, but not Notch1, is required for proximal fate acquisition in the mammalian nephron. Development. 2007;134:801–811. doi: 10.1242/dev.02773. - DOI - PMC - PubMed
    1. Grieshammer U, et al. FGF8 is required for cell survival at distinct stages of nephrogenesis and for regulation of gene expression in nascent nephrons. Development. 2005;132:3847–3857. doi: 10.1242/dev.01944. - DOI - PubMed

Publication types

LinkOut - more resources