. 2022 May;54(5):670-683.
doi: 10.1038/s41588-022-01045-8. Epub 2022 Apr 25.

HOXB13 suppresses de novo lipogenesis through HDAC3-mediated epigenetic reprogramming in prostate cancer

Affiliations

HOXB13 suppresses de novo lipogenesis through HDAC3-mediated epigenetic reprogramming in prostate cancer

Xiaodong Lu et al. Nat Genet. 2022 May.

Abstract

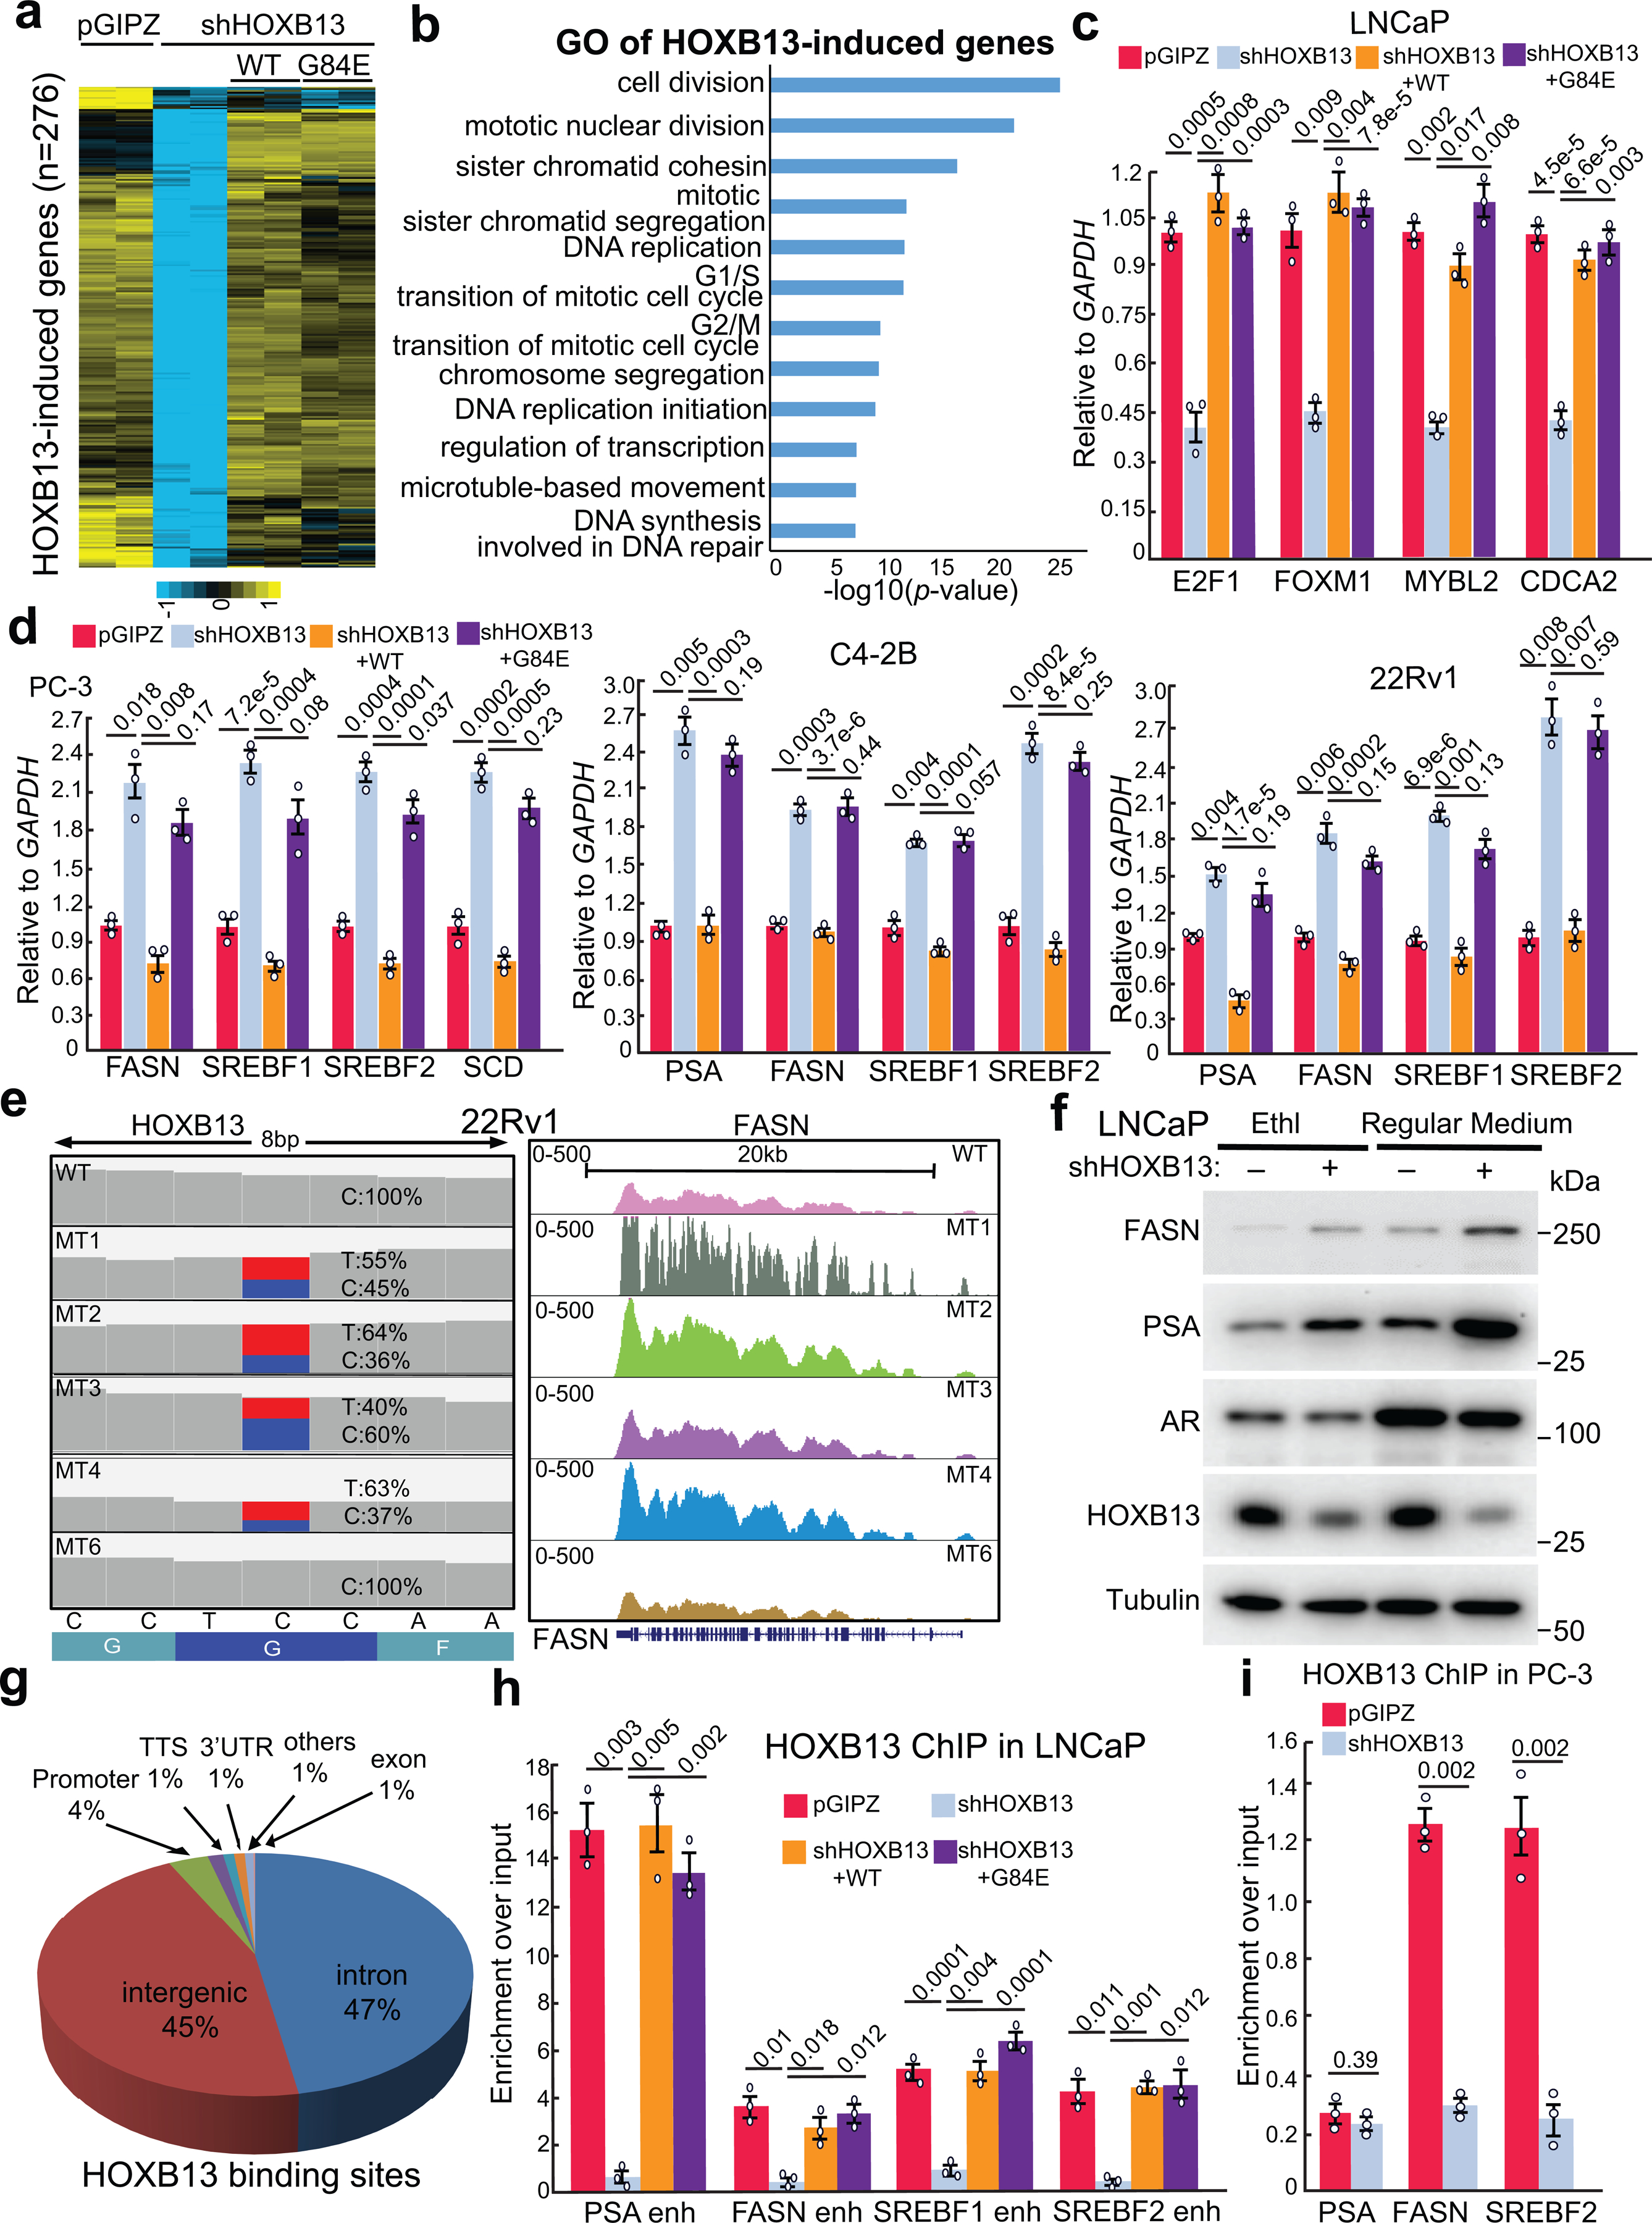
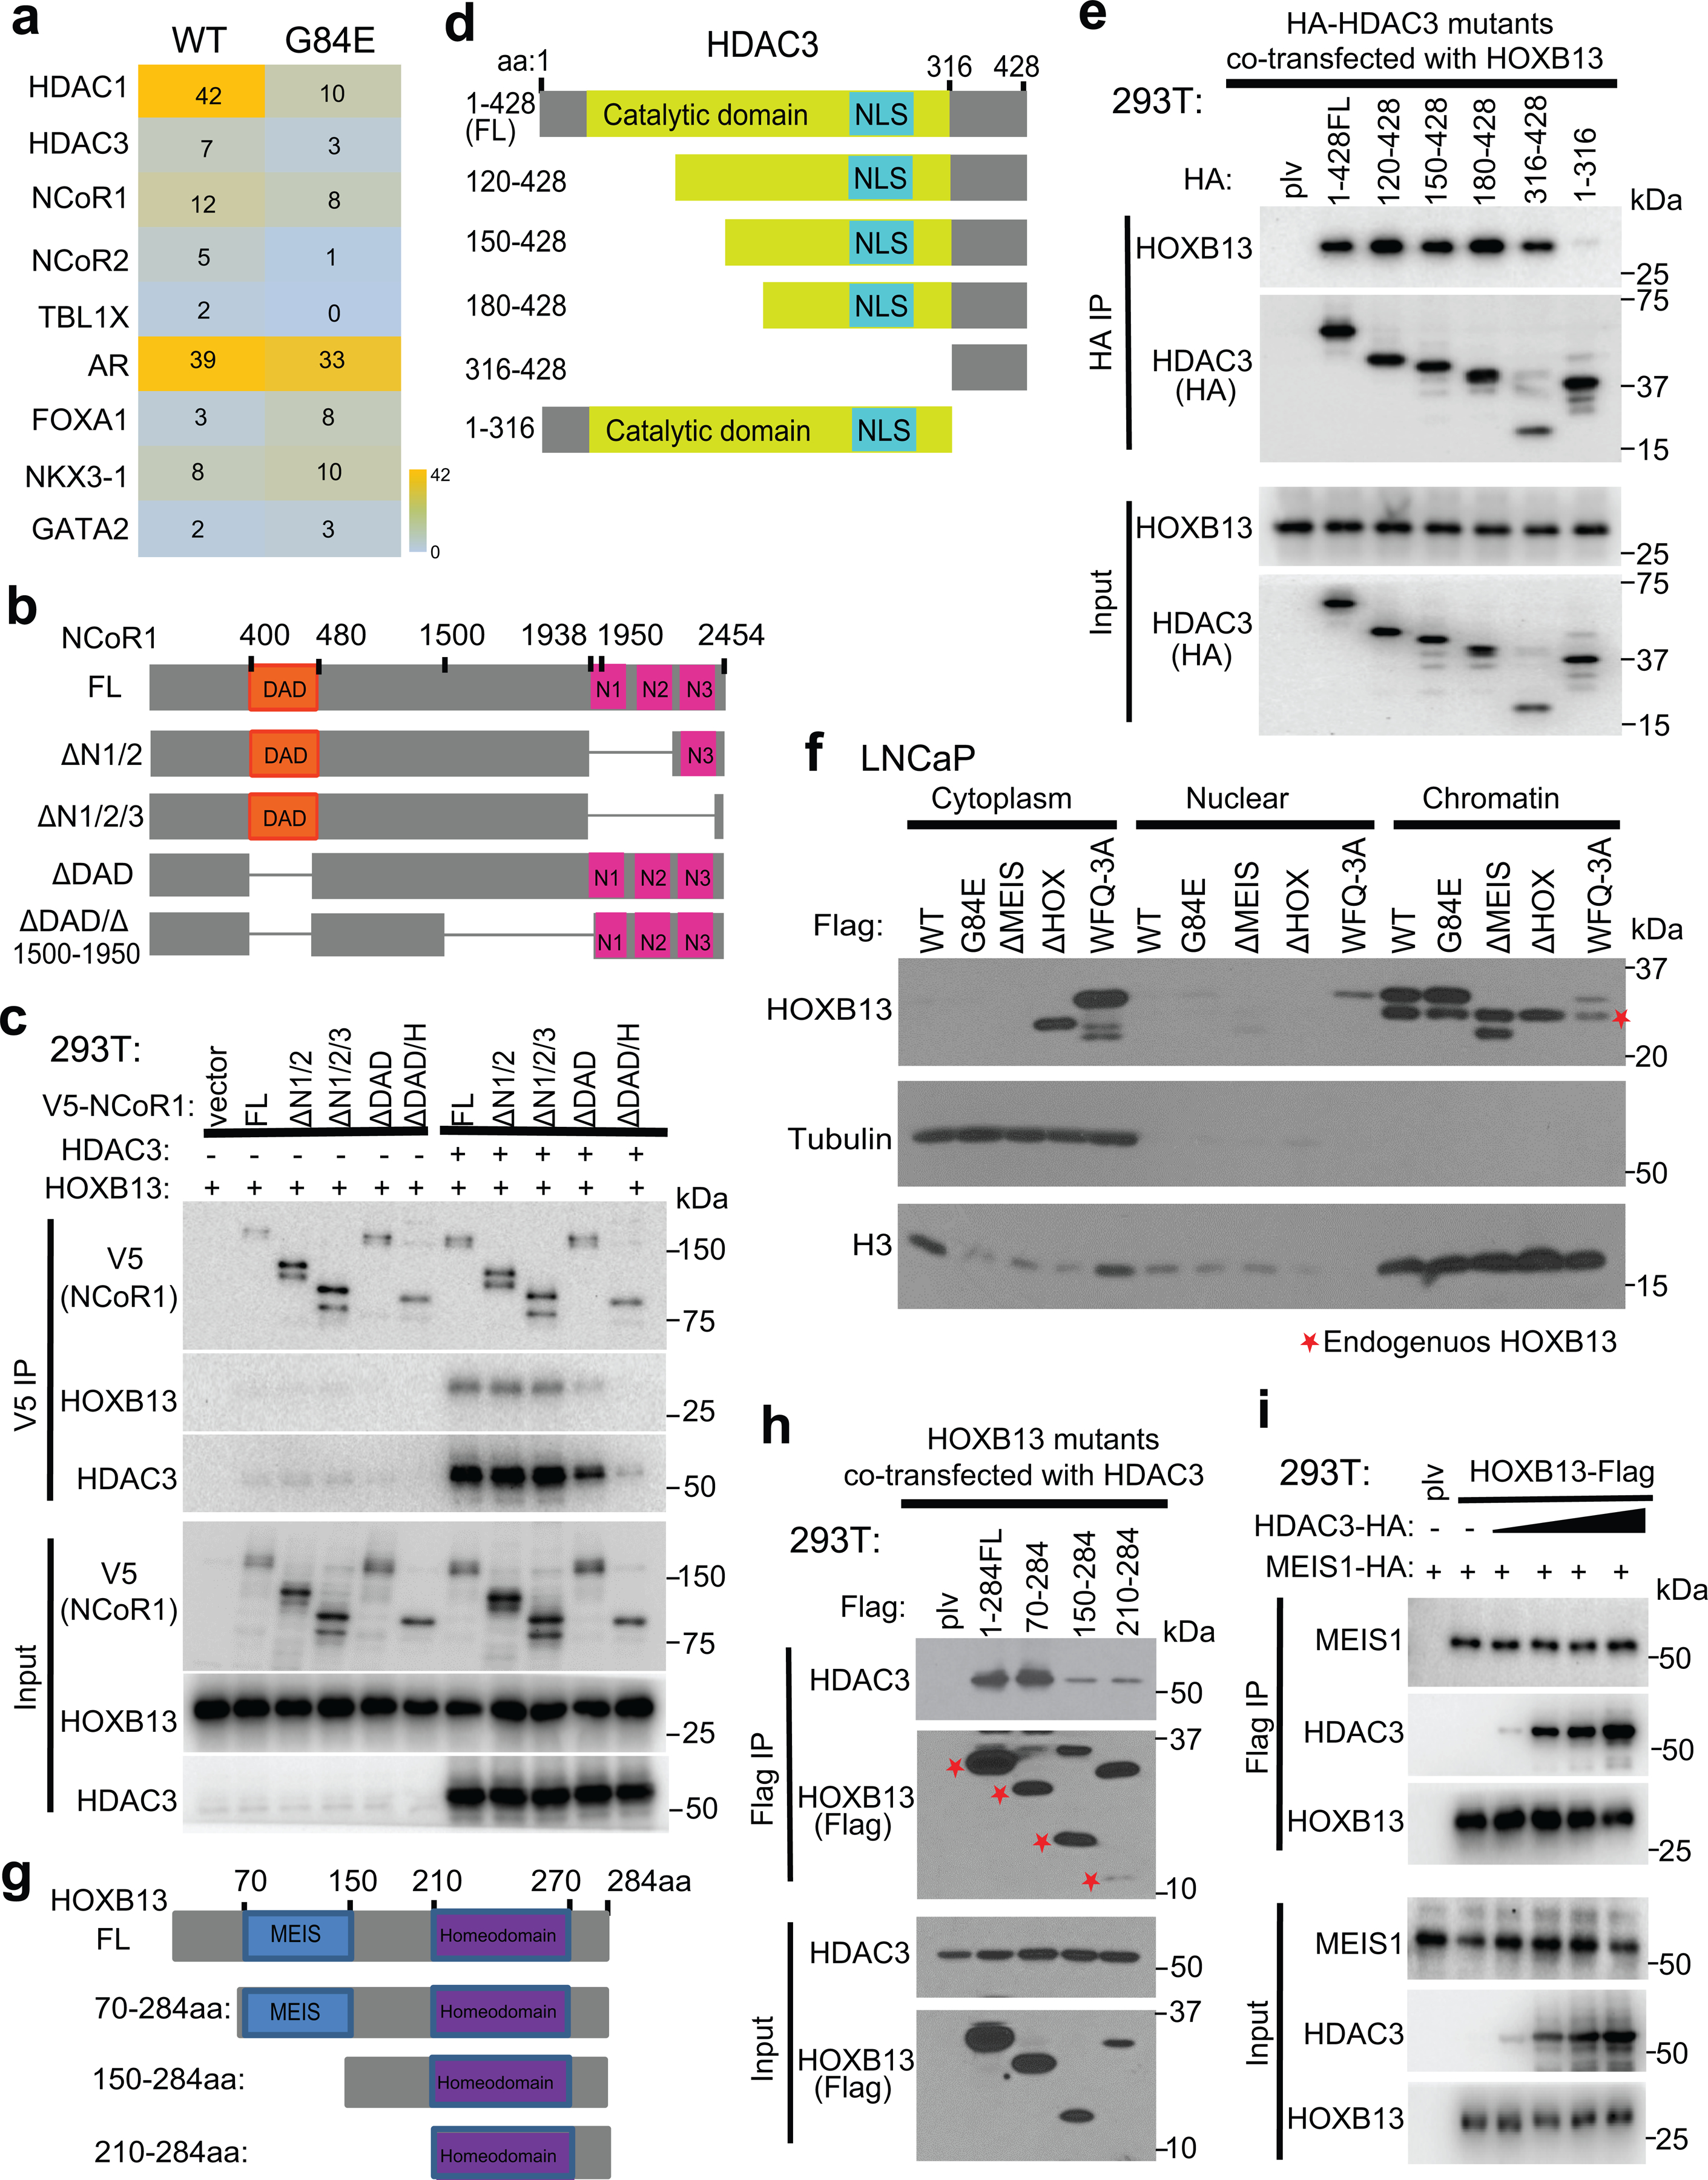
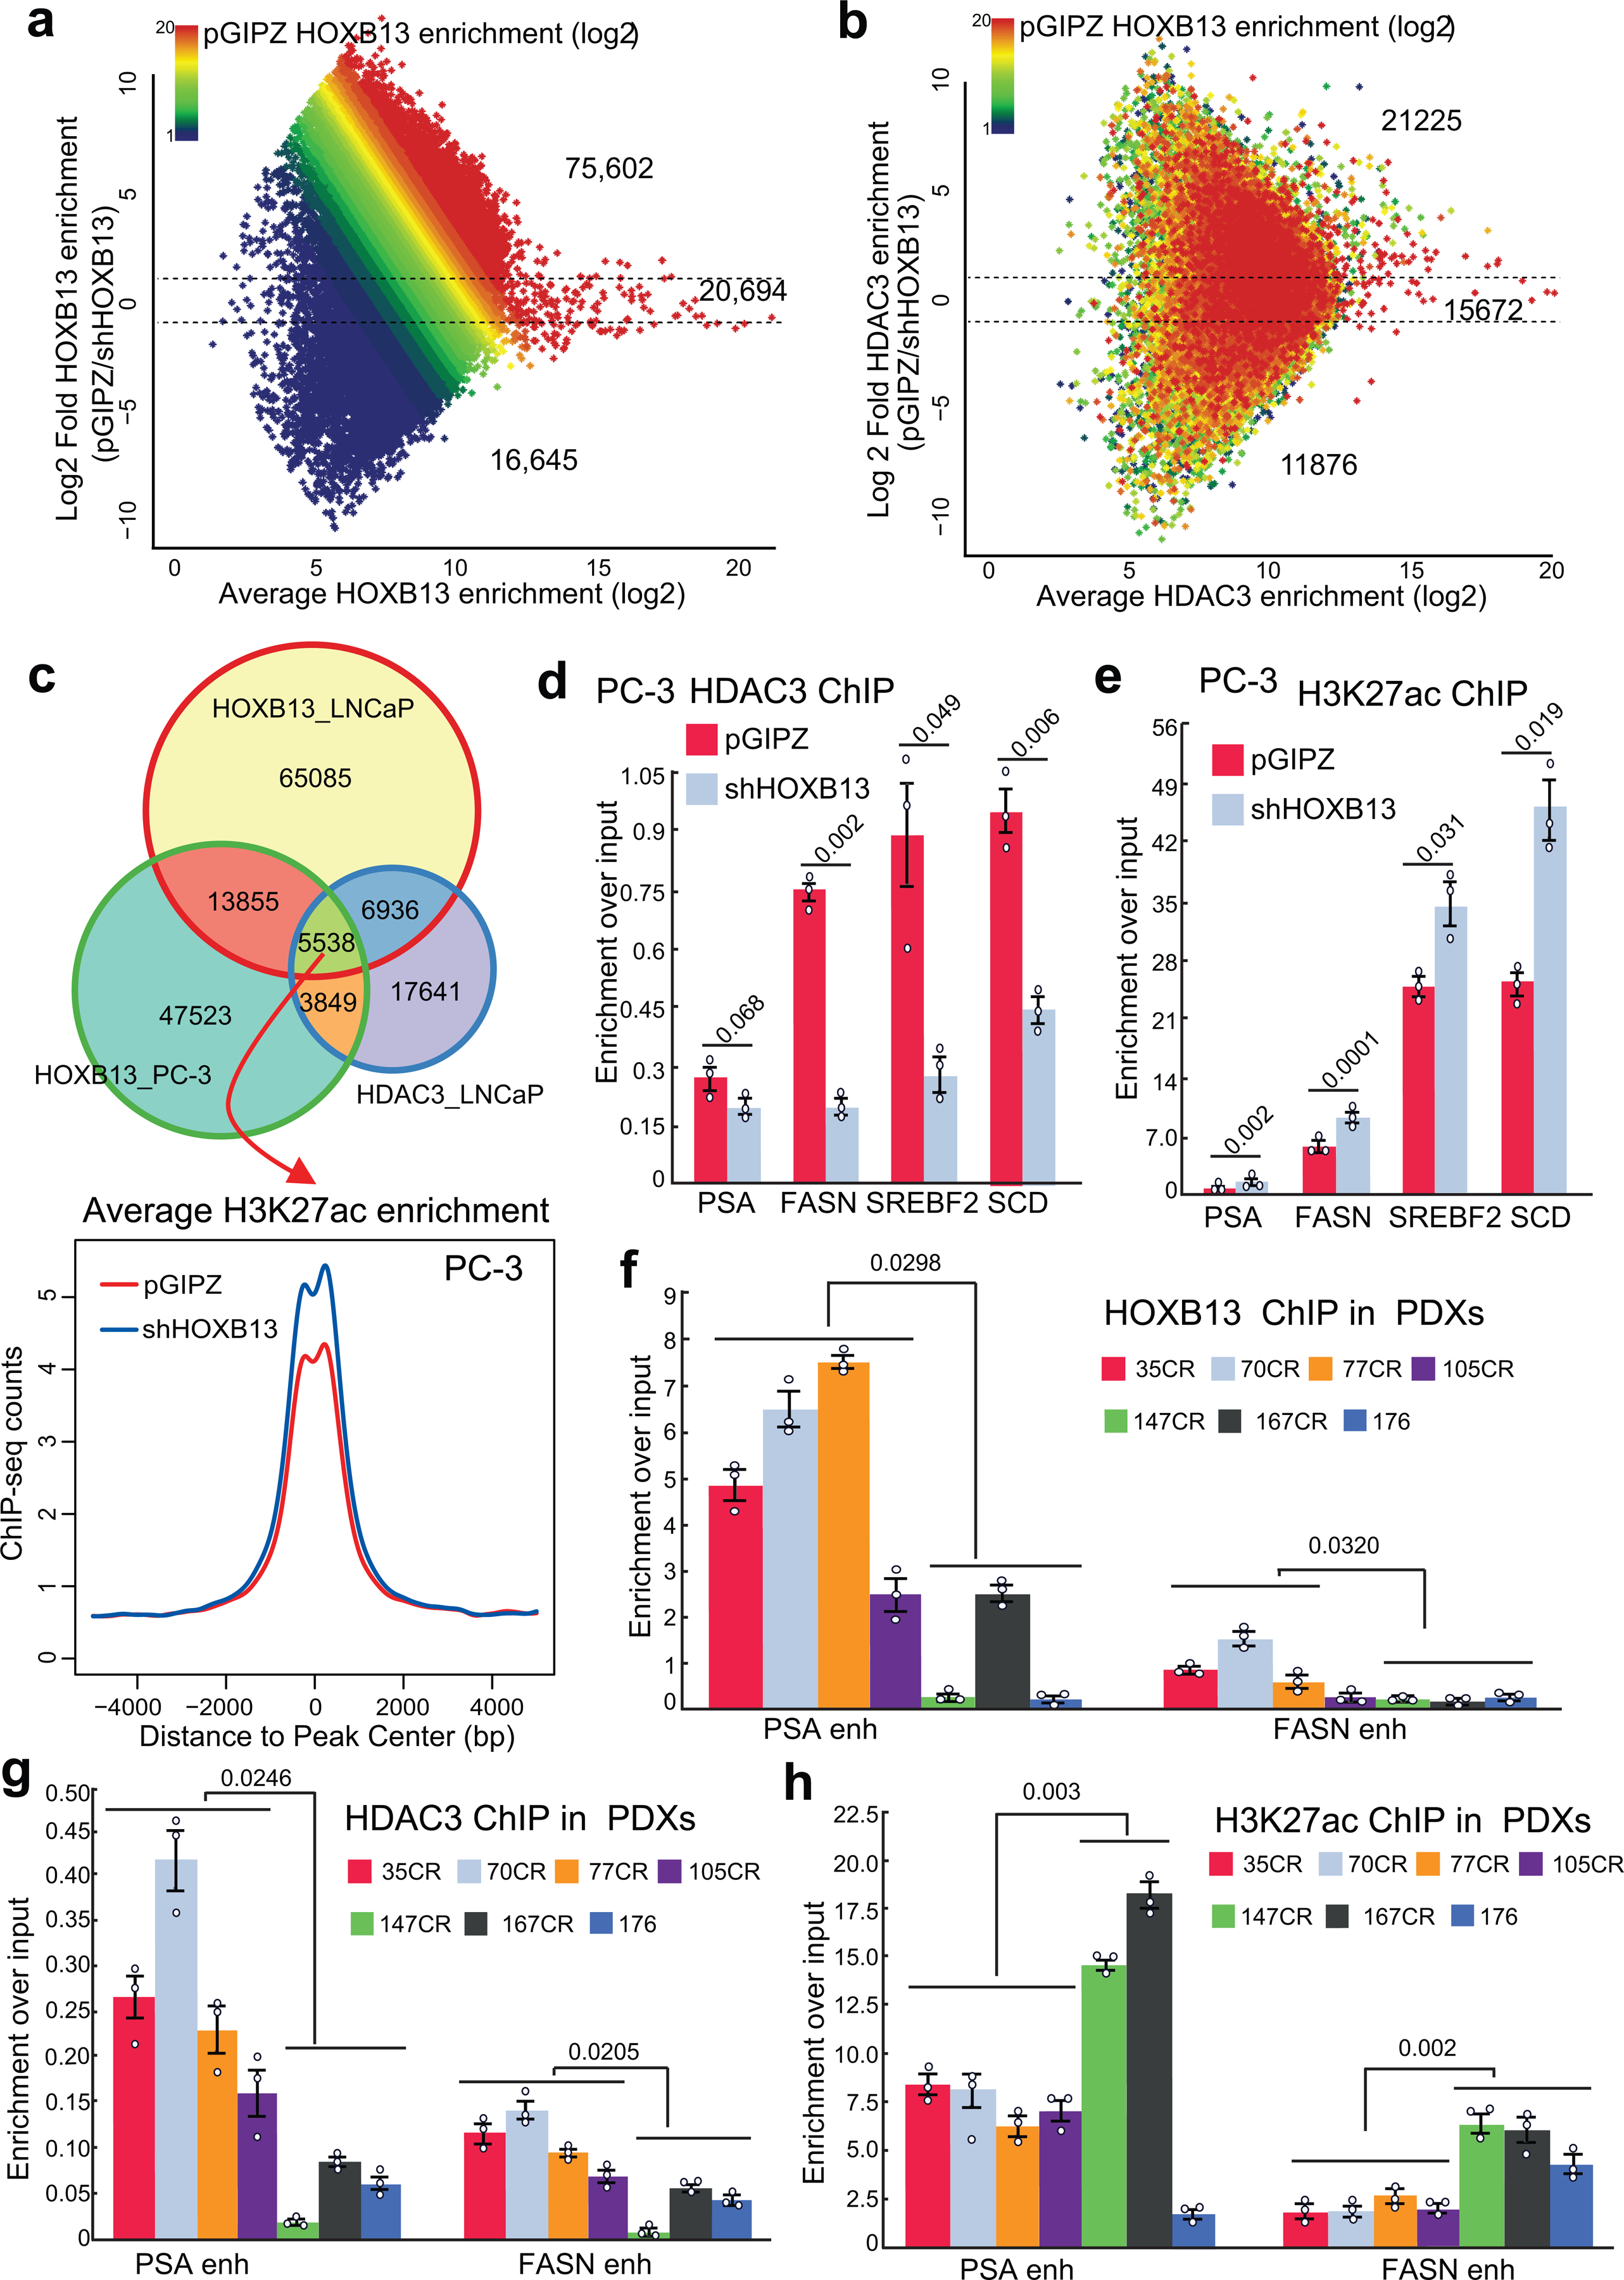
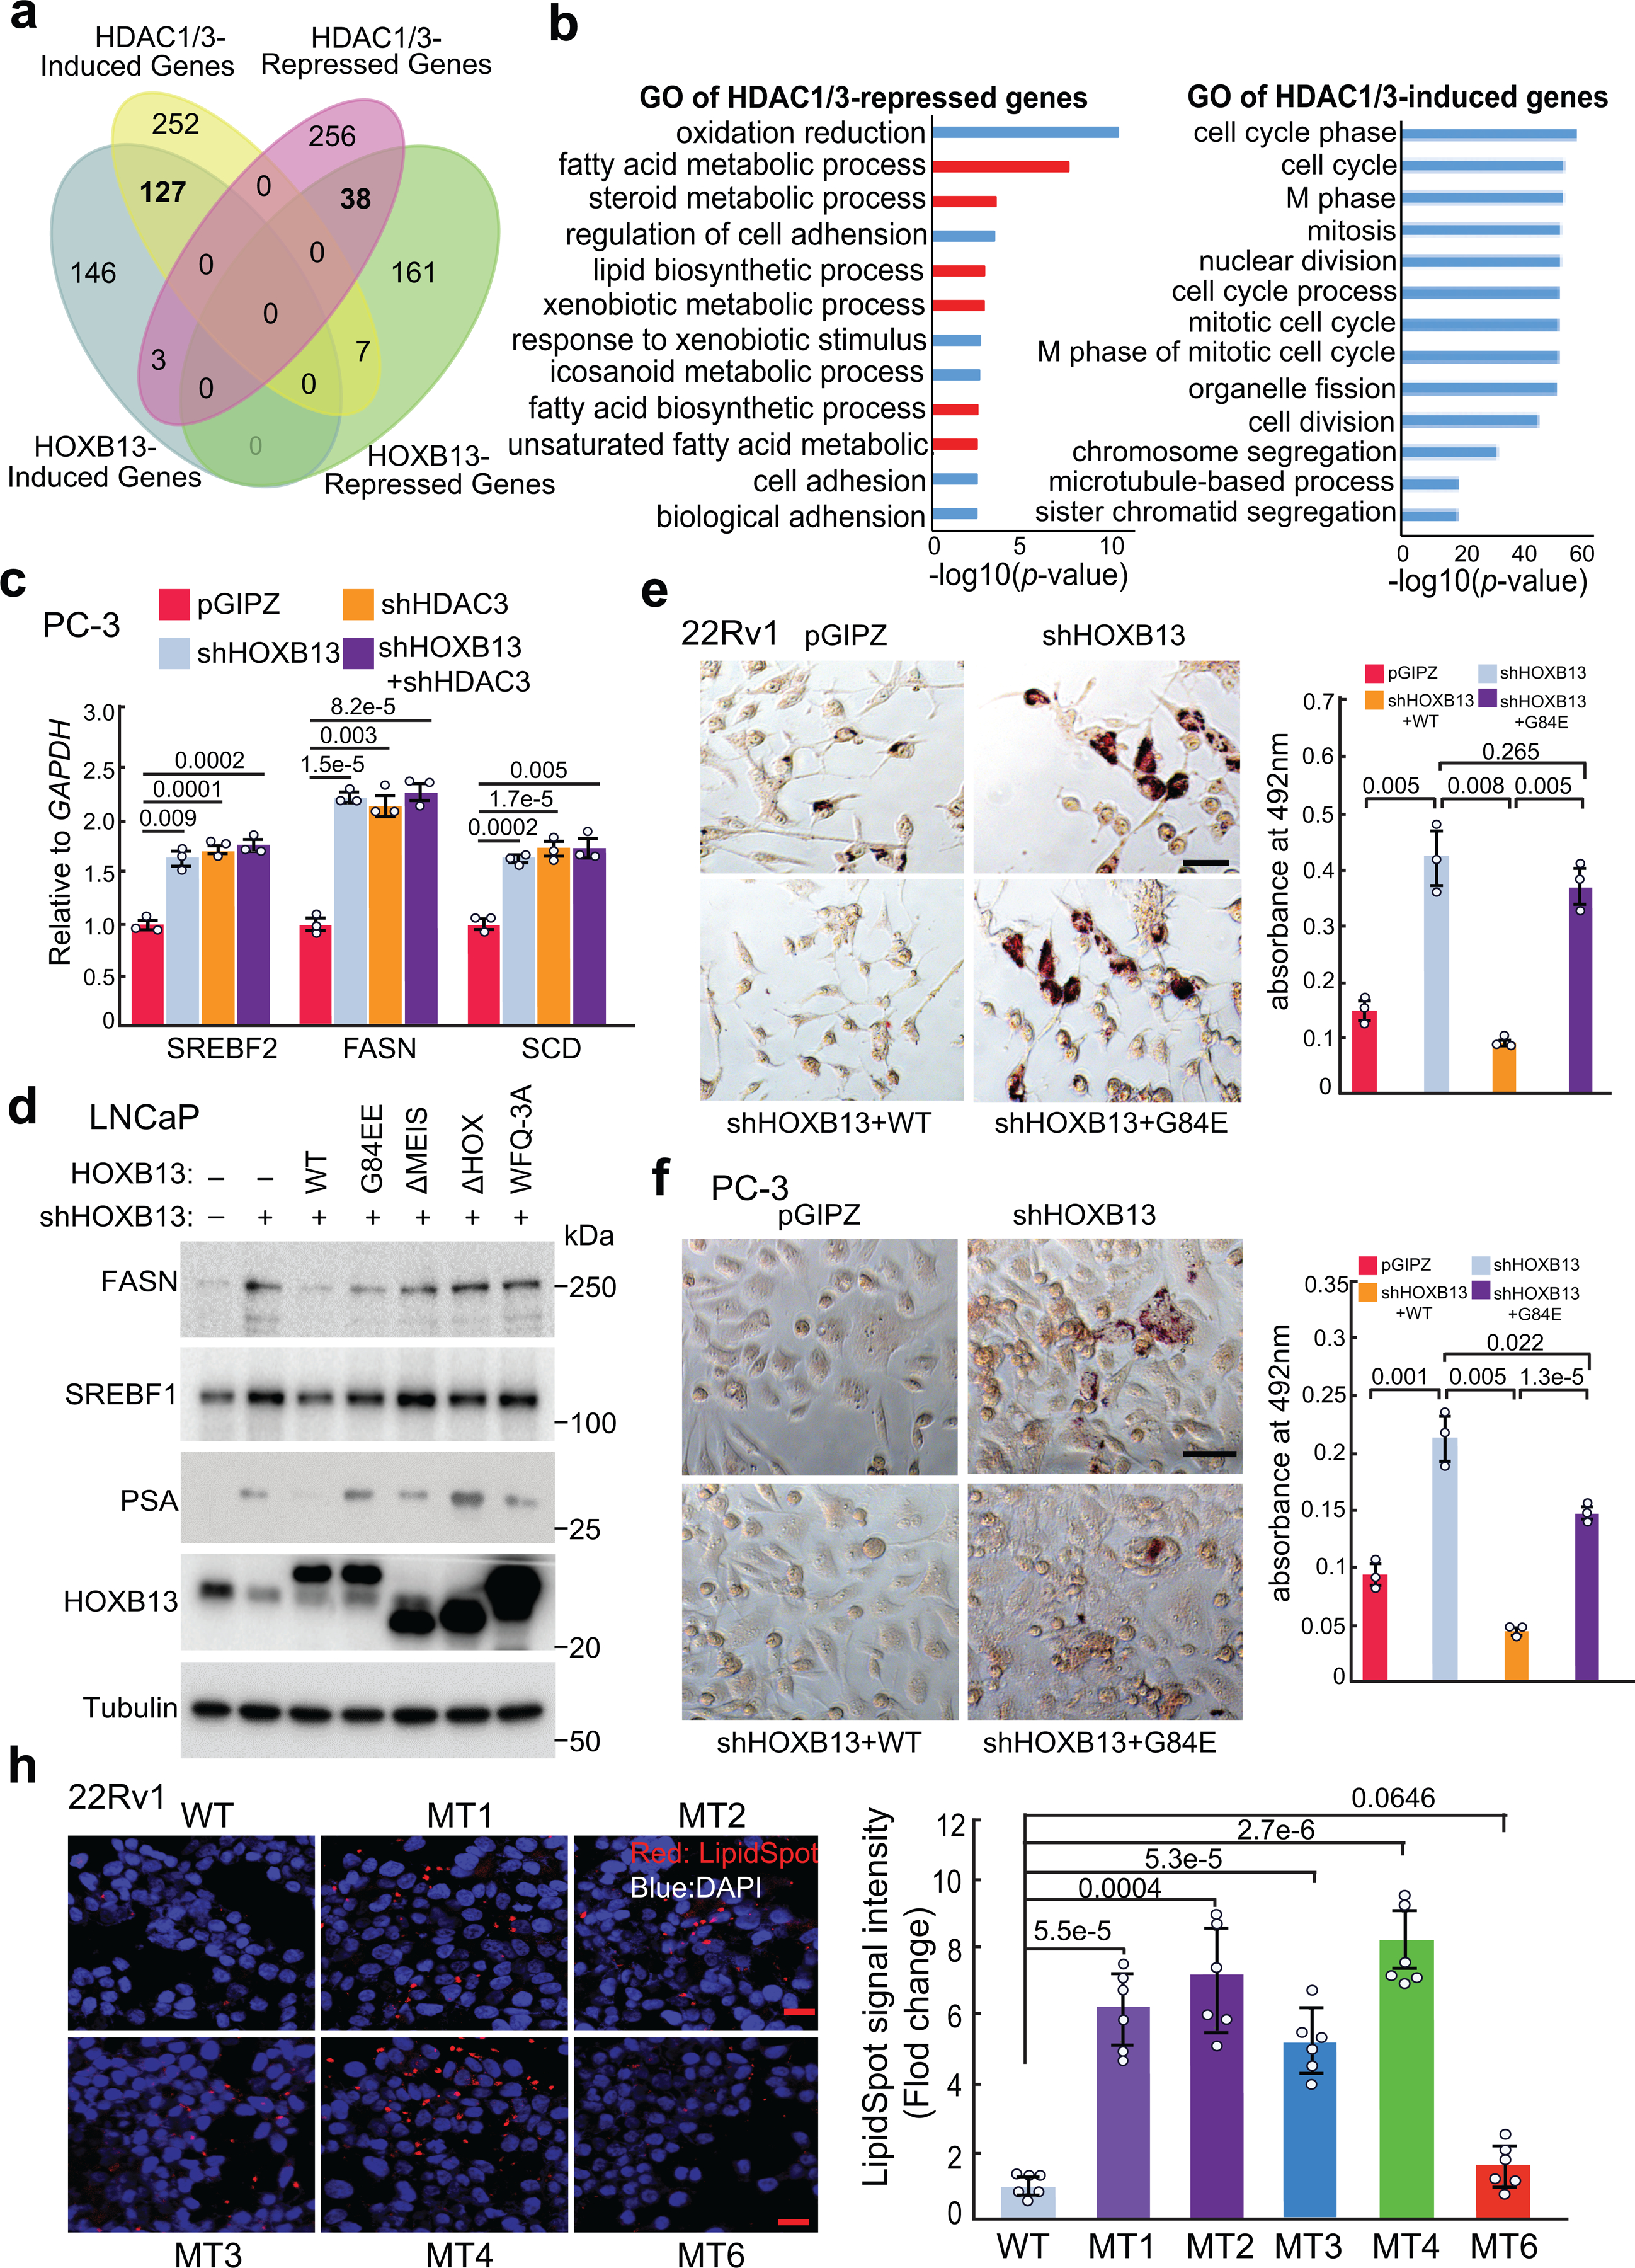
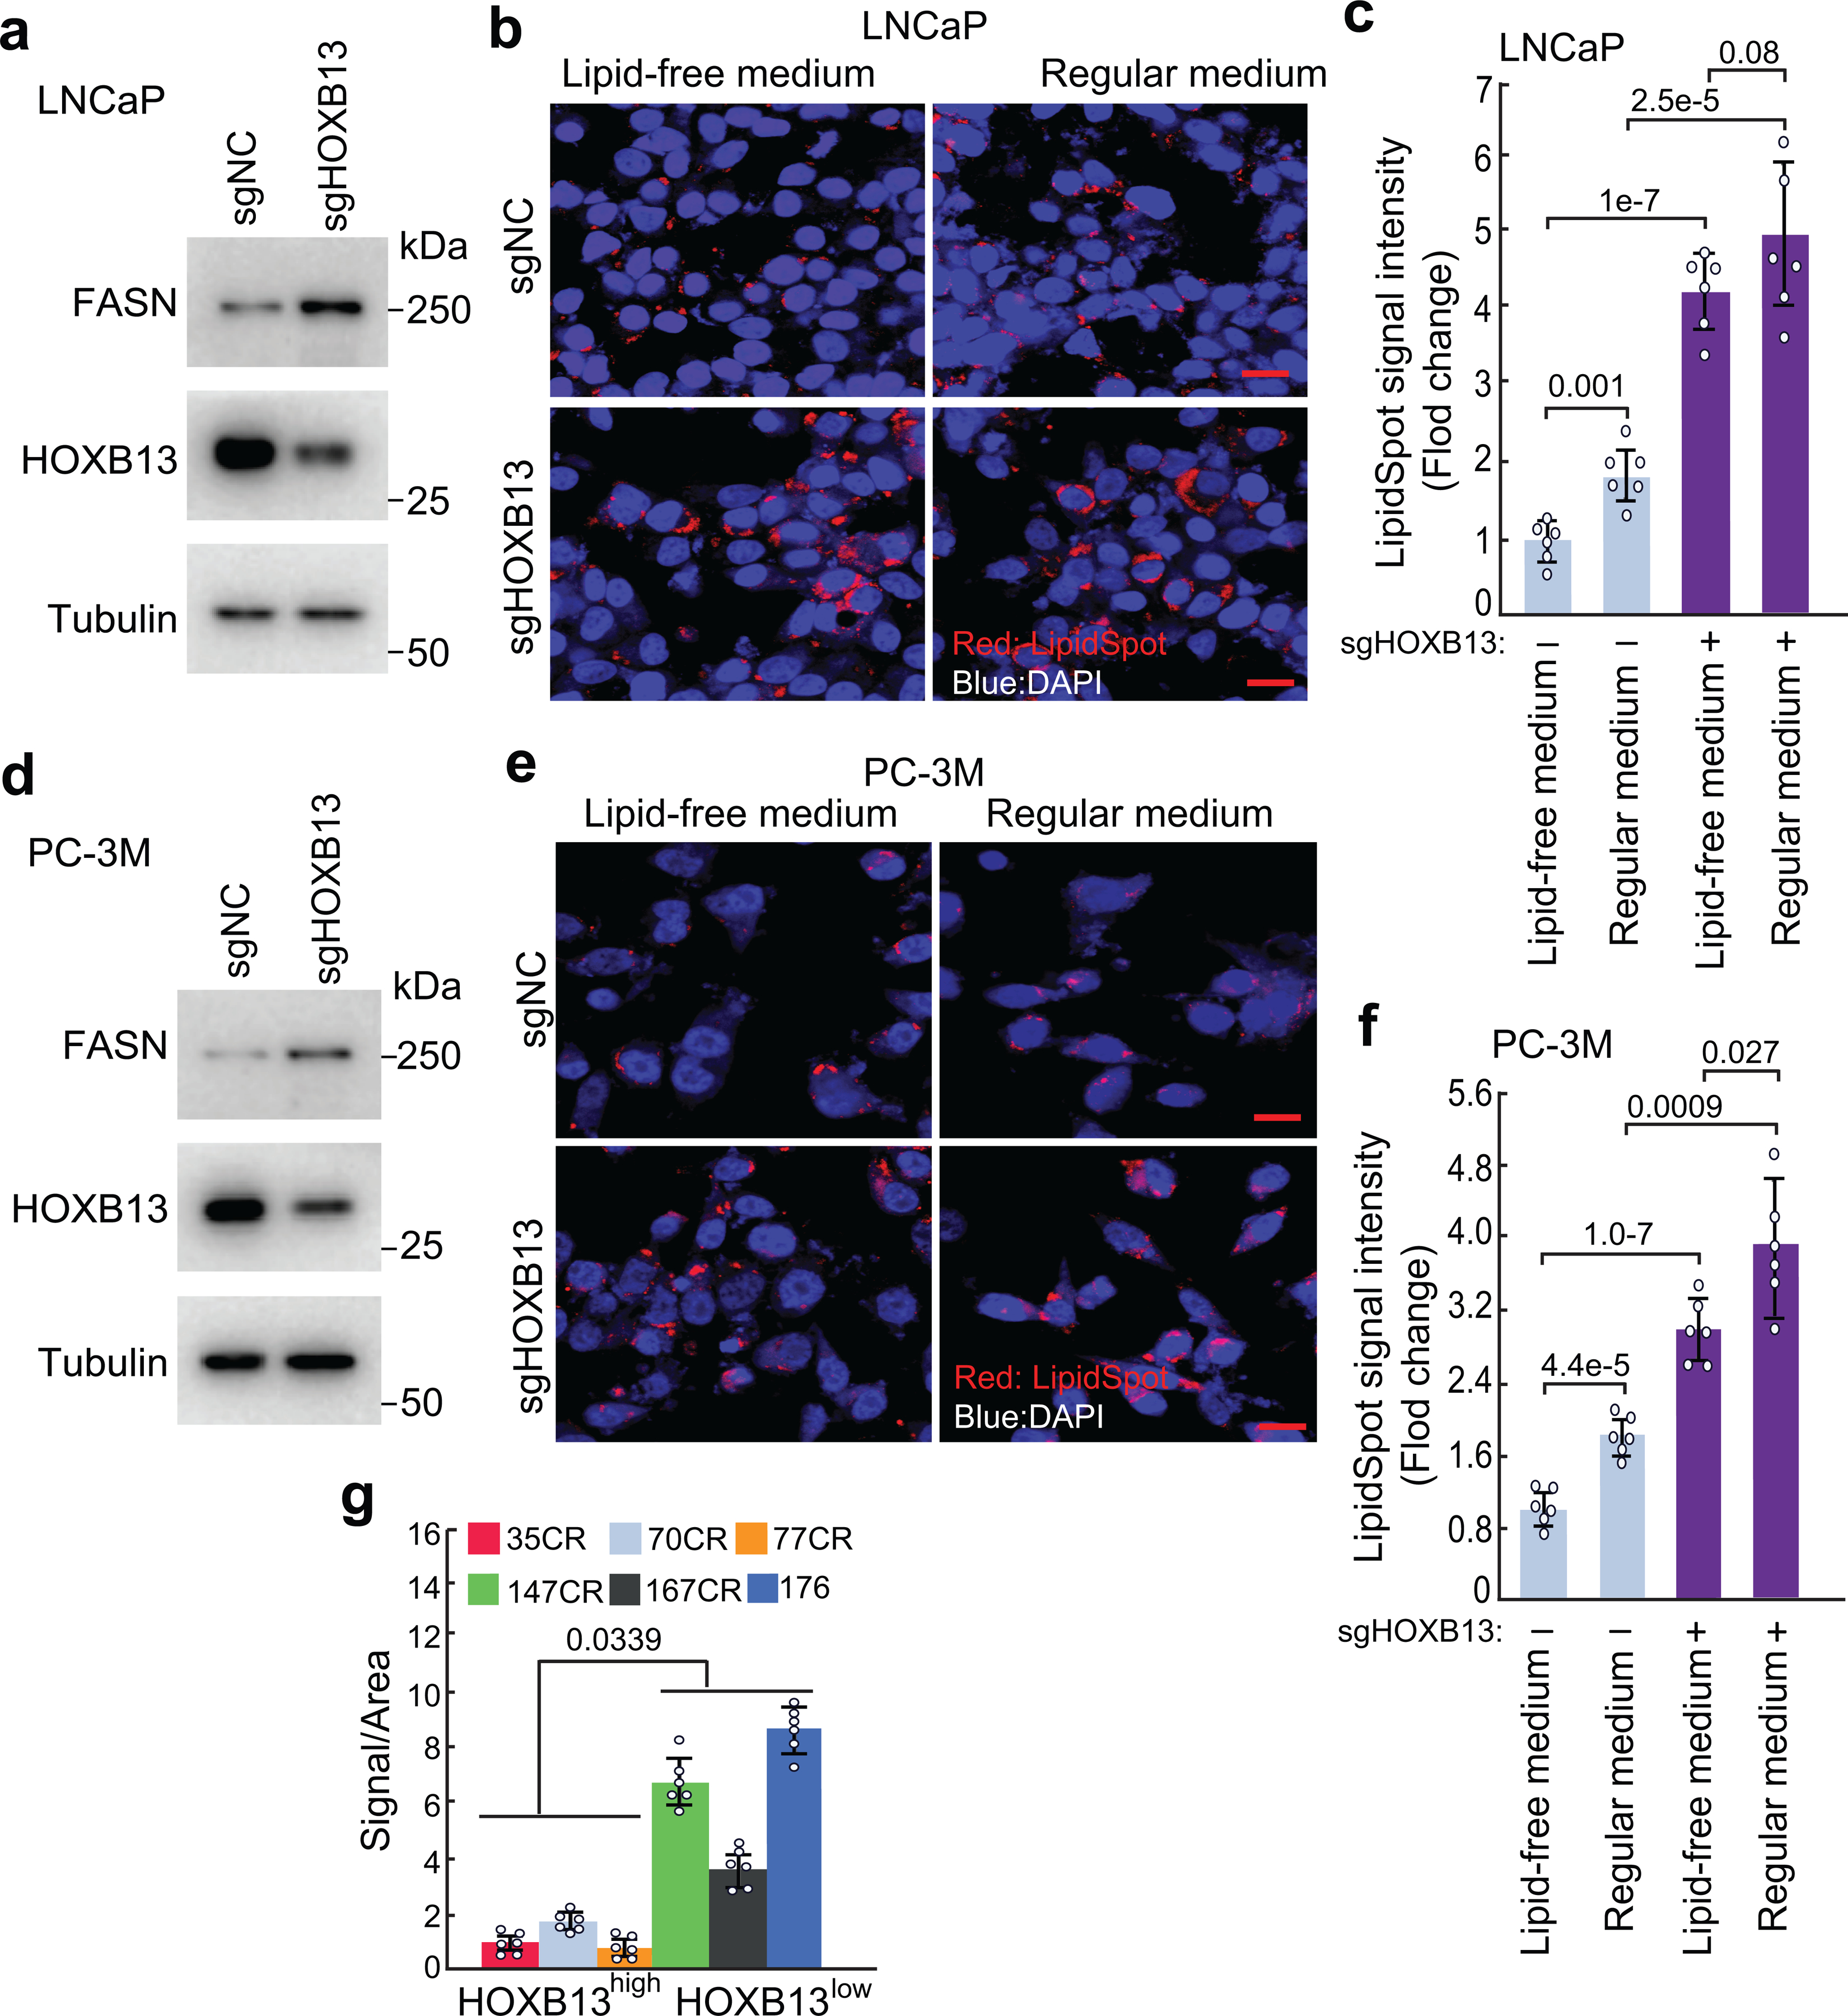
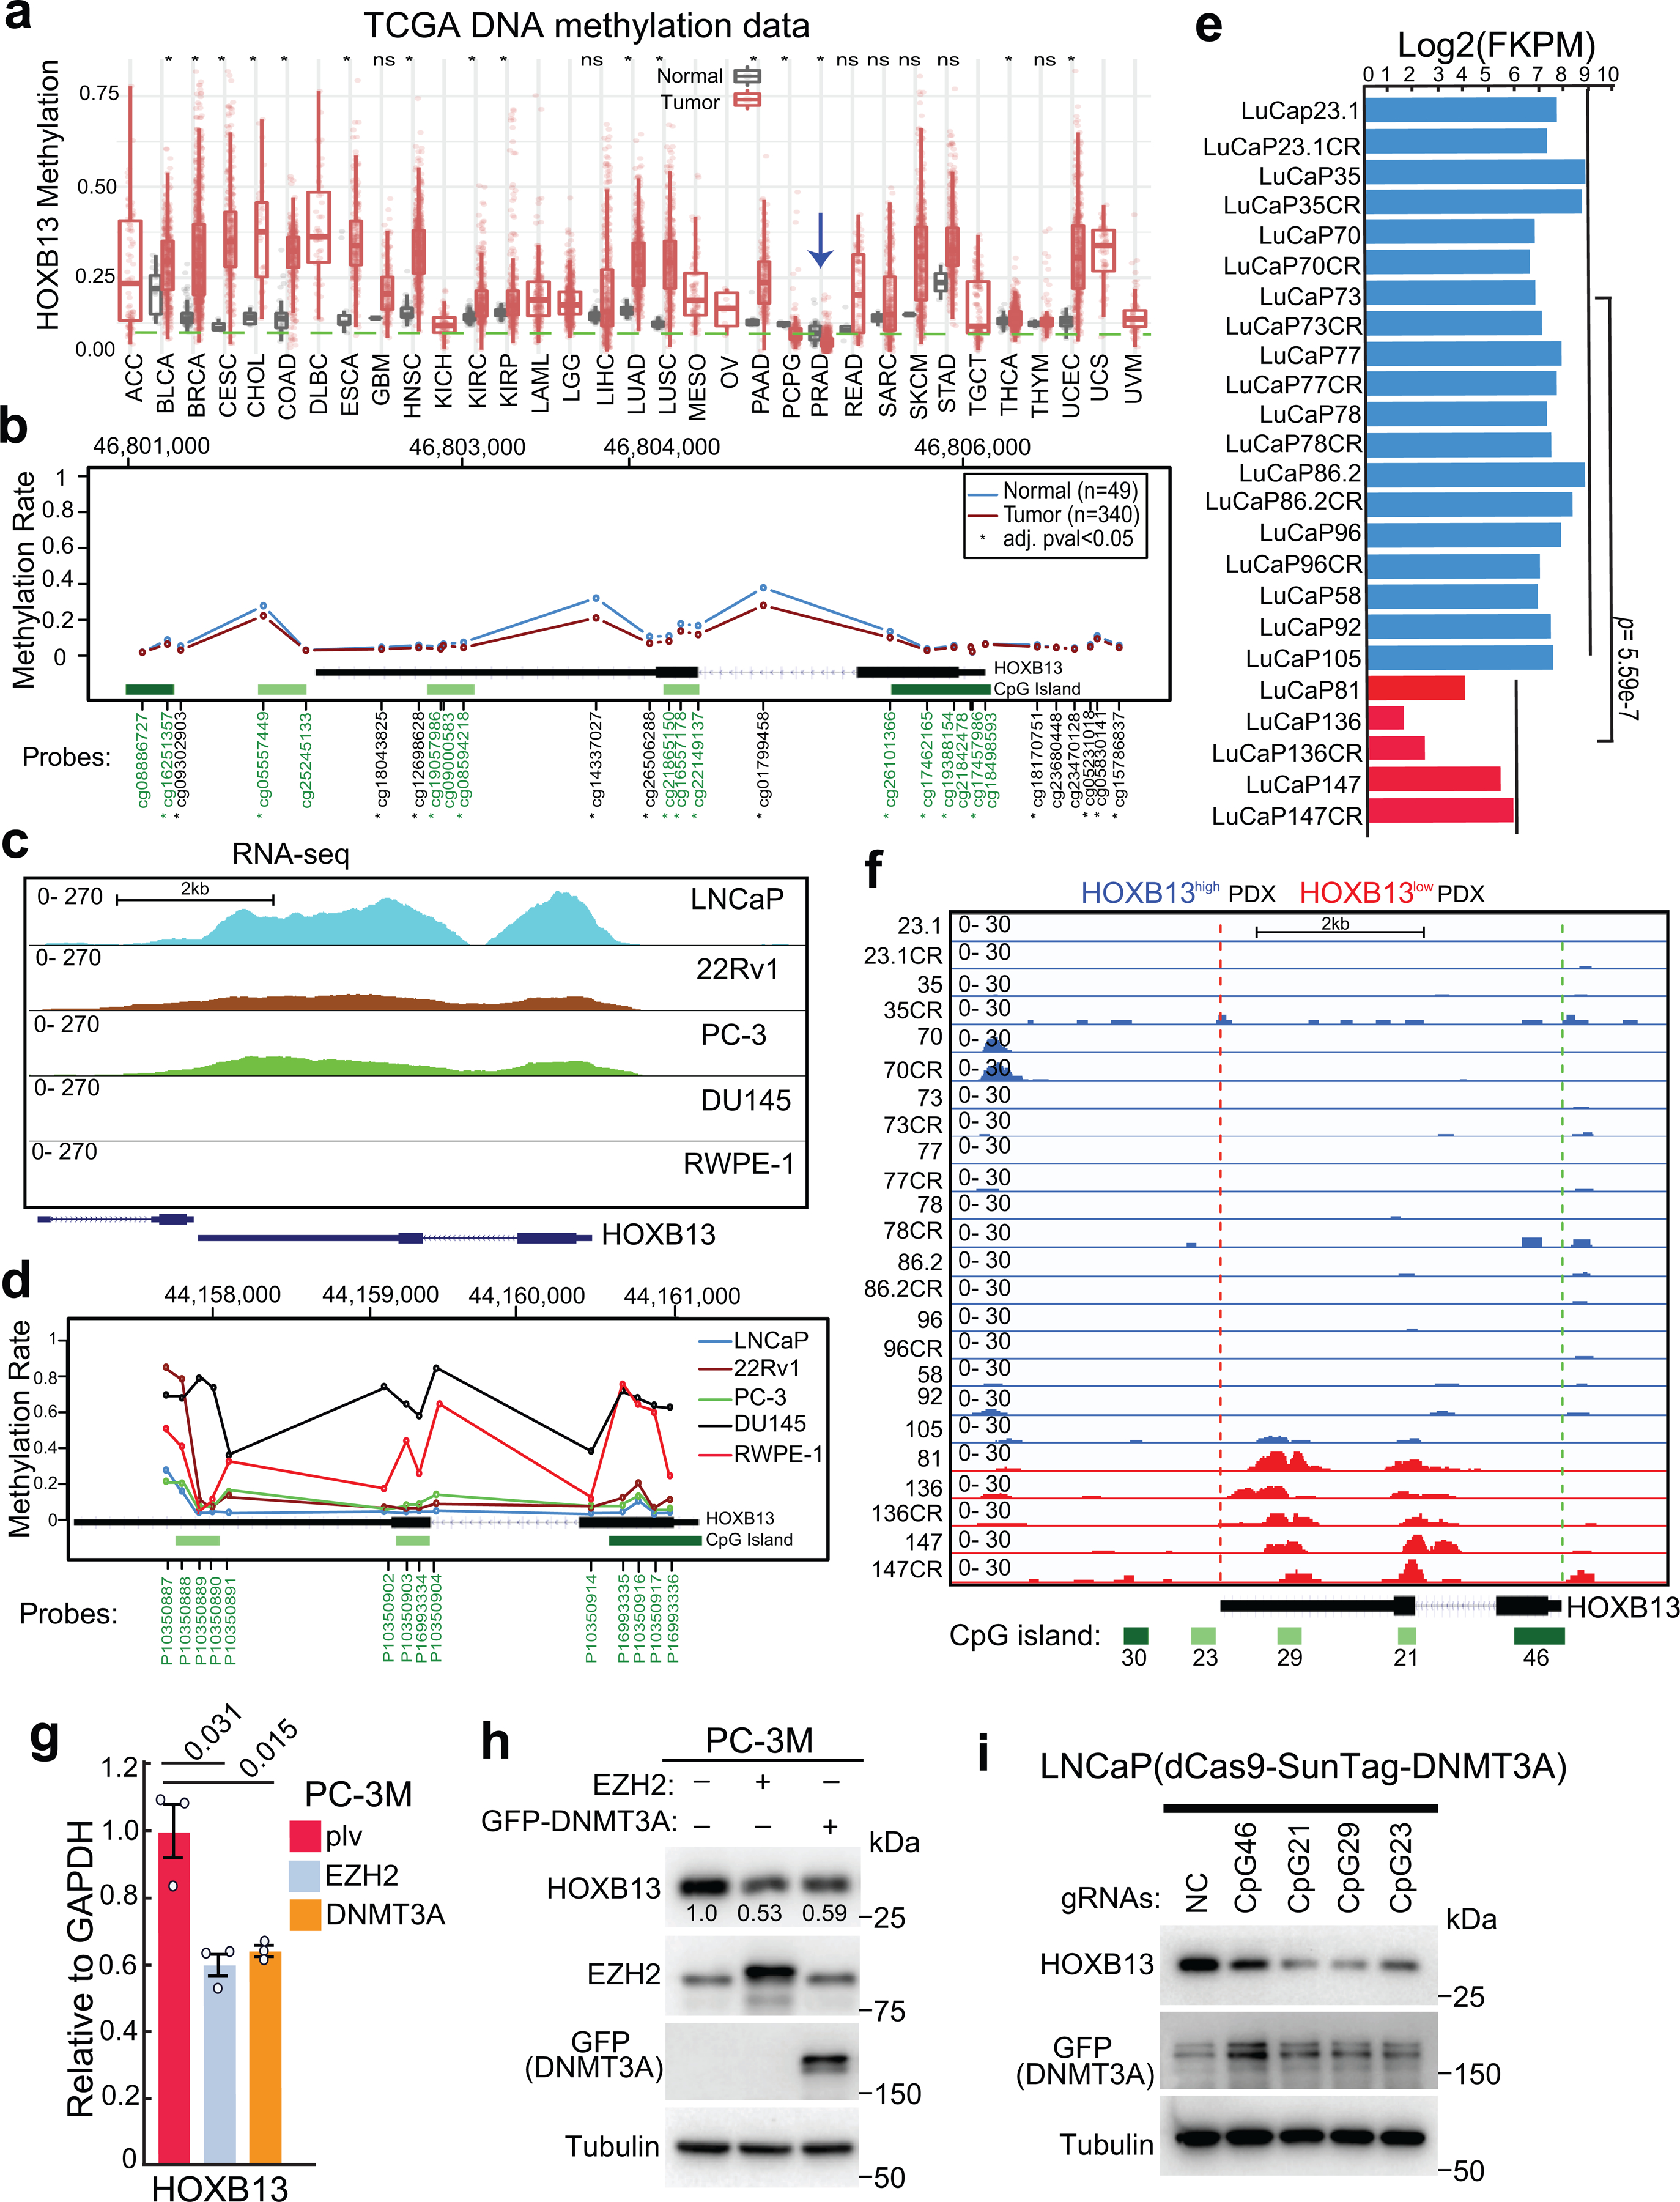
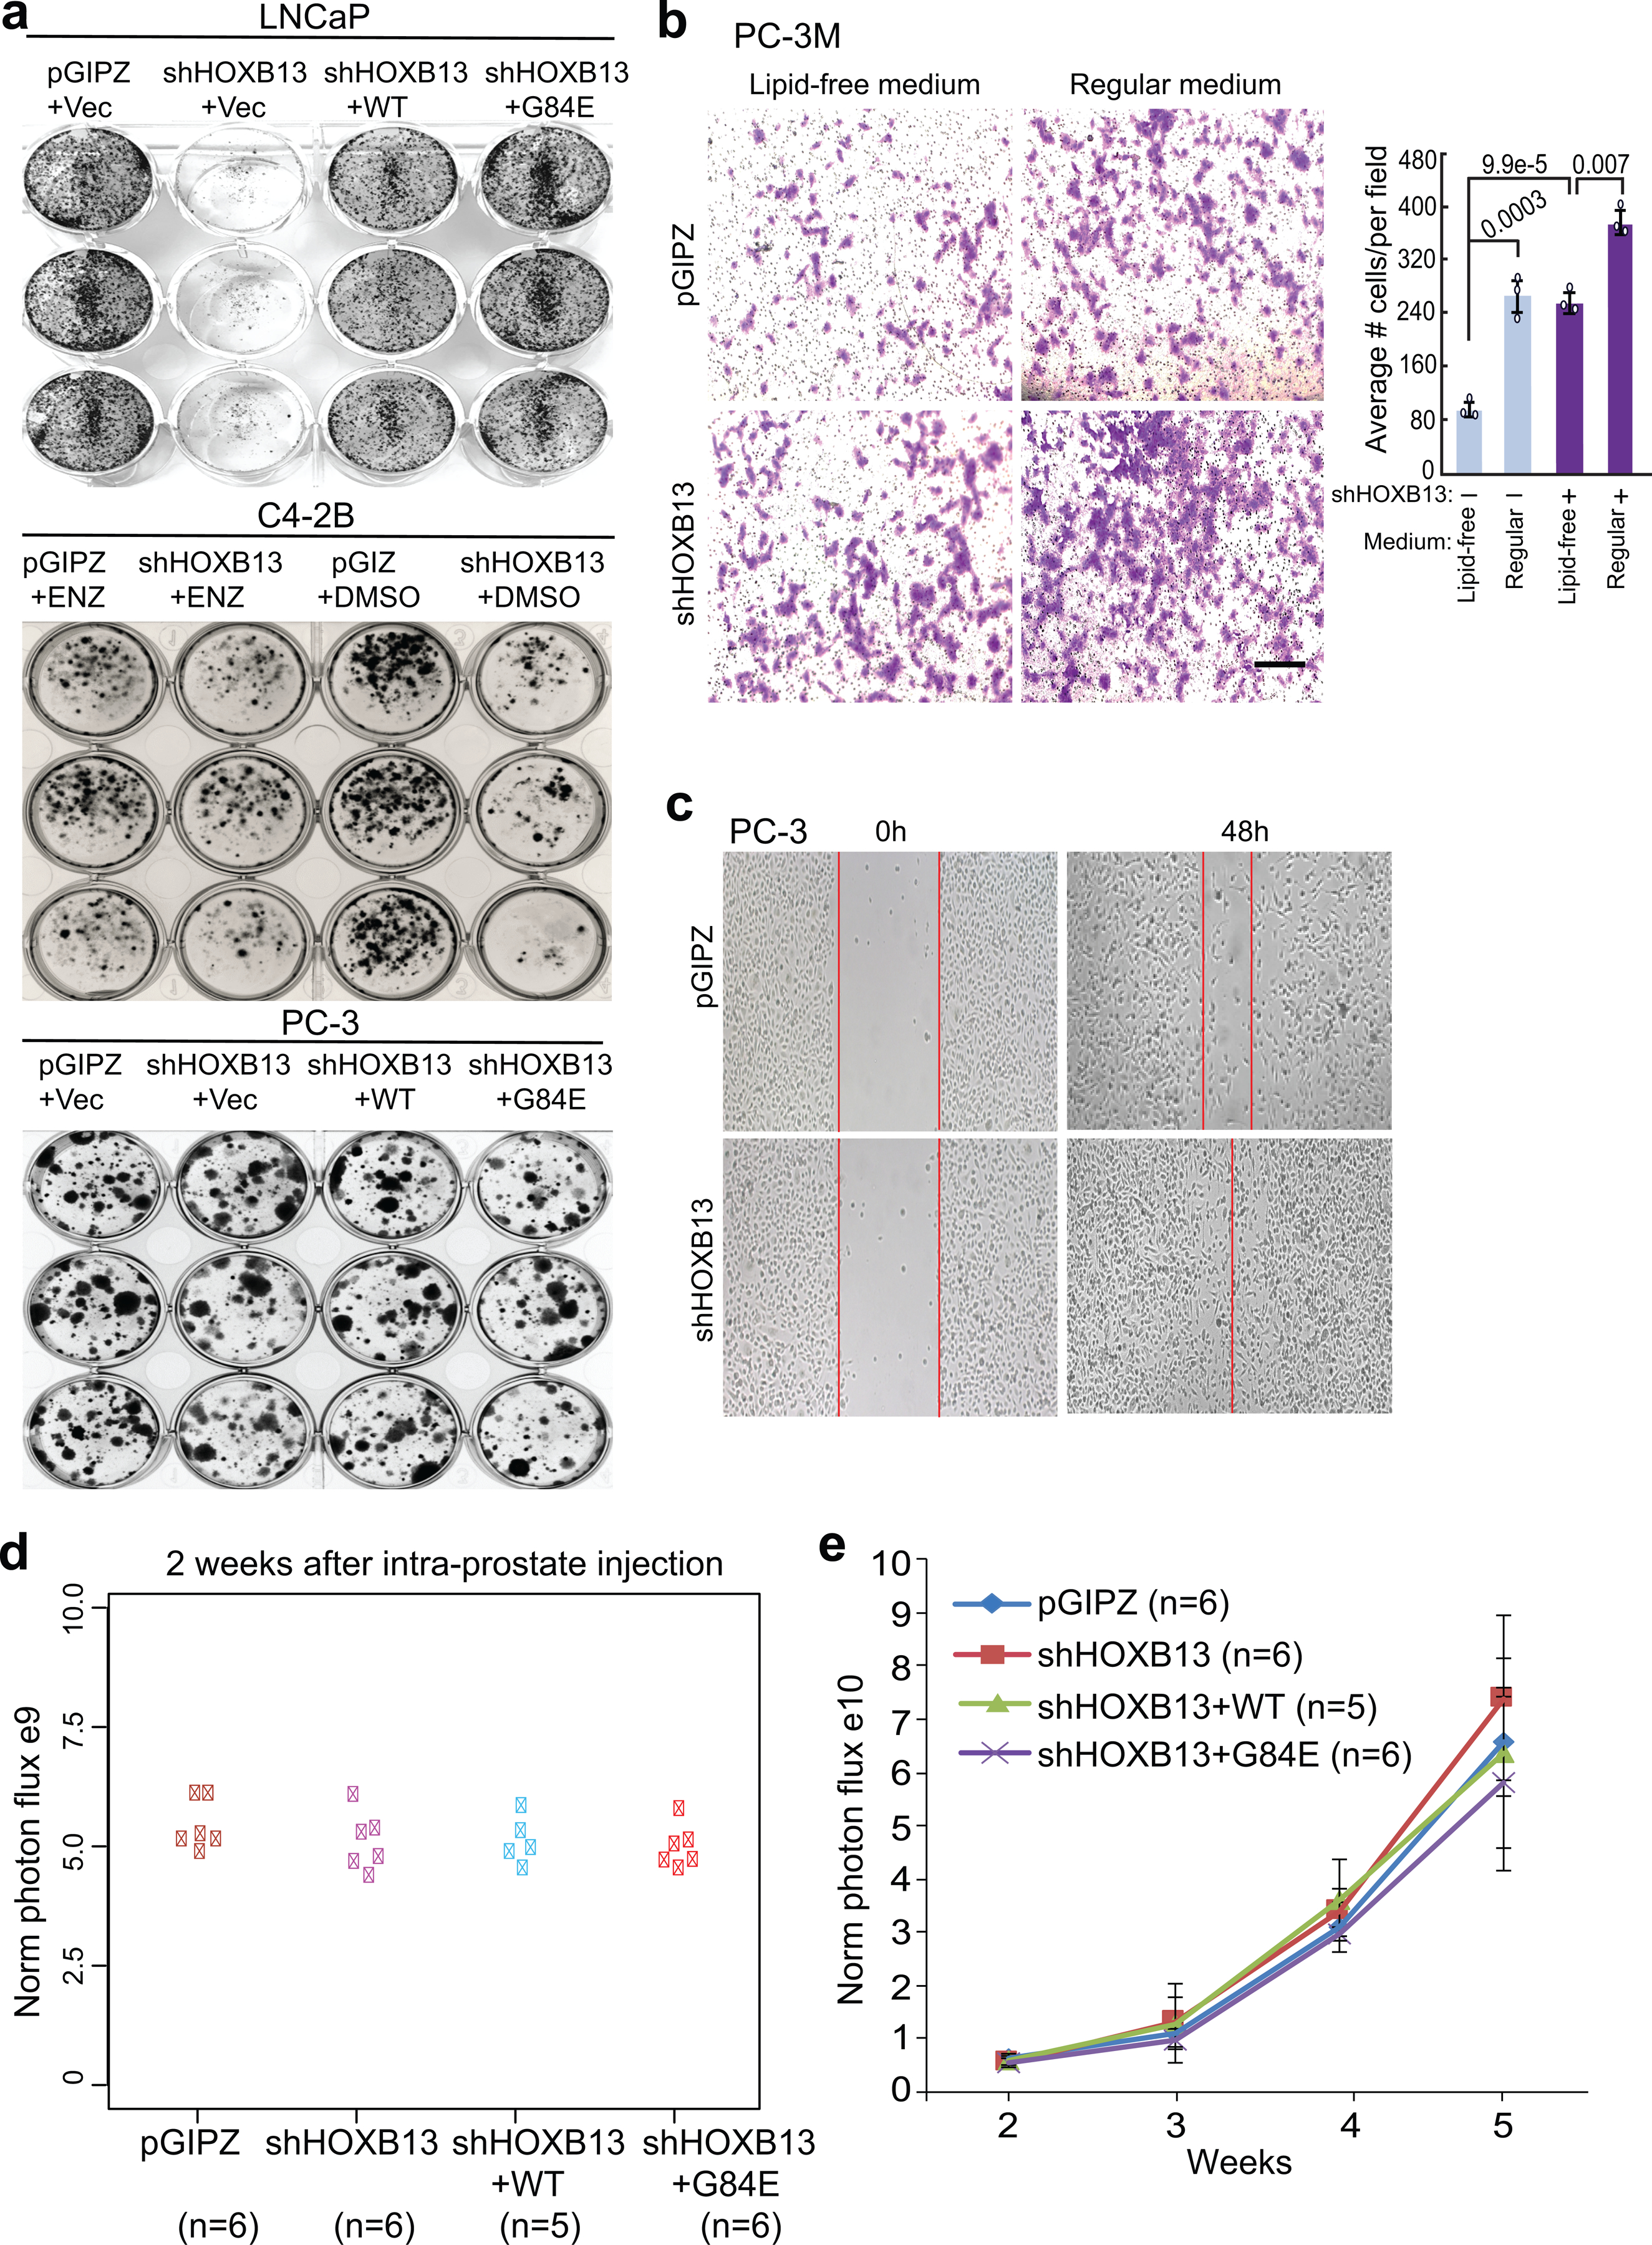
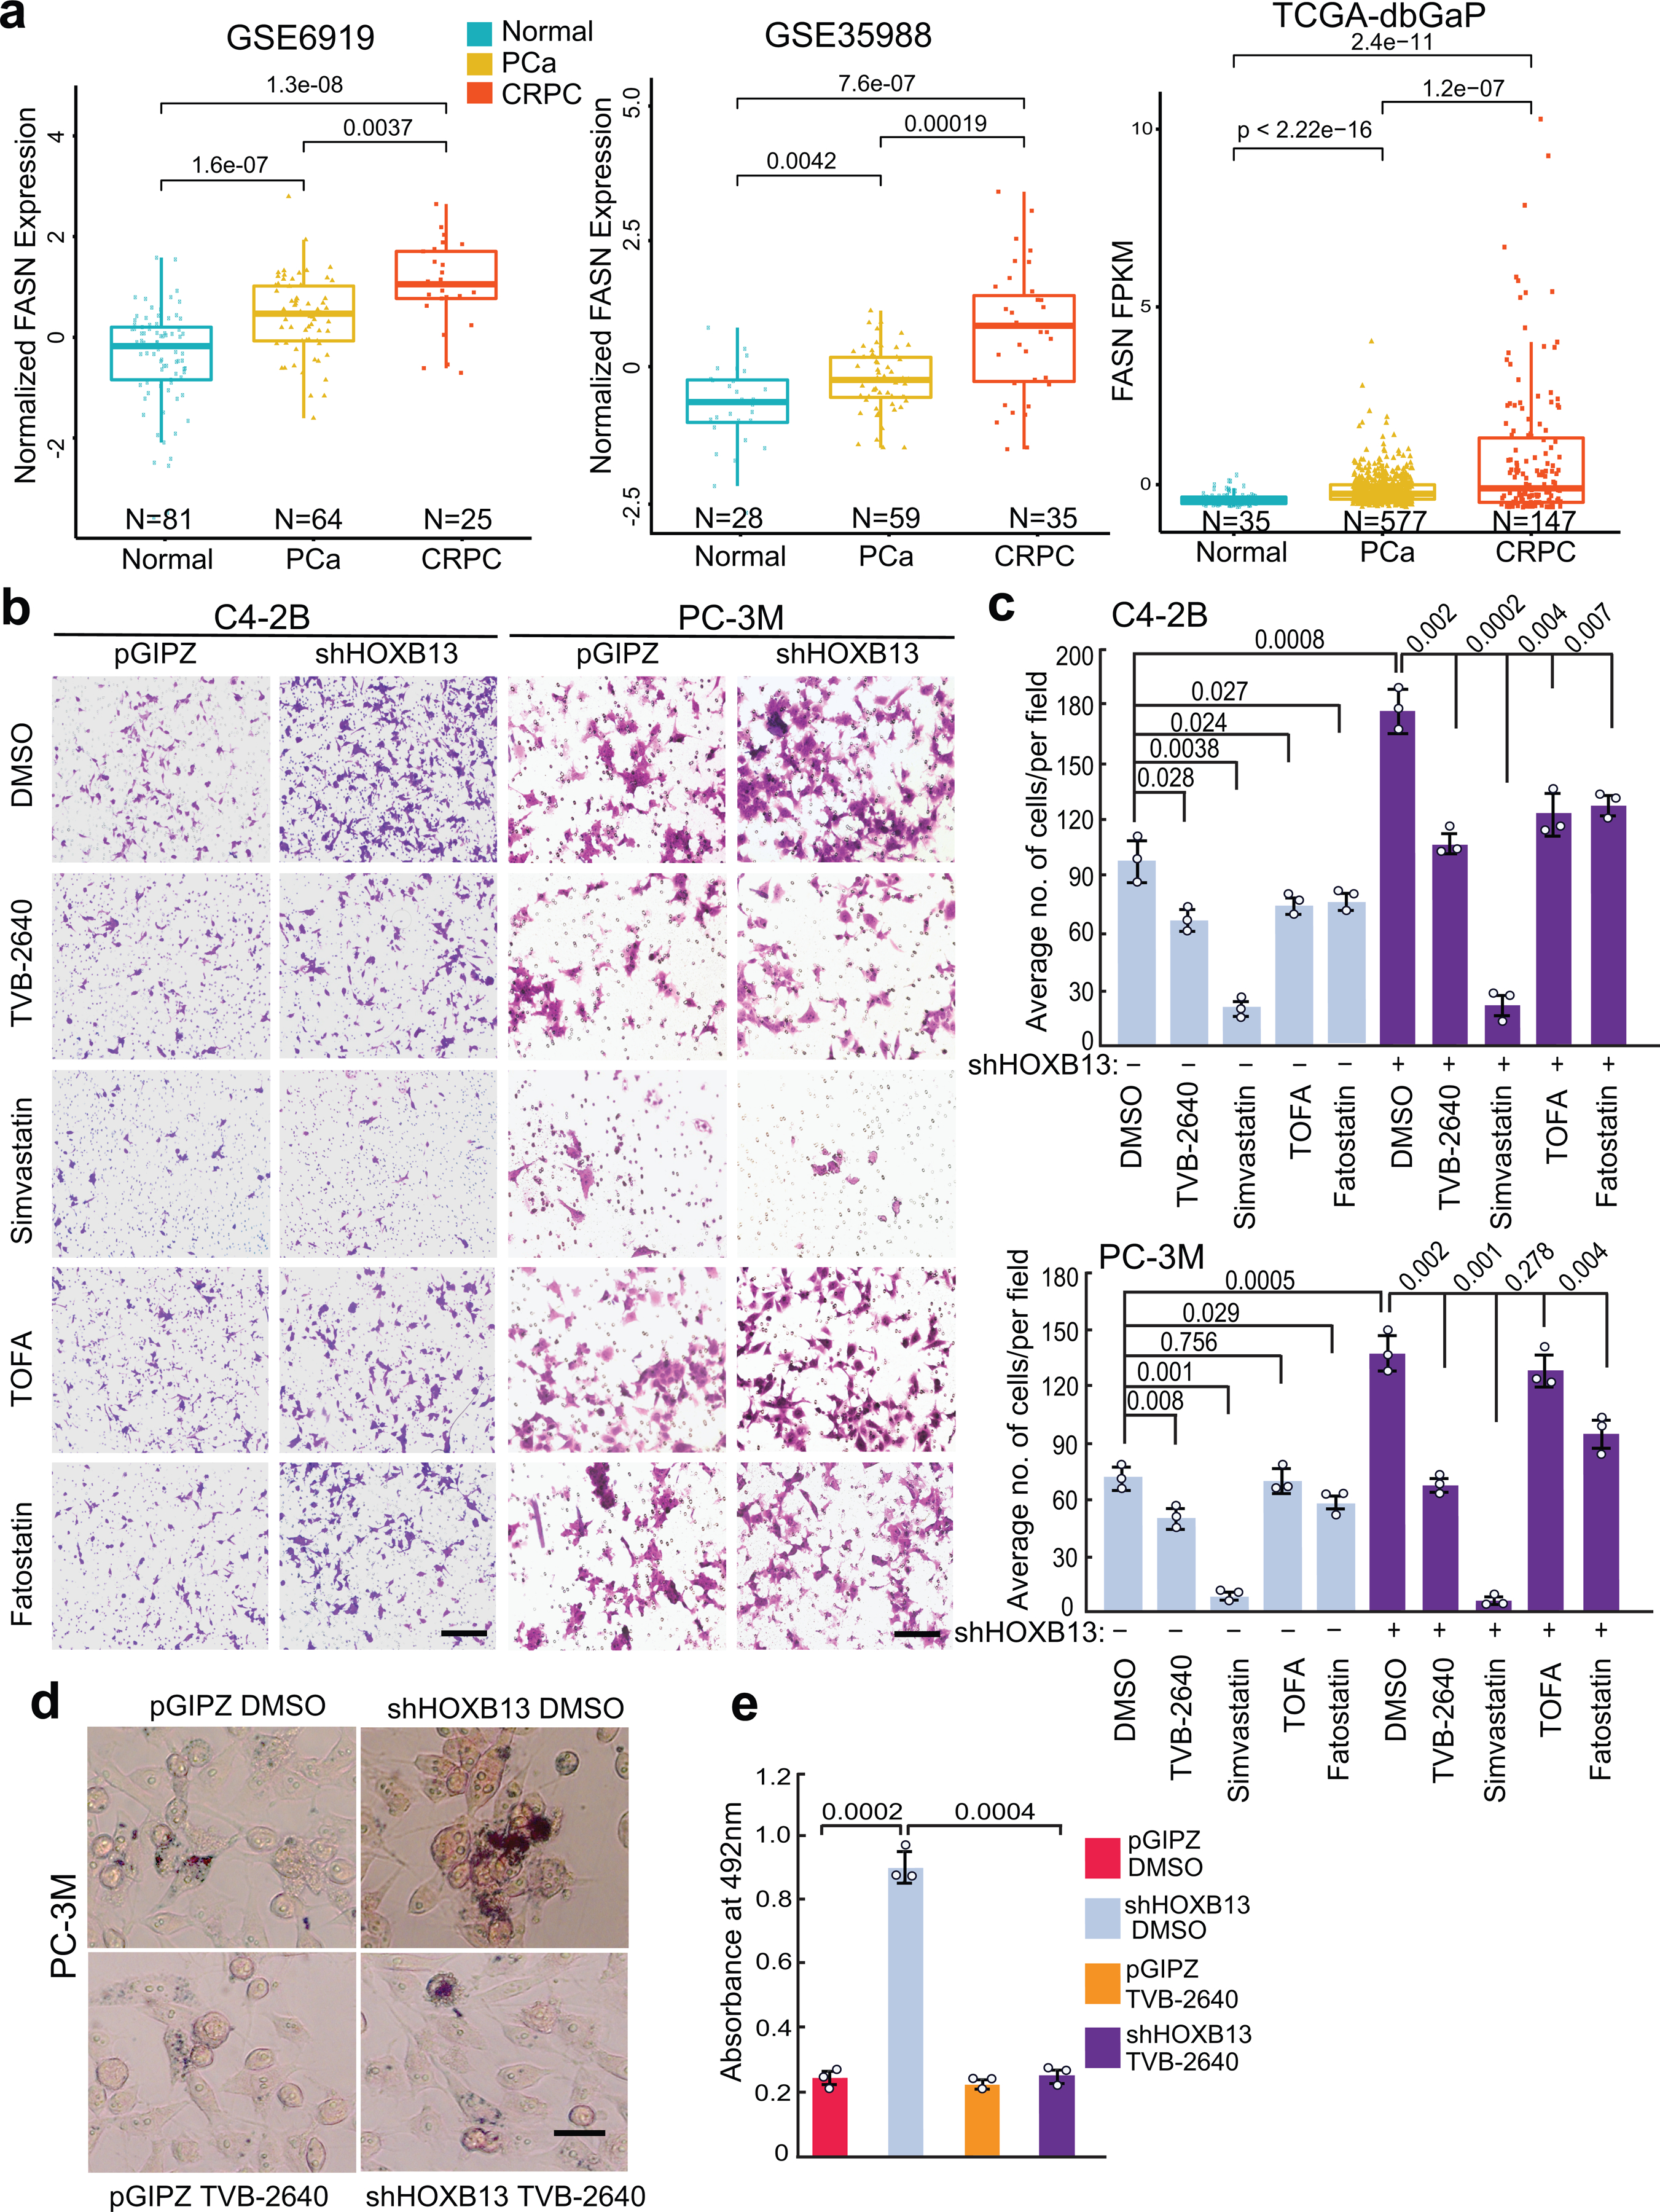
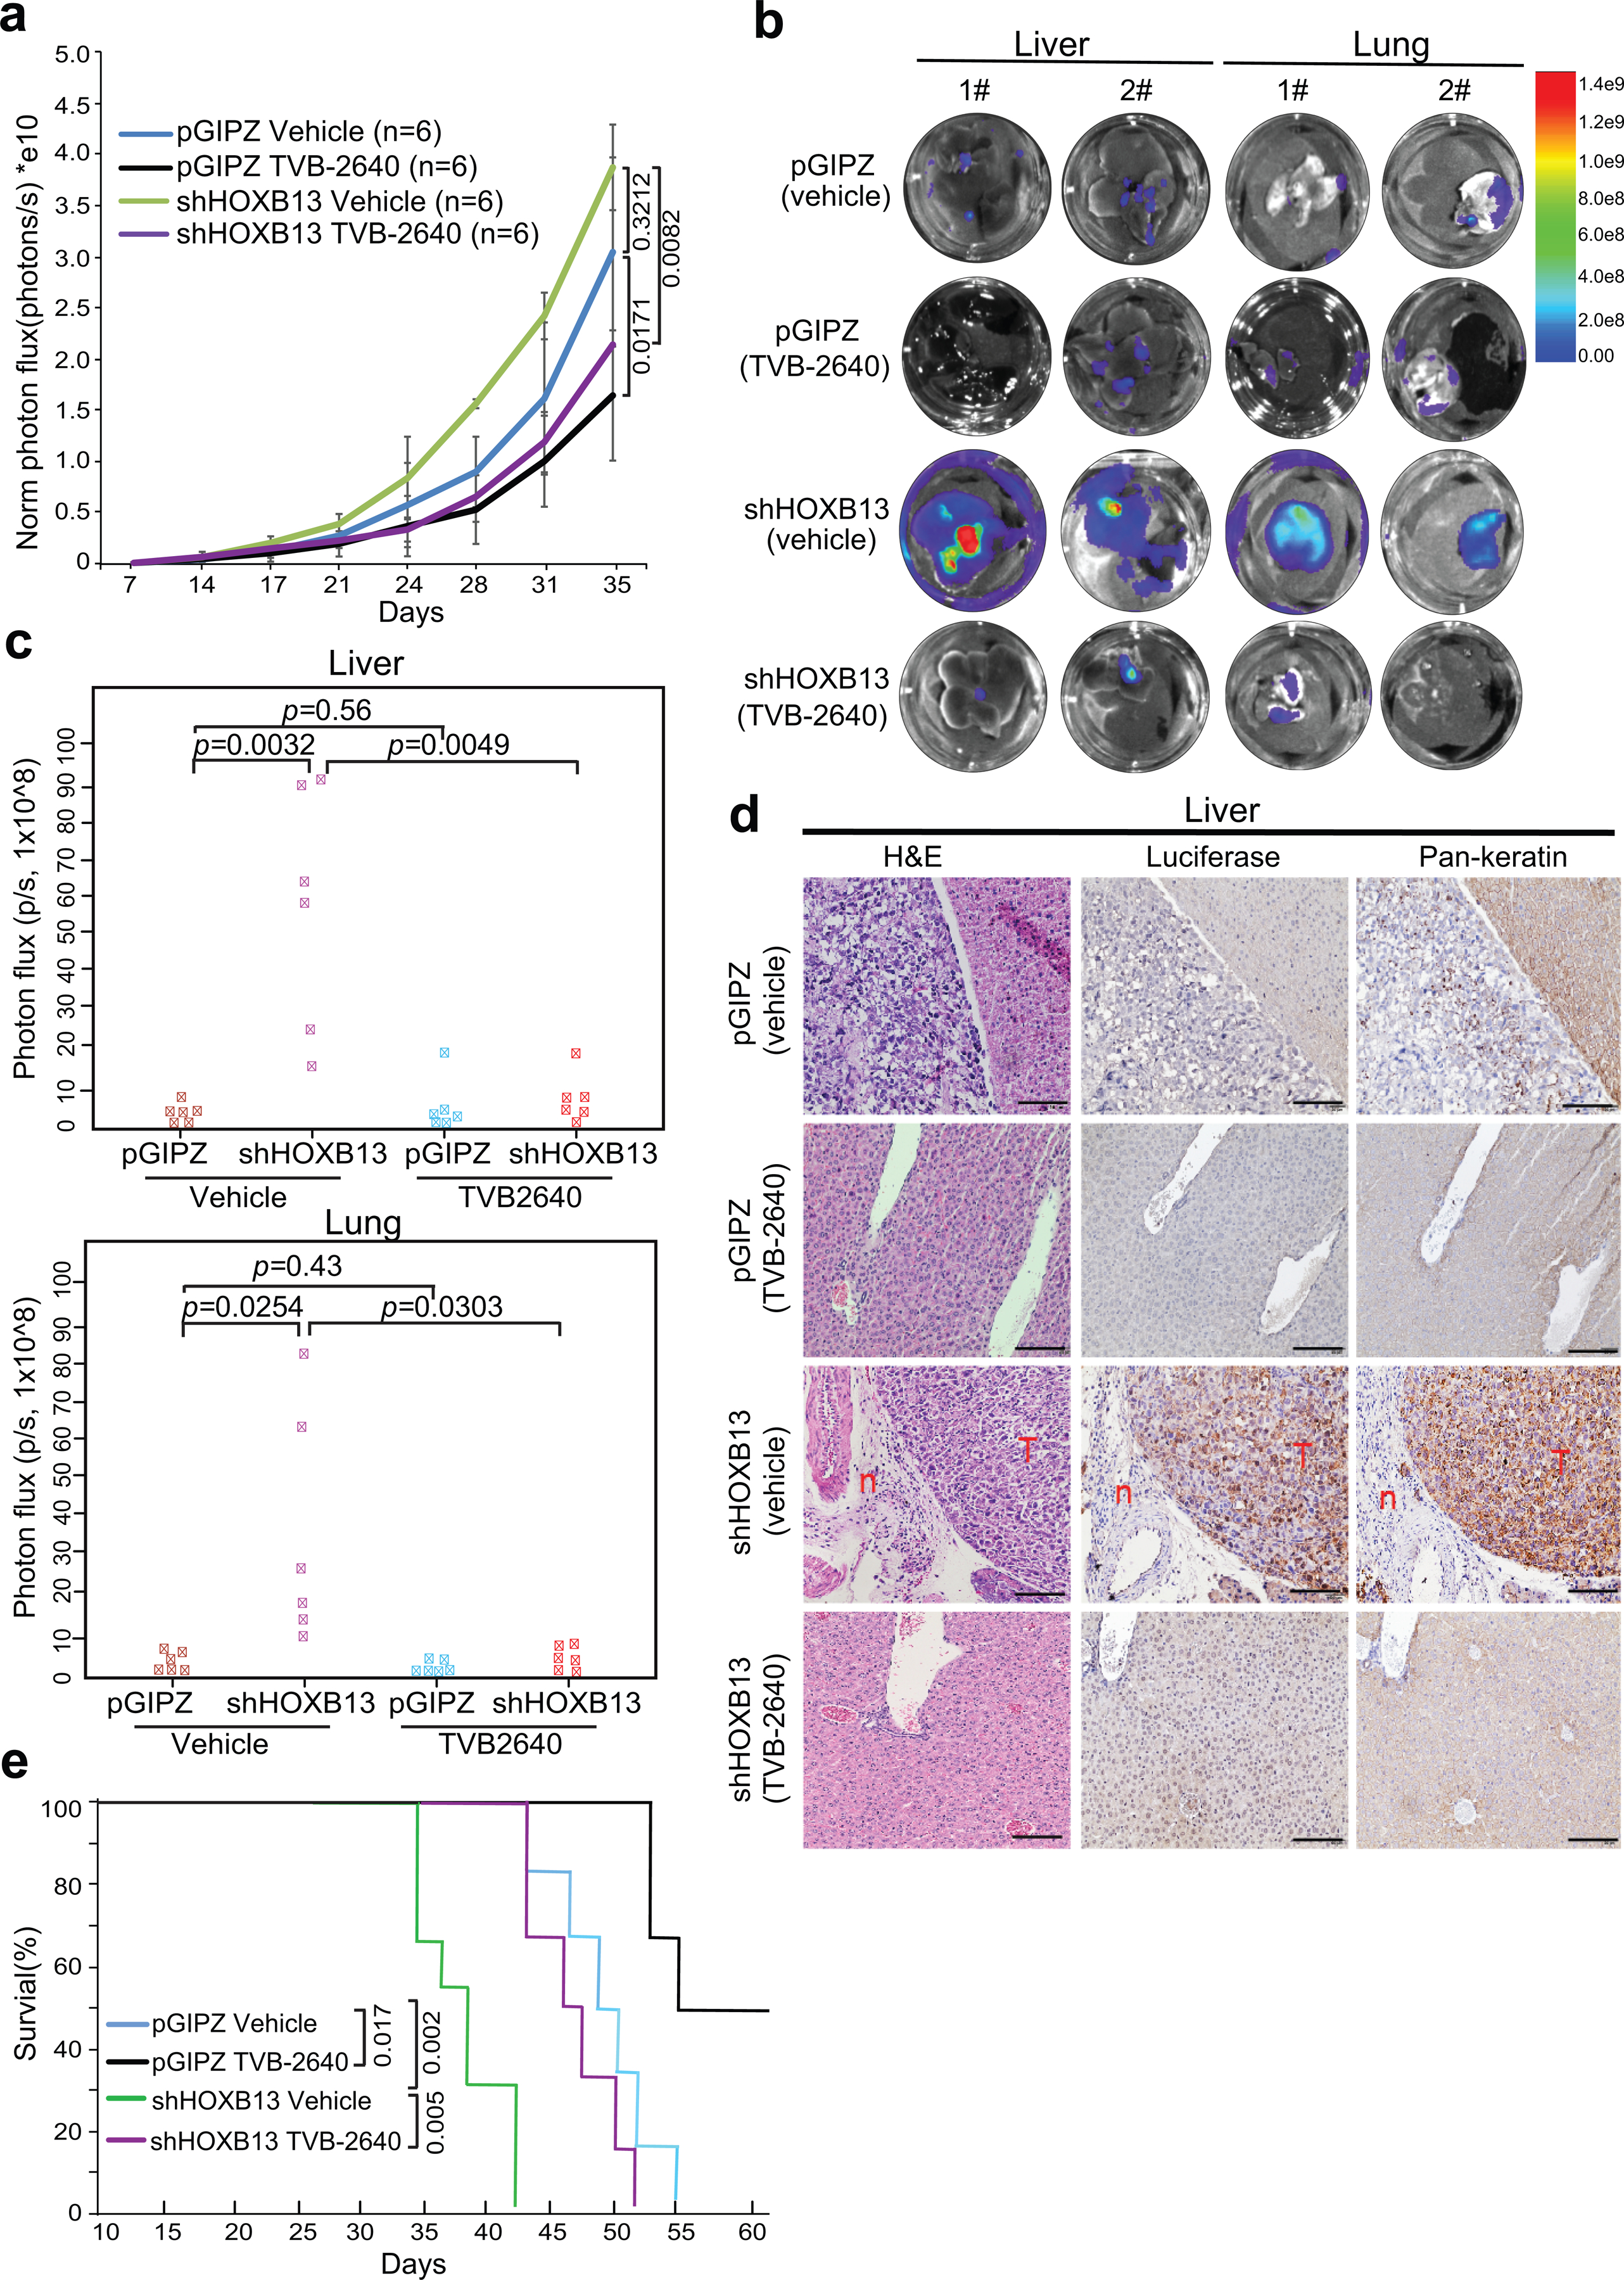
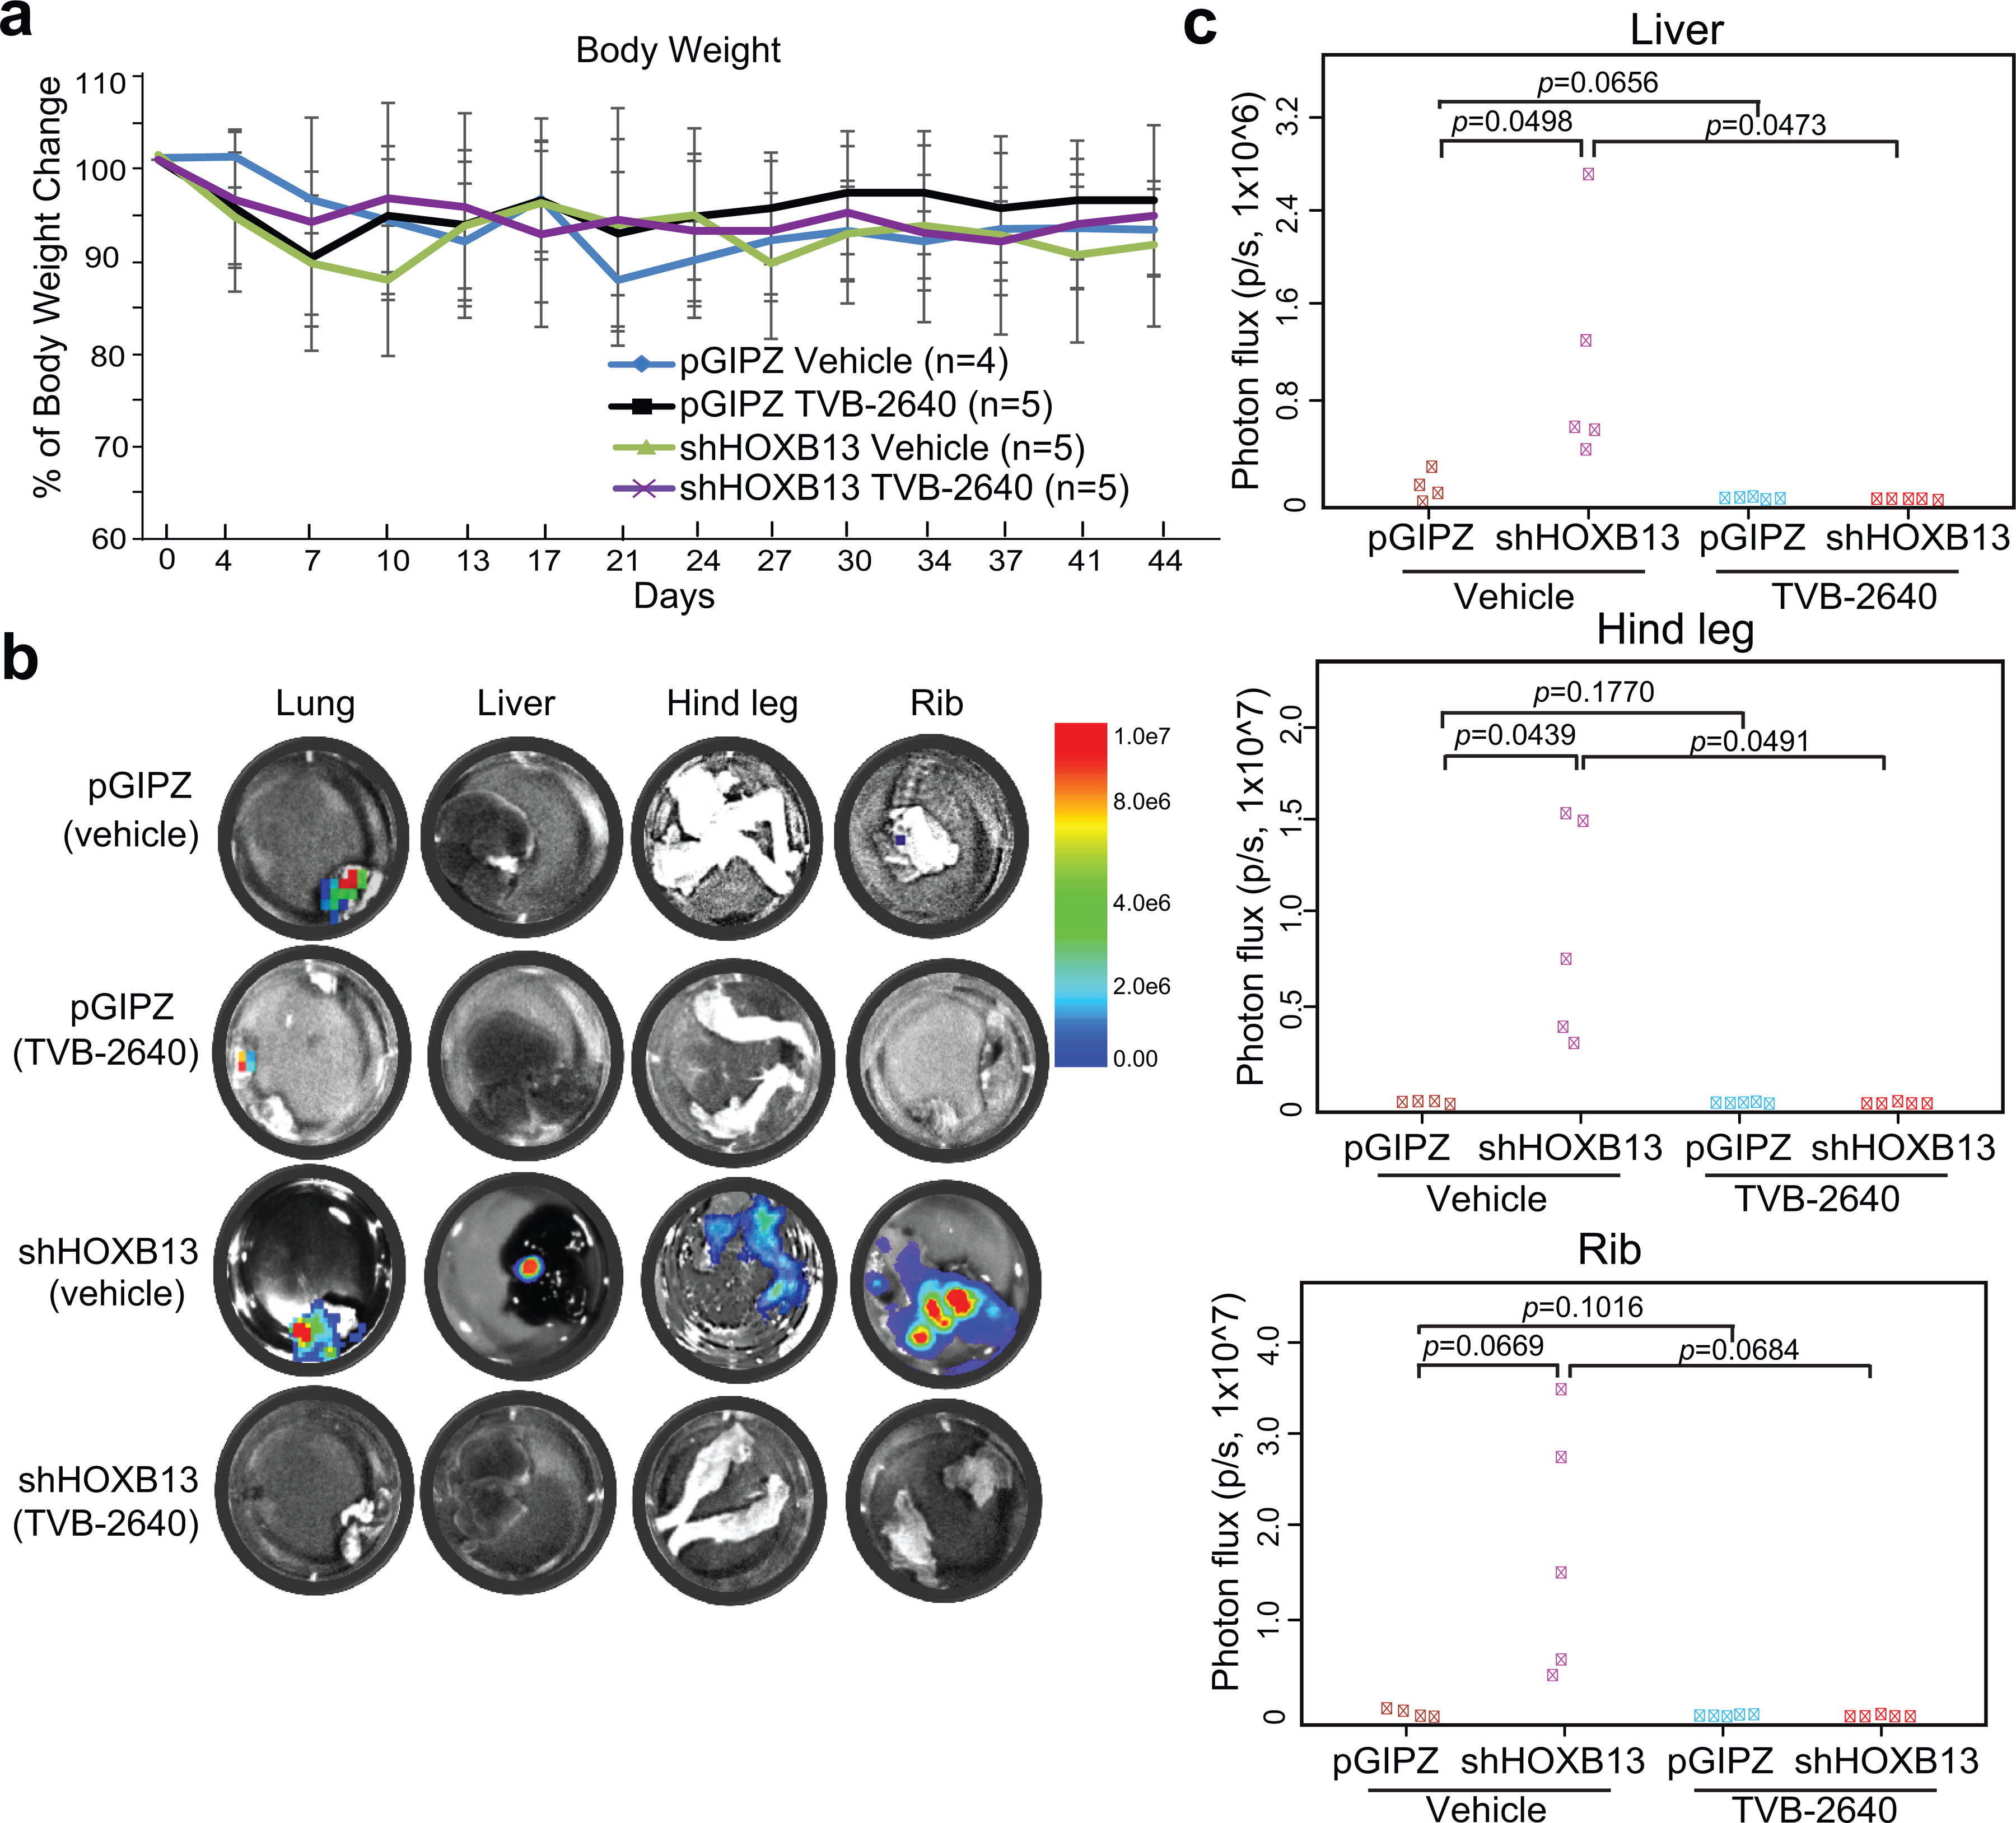
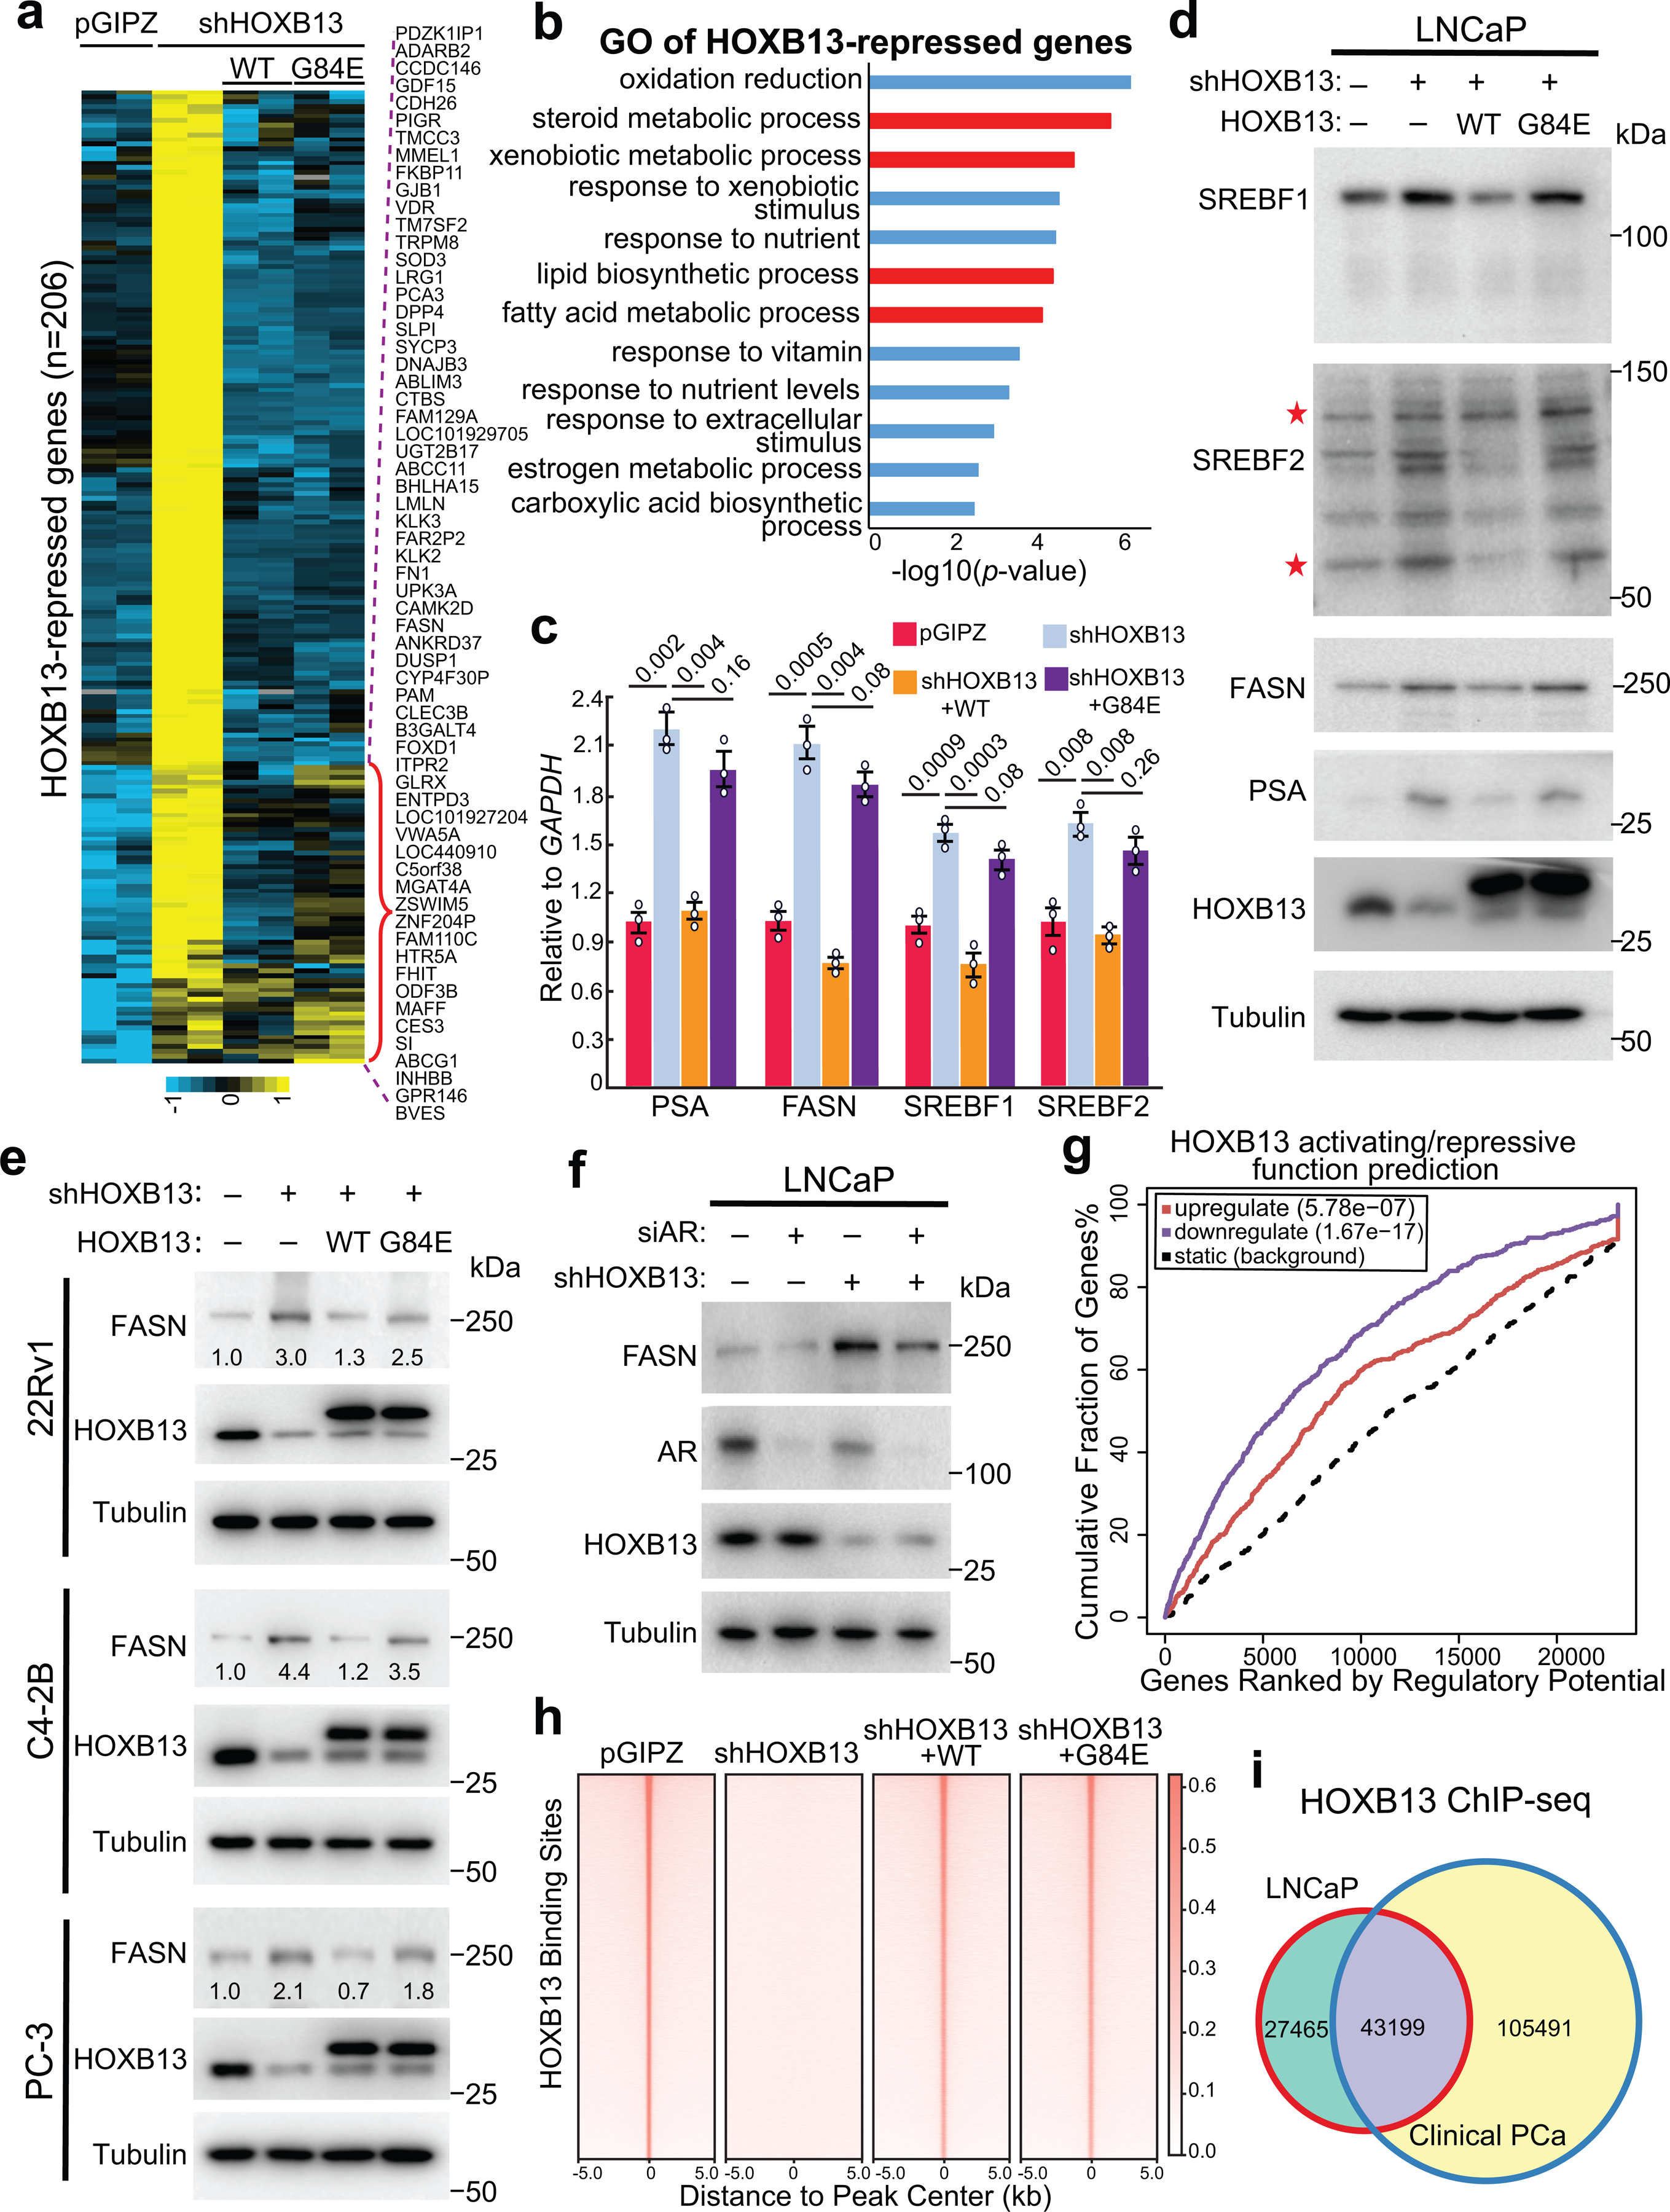
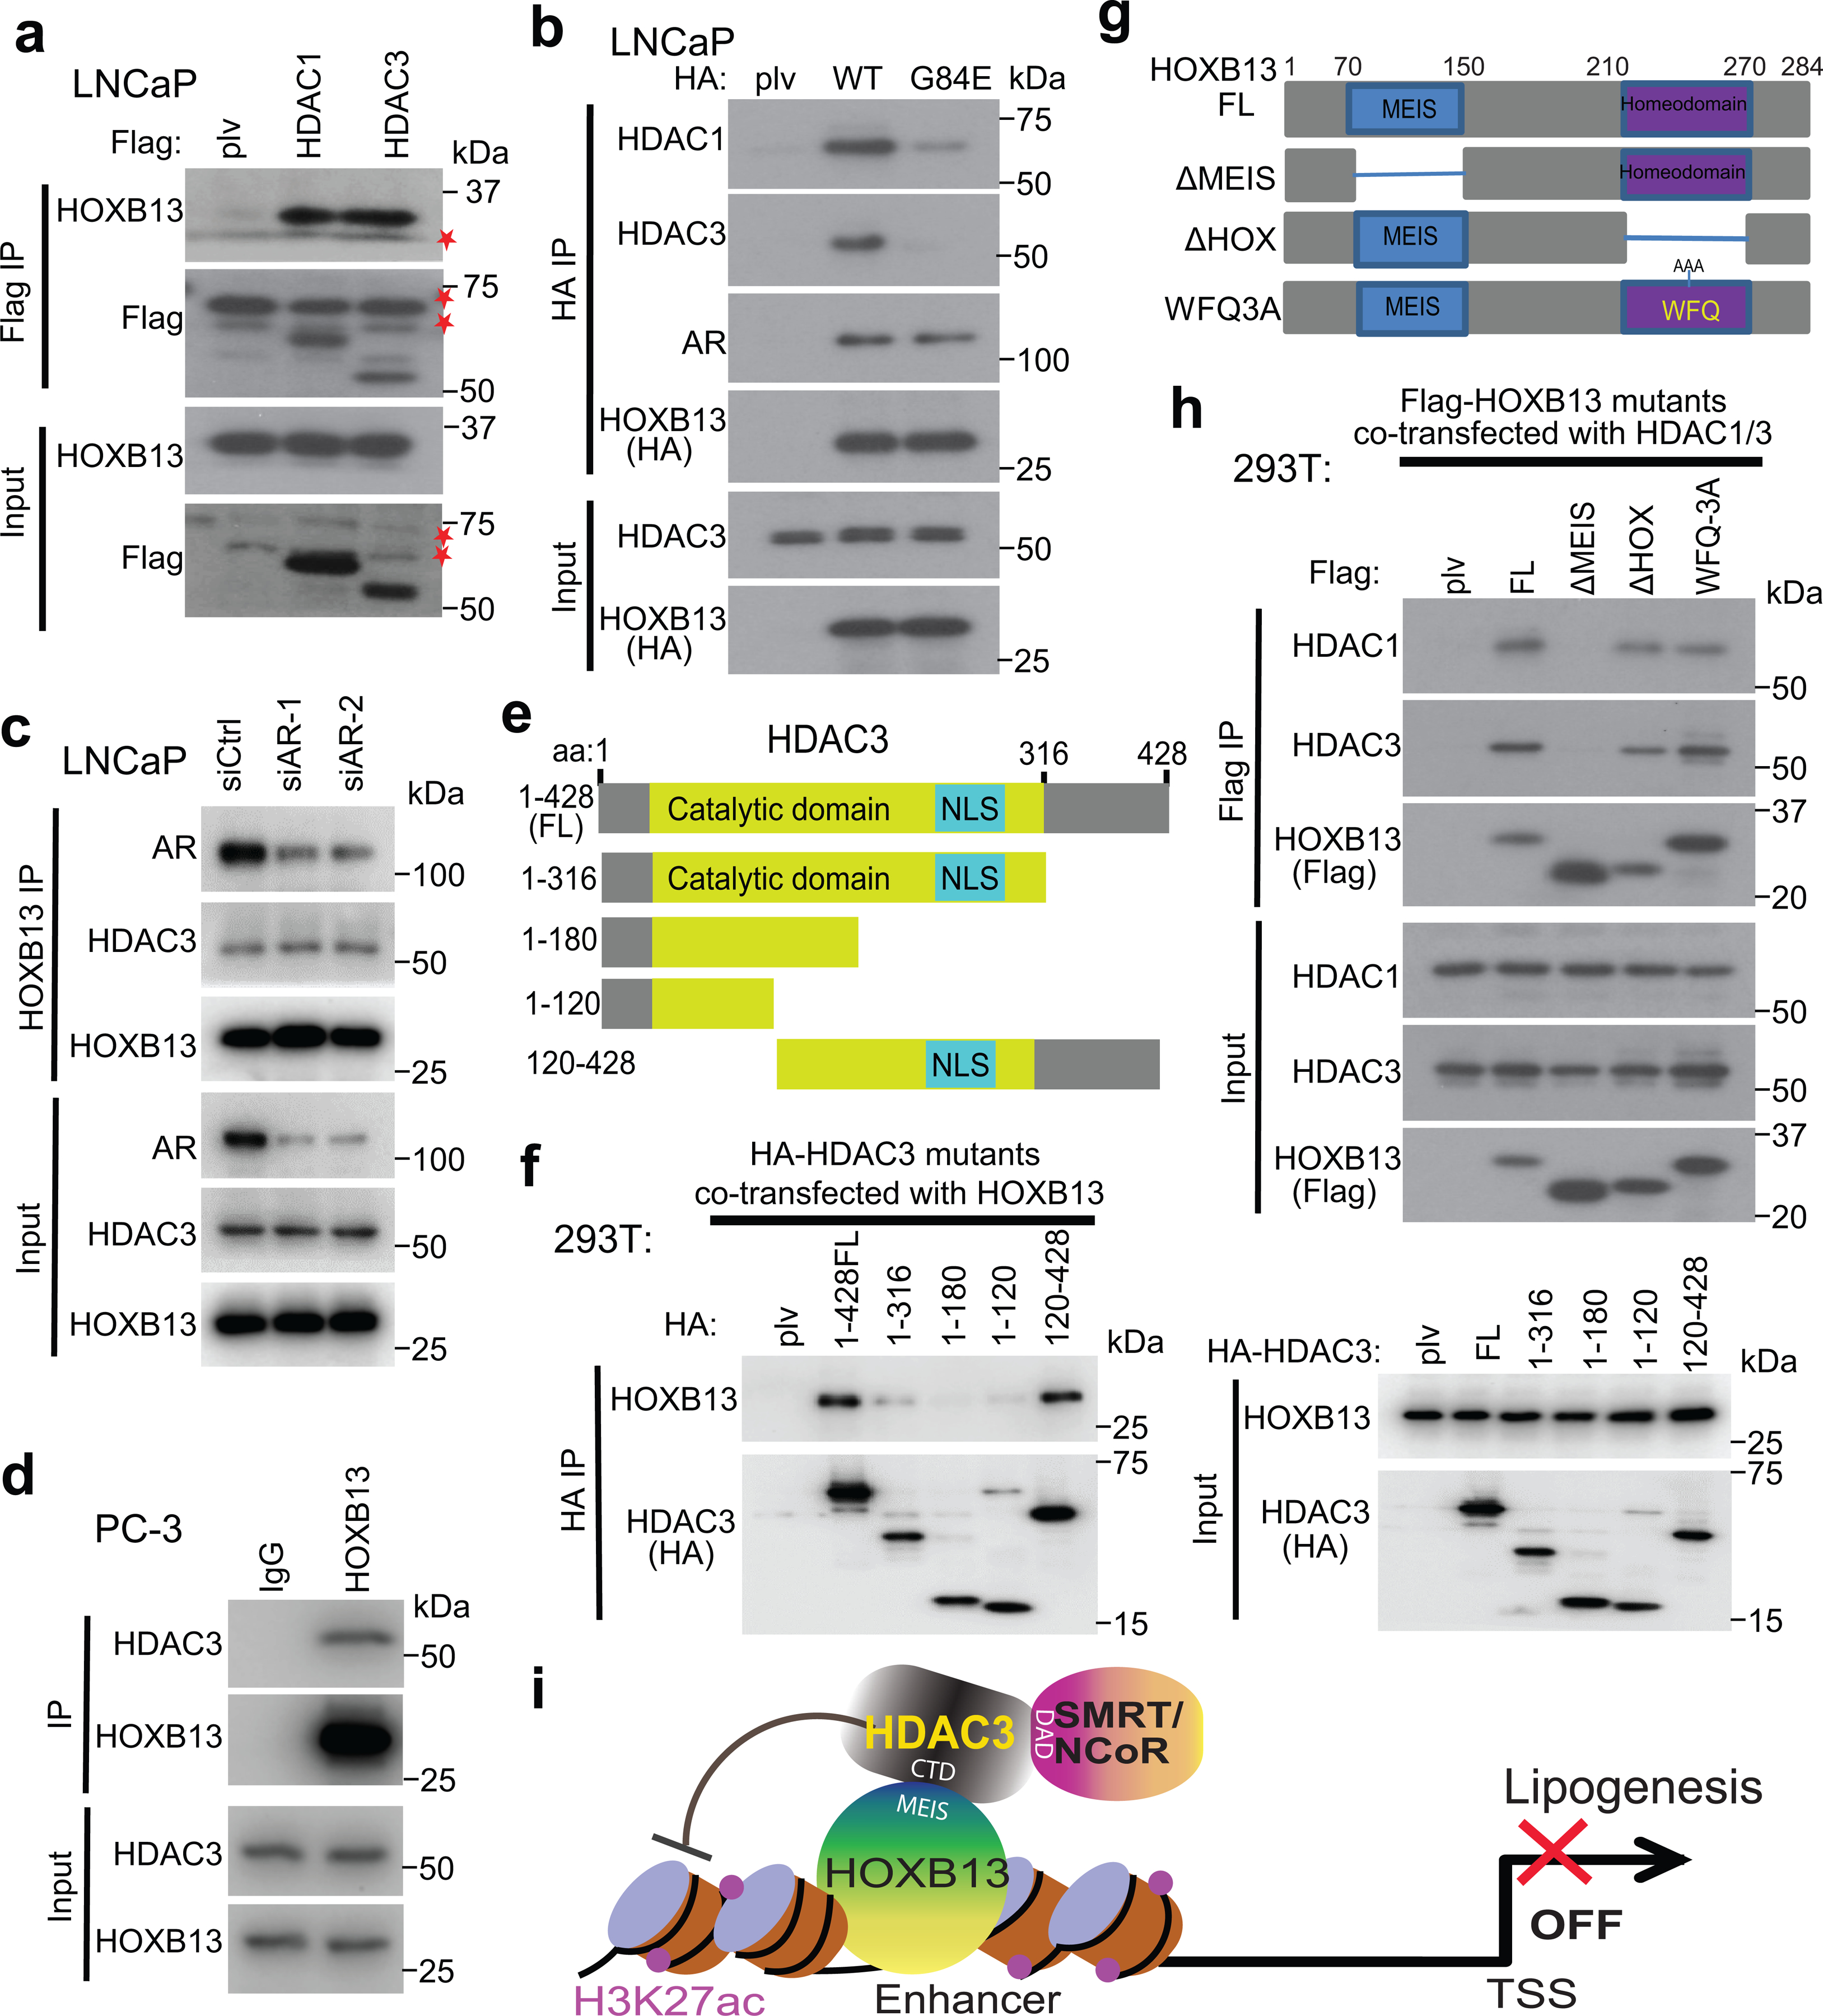
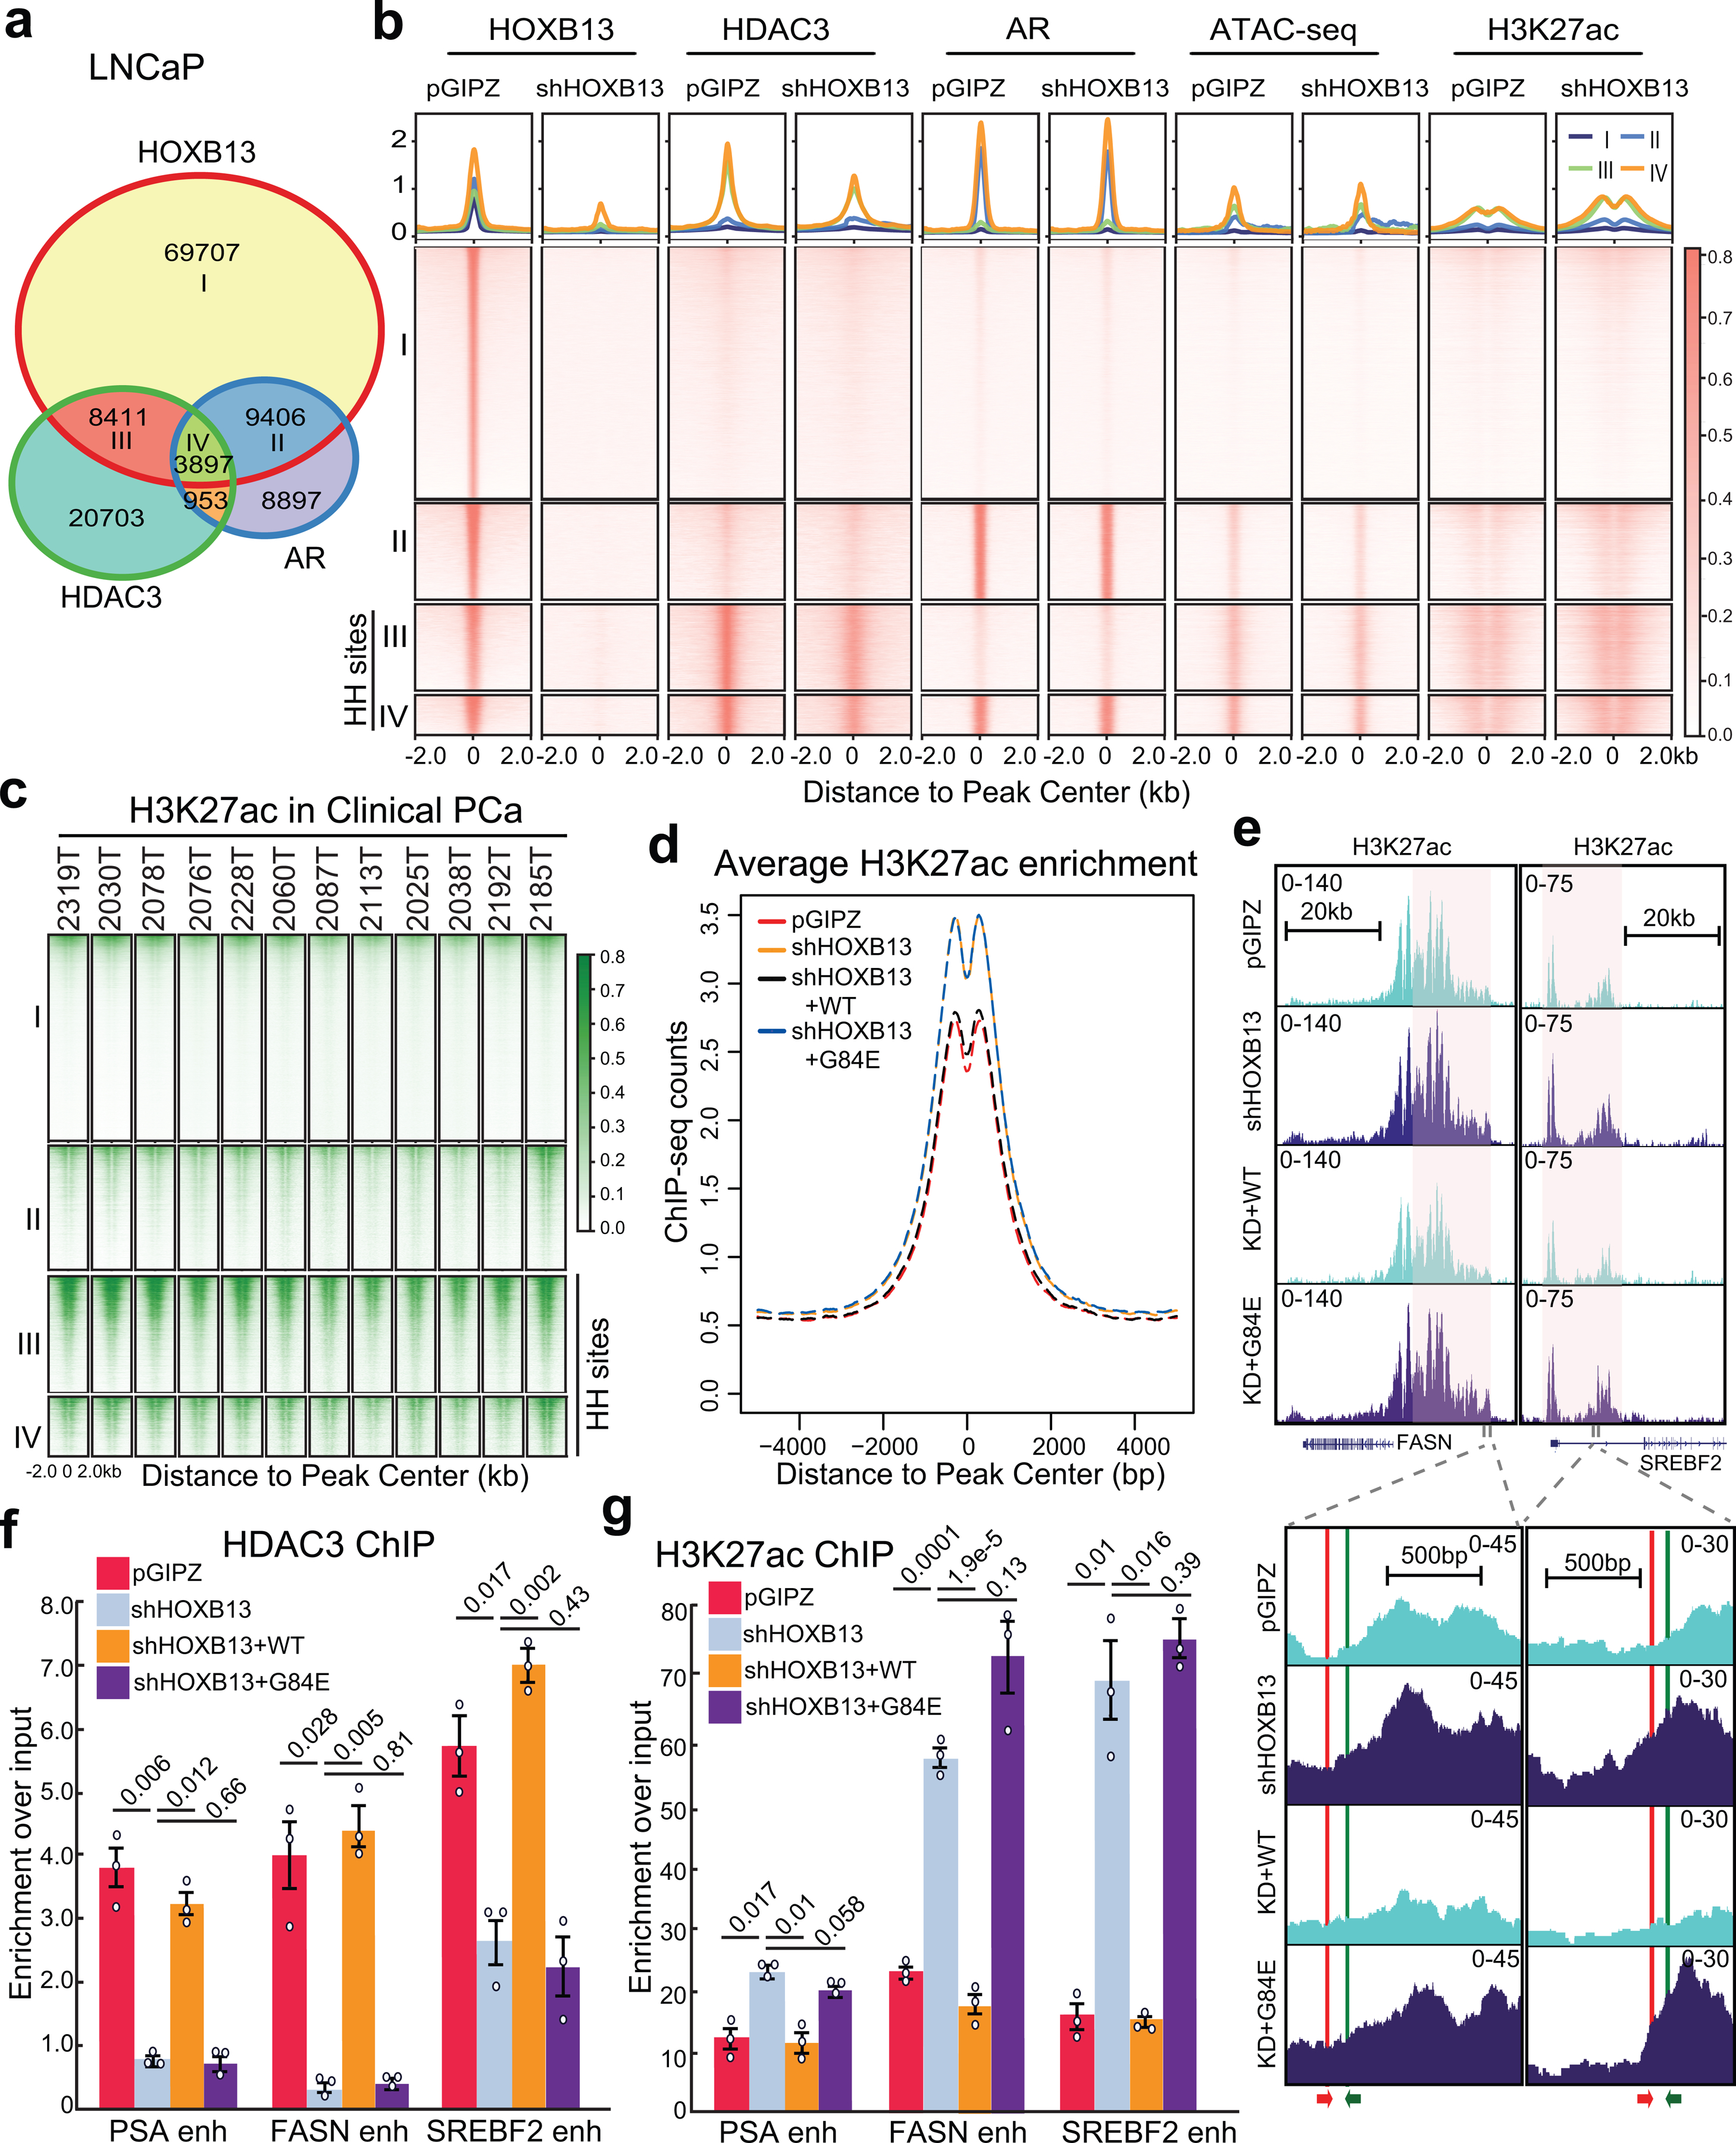
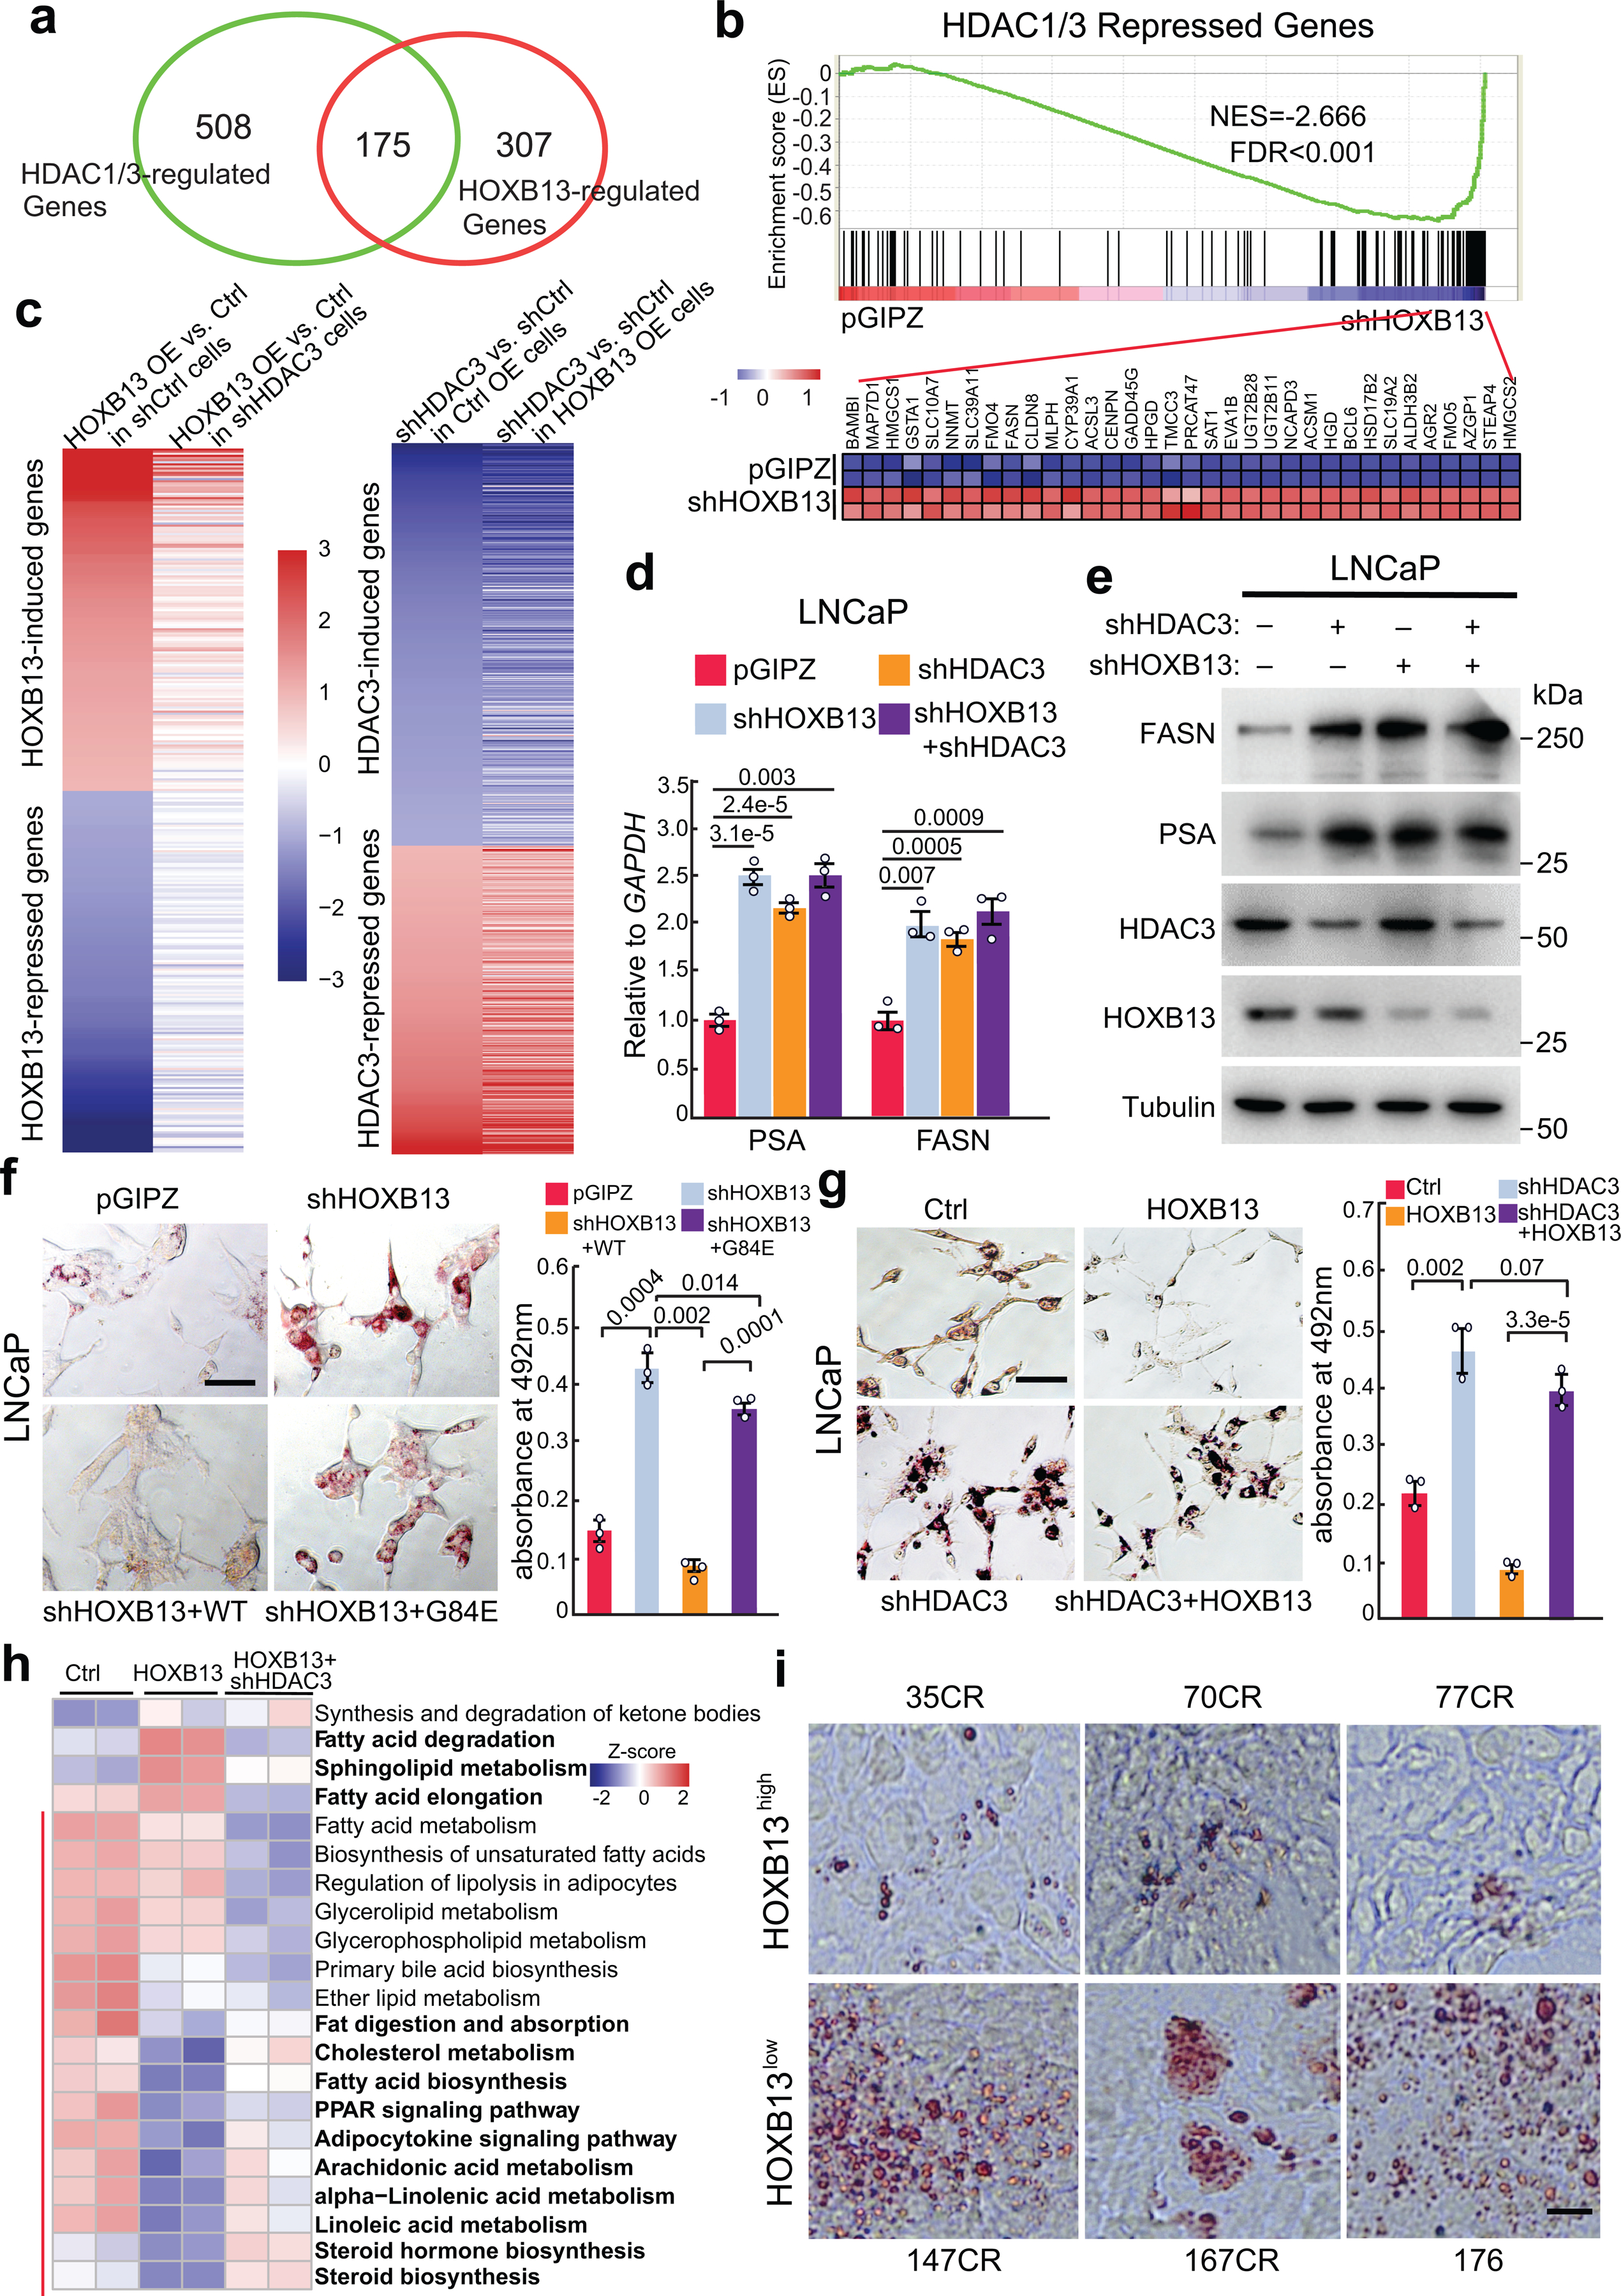
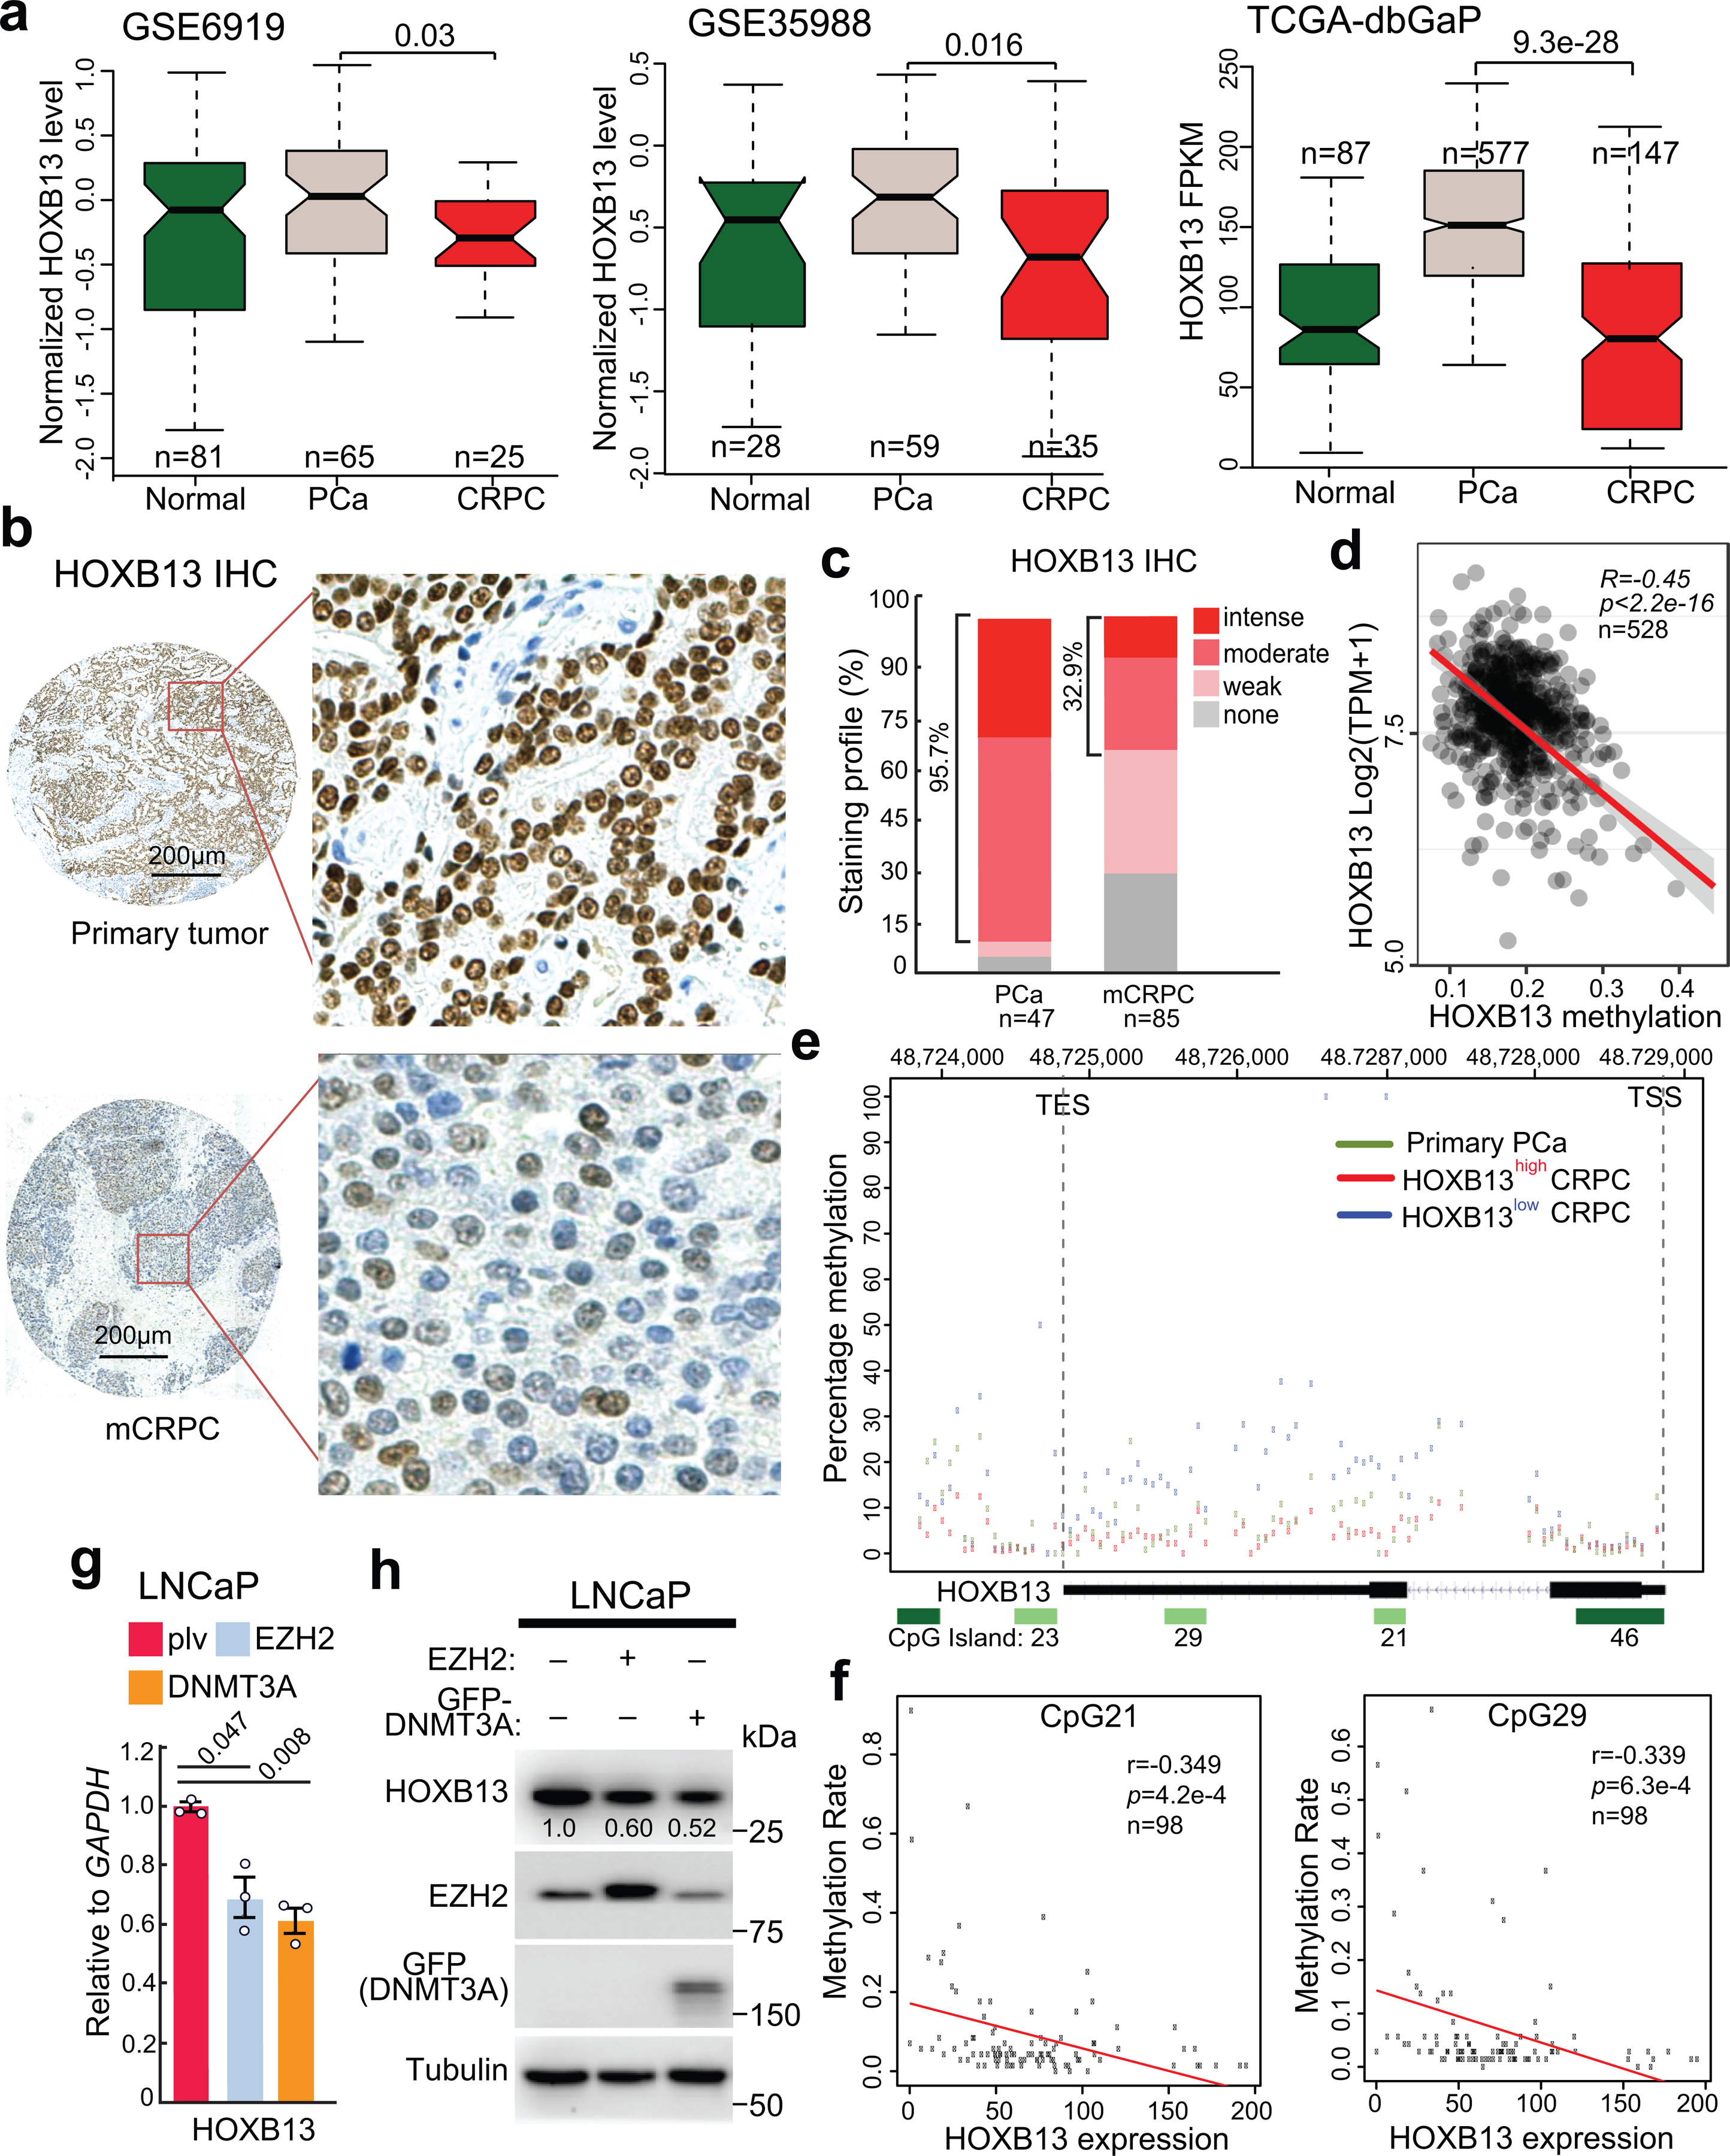
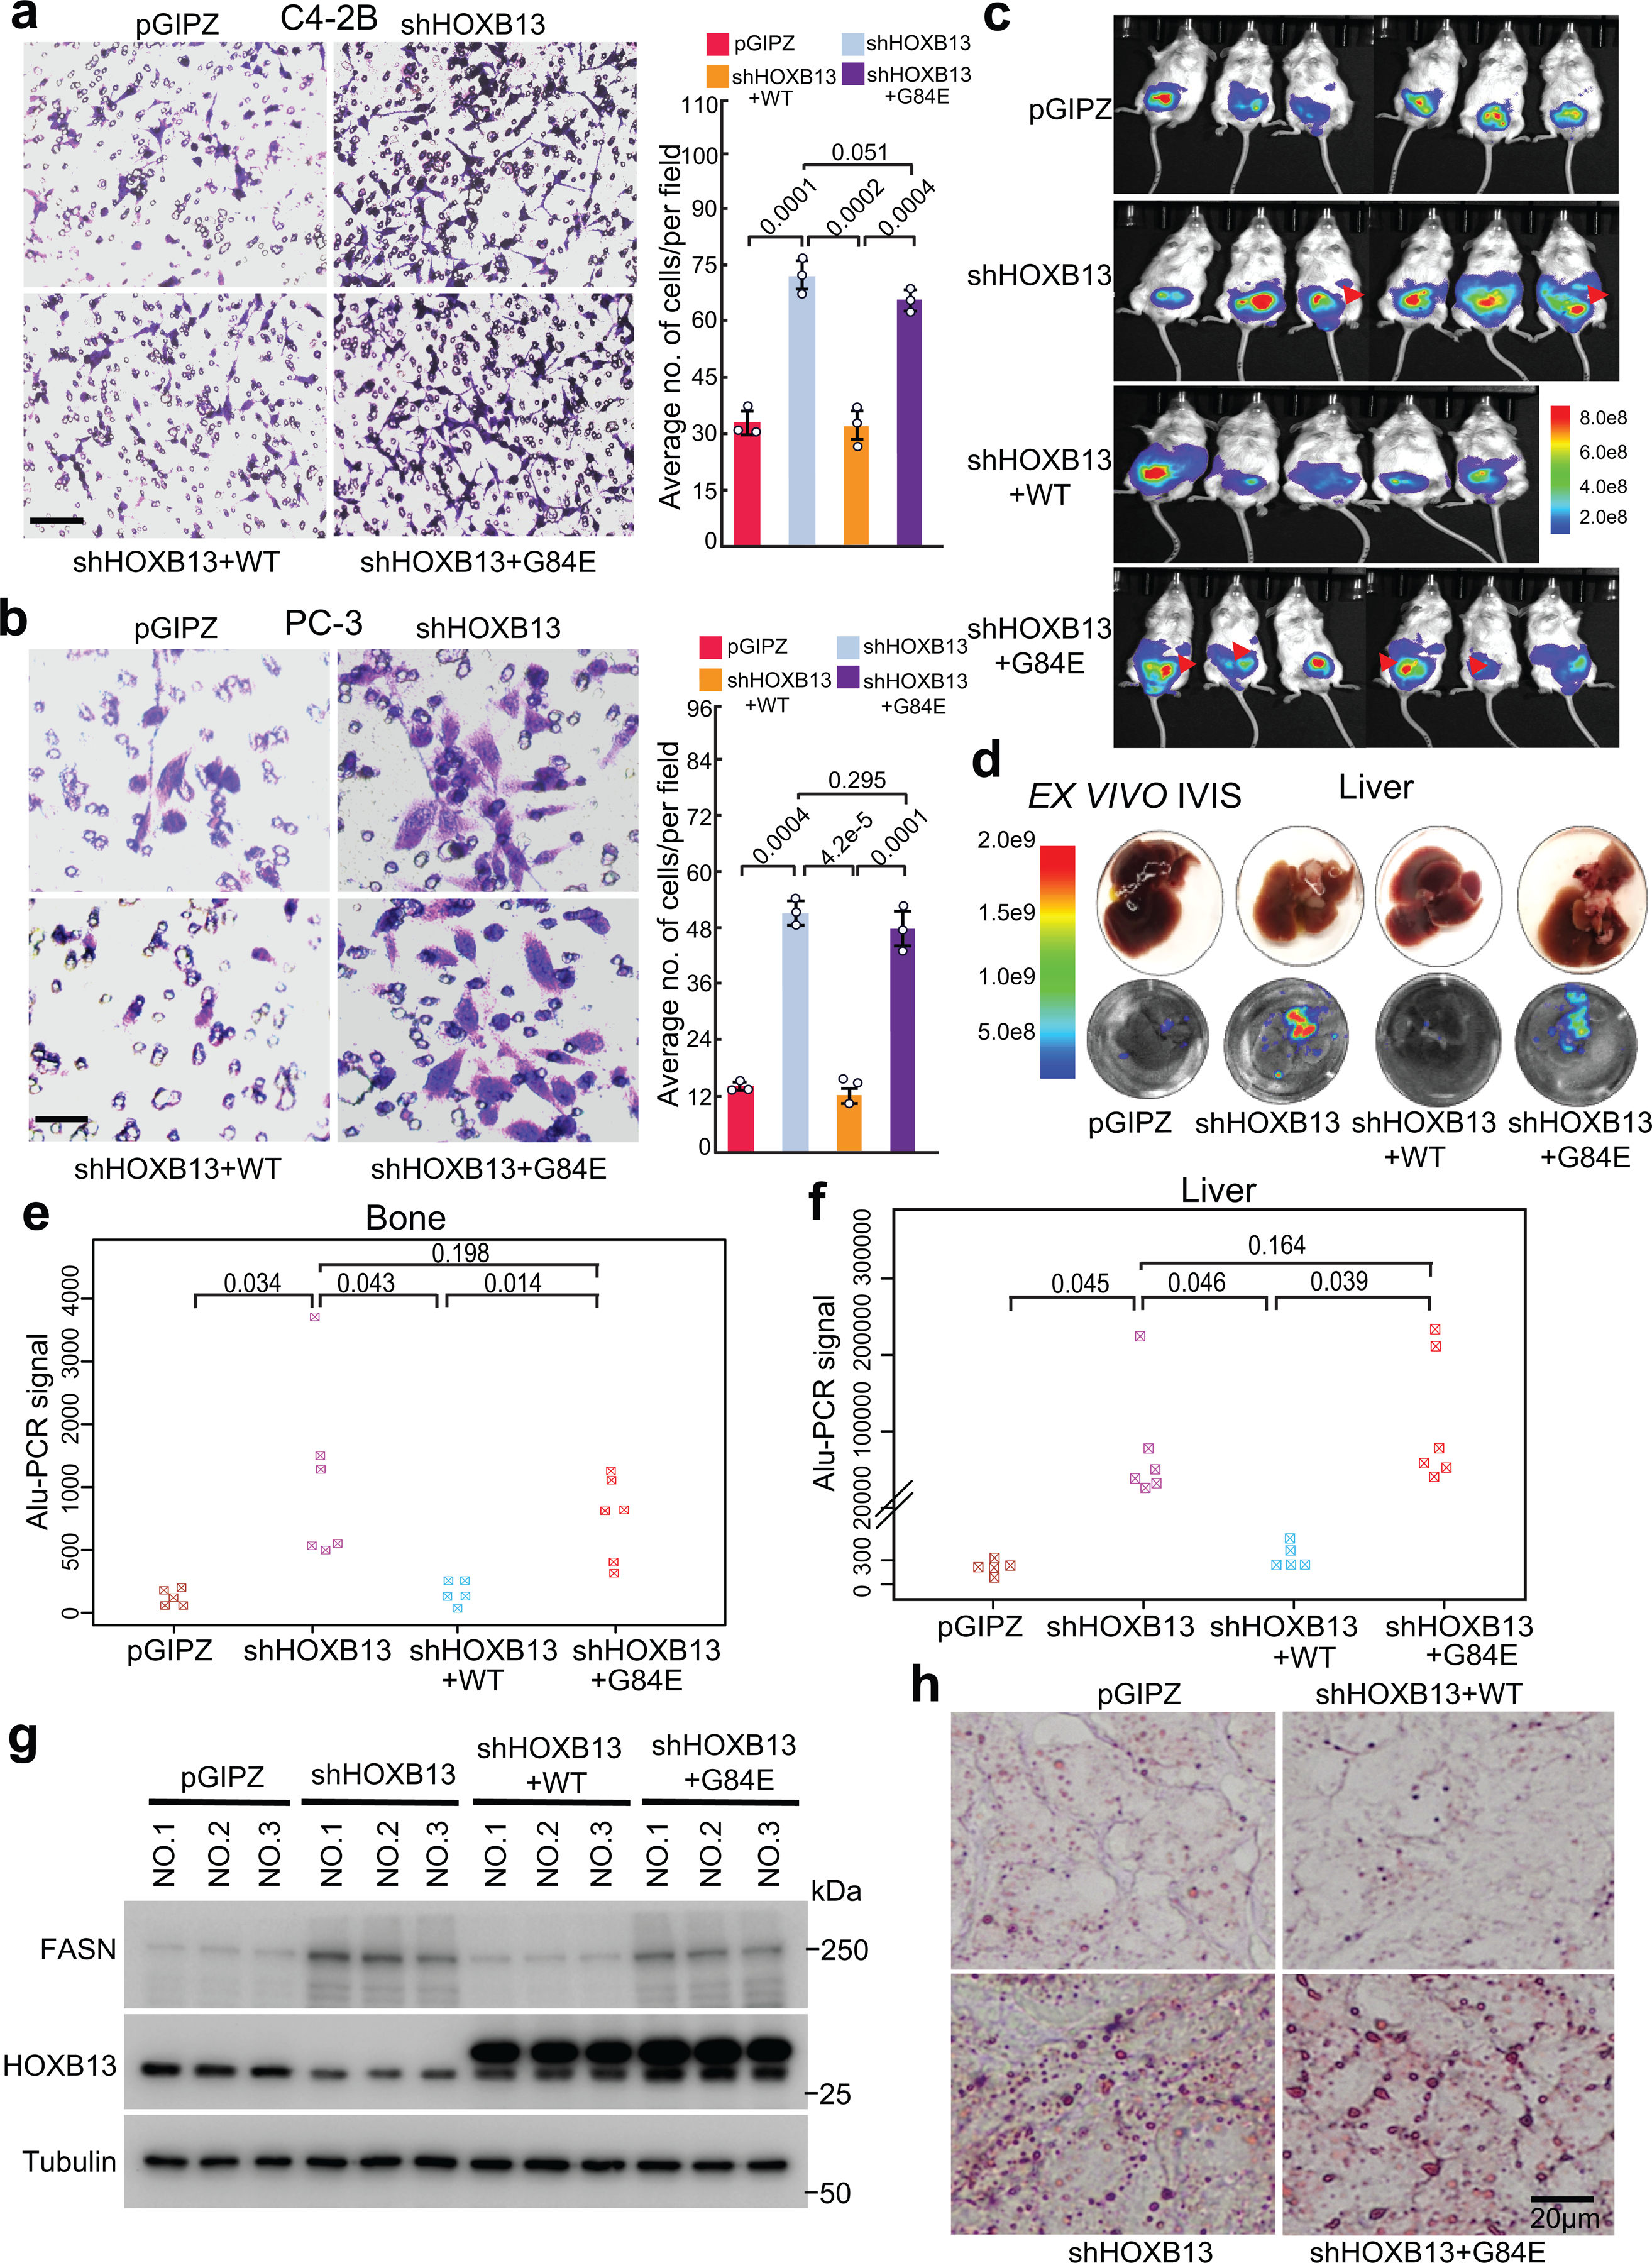
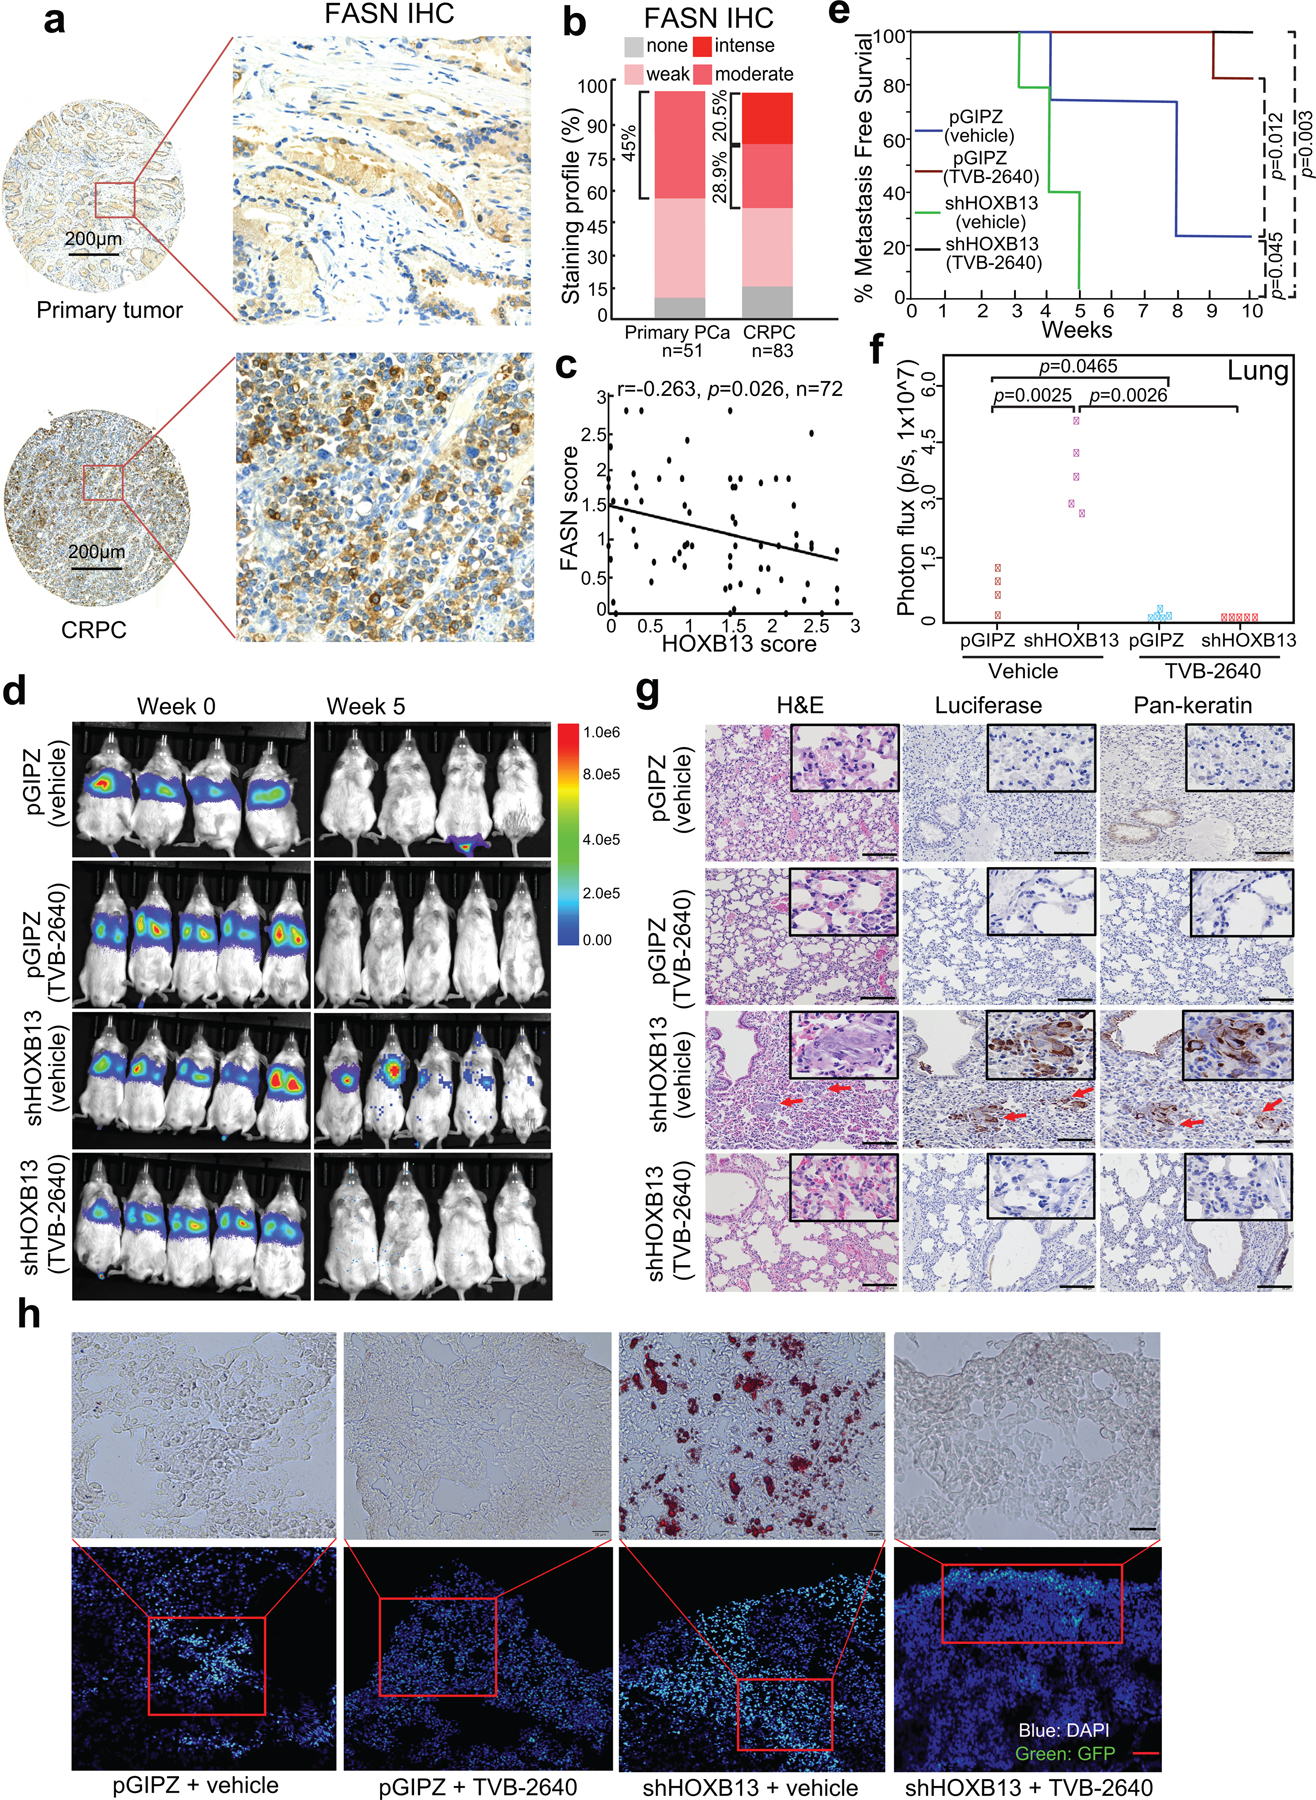
HOXB13, a homeodomain transcription factor, critically regulates androgen receptor (AR) activities and androgen-dependent prostate cancer (PCa) growth. However, its functions in AR-independent contexts remain elusive. Here we report HOXB13 interaction with histone deacetylase HDAC3, which is disrupted by the HOXB13 G84E mutation that has been associated with early-onset PCa. Independently of AR, HOXB13 recruits HDAC3 to lipogenic enhancers to catalyze histone deacetylation and suppress lipogenic regulators such as fatty acid synthase. Analysis of human tissues reveals that the HOXB13 gene is hypermethylated and downregulated in approximately 30% of metastatic castration-resistant PCa. HOXB13 loss or G84E mutation leads to lipid accumulation in PCa cells, thereby promoting cell motility and xenograft tumor metastasis, which is mitigated by pharmaceutical inhibition of fatty acid synthase. In summary, we present evidence that HOXB13 recruits HDAC3 to suppress de novo lipogenesis and inhibit tumor metastasis and that lipogenic pathway inhibitors may be useful to treat HOXB13-low PCa.


Conflict of interest statement

Conflict of Interest: All authors have declared that no conflict of interest exists.

Figures

Extended Data Fig. 1
Extended Data Fig. 1. HOXB13 WT, but not G84E mutant, inhibits lipogenic programs in PCa
a. Heatmap showing HOXB13-induced gene expression in PCa cells with HOXB13 KD and/or rescue. HOXB13-induced (n=276) genes were derived by comparing shHOXB13 with pGIPZ using FDR<0.05 and fold change>=2.5. b. GO analysis of HOXB13-induced genes identified in a. GO analyses was performed by DAVID, top enriched molecular concepts are shown. The X-axis indicates enrichment significance. One-sided Fisher’s Exact test was performed and −log10 (p-value) are shown. c. QRT-PCR validation of cell cycle gene regulation by HOXB13 in LNCaP cells. d. RT-qPCR validation of PSA and other key lipogenic gene regulation by HOXB13 in PC-3, C4–2B, and 22Rv1 cells. e. IGV view of the percentage of HOXB13 WT (C) and G84E alleles (T) (left) and genome browser view of mRNA expression of FASN (right, chr17:80,036,214–80,056,106, hg19, hg19) in WT and five isogenic G84E clones of 22Rv1. The isogenic G84E cells of HOXB13 were generated by CRISPR editing. f. WB validating the expression of FASN, PSA, AR, and HOXB13 in control and HOXB13-KD LNCaP cells. LNCaP cells were infected with control shRNA (pGIPZ) or shRNA targeting HOXB13 (shHOXB13) for four days, followed by hormone starvation (Ethl) or regular medium (10% FBS) for three days. g. Pie chart showing the genomic distribution of HOXB13 binding sites in LNCaP cells. h-i. ChIP-qPCR analyses of HOXB13 at lipogenic gene enhancers in LNCaP (h) cells with HOXB13 KD and/or rescue and PC-3 (i) cells with HOXB13 KD. Data in c,d and h,i were shown as technical replicates from one of three (n=3) independent experiments. Data shown are mean ±s.e.m, P values by unpaired two-sided t-test.
Extended Data Fig. 2
Extended Data Fig. 2. HOXB13 interacts with HDAC3 protein through its MEIS domain
a. Heatmap showing the number of peptides of AR-cofactors and HDAC3/NCoR complex enriched by HOXB13 WT or G84E mutant mass spectrometry. The complete lists are included in Supplemental Table 6. b-c. Co-IP of V5-NcoR1 full-length (FL) or deletion mutants (b) expressed in 293T cells along with HOXB13, with or without HDAC3 co-expression (c). Co-IP using whole-cell lysates showed no interactions between HOXB13 and NCoR1 in cells without HDAC3 co-expression. d-e. Co-IP of HA-HDAC3 FL or deletion mutants (d) expressed in 293T cells along with HOXB13 (e). Whole-cell lysates were subjected to co-IP using an anti-HA antibody. f. Fractionation assay showing cellular localization of HOXB13 WT and mutants in LNCaP cells. WT, G84E and ΔMEIS HOXB13 were detected on the chromatin, whereas ΔHOX and WFQ-3A have impaired ability to bind chromatin. Asterisk indicates endogenous HOXB13. g-h. Schematic illustration of a series of HOXB13 deletion mutants (g) and their interaction with HDAC3 (h). Whole-cell lysates from 293T cells co-transfected with HA-HDAC3 along with Flag-tagged HOXB13 FL or its deletion mutants were subjected to co-IP using an anti-Flag antibody. Asterisk indicates the size of corresponding mutants. i. The interaction between HOXB13 and MEIS1 is not interrupted by HDAC3. Whole-cell lysates from 293T cells co-transfected with Flag-HOXB13 along with HA-tagged MEIS1 and gradually increased amount of HA-tagged HDAC3 were subjected to co-IP using an anti-Flag antibody.
Extended Data Fig. 3
Extended Data Fig. 3. HOXB13 recruits HDAC3 to catalyze histone deacetylation
a-b. MA plot showing differential HOXB13 (a) and HDAC3 ChIP-seq enrichment (b) in control (pGIPZ) and HOXB13 KD (shHOXB13) LNCaP cells. Color encodes the intensity of HOXB13 ChIP-seq in control cells. Dotted lines represent 2-fold differences. c. Venn diagram showing the overlap between HDAC3 and HOXB13 cistromes in PC-3 and LNCaP cells (top). Bottom: H3K27ac ChIP-seq was performed in PC-3 cells with control or HOXB13 KD, and their average intensity plots centered (±5 kb) on co-occupied sites are shown. d-e. ChIP-qPCR analyses of HDAC3 (d) and H3K27ac (e) at lipogenic gene enhancers in PC3 cells with control or HOXB13 KD. Data were normalized to 2% of input DNA. Shown are the mean ±s.e.m of technical replicates from one of three (n=3) independent experiments. P values were calculated by unpaired two-sided t-test. f-h. ChIP-qPCR analysis of HOXB13 (f), HDAC3 (g), and H3K27ac (h) at PSA and FASN enhancer in 7 CRPC PDX tumors. Data were normalized to 5% of input DNA. Shown are the mean ±s.e.m of technical replicates from one of three (n=3) independent experiments. Unpaired two-sided t-test was performed between indicated groups.
Extended Data Fig. 4
Extended Data Fig. 4. HDAC3 is required for HOXB13-mediated suppression of de novo lipogenesis
a. Venn Diagram showing the overlap between HOXB13- or HDAC1/3-induced or –repressed genes in LNCaP cells. b. GO analysis of HDAC1/3-repressed (left) and -induced (right) genes in LNCaP cells. Top enriched molecular concepts are shown. p values were calculated by one-sided Fisher’s exact test. c. QRT-PCR analysis of SREBF2, FASN, and SCD expression in PC-3 cells with KD of HOXB13, HDAC3, or both. Data were normalized to GAPDH. Shown are mean ±s.e.m of technical replicates from one of three (n=3) independent experiments. P values were calculated by unpaired two-sided t-test. d. WB analysis of HOXB13 and HDAC1/3 co-regulated genes in LNCaP cells with HOXB13 KD and rescue by HOXB13 WT or mutants. HOXB13 depletion expectedly led to up-regulation of FASN, SREBF1, and PSA, which were again repressed by re-introduction of WT HOXB13. HOXB13 ΔHOX/WFQ-3A mutants, although capable of interacting with HDAC3, are unable to bind DNA17 and consequently failed to repress lipogenic genes. Importantly, ΔMEIS and G84E mutants, which have impaired ability to interact with HDAC3, also failed to fully repress these genes. e-f. Oil Red O staining and quantification of lipid accumulation in 22Rv1 (e) and PC-3 (f) with shHOXB13 and/or rescue. Scale bar: 30 μm. Quantification data are the mean ±s.d of technical replicates from one of two (n=2) independent experiments. P values were calculated by unpaired two-sided t-test. h. LipidSpot staining and quantification of lipid droplets in HOXB13 WT and five clones of isogenic G84E 22Rv1. Scale bar:20 μm. LipidSpot staining intensity was quantified and calculated as the fold change of LipidSpot staining in G84E mutant cells compared with WT controls (right). Each data point represents an average of 6 (n=6) fields per independent experiment by image J. Data are the mean ±s.d. Unpaired two-sided t-test was performed between indicated groups as show in figure.
Extended Data Fig. 5
Extended Data Fig. 5. HOXB13 KD induces de novo lipogenesis in PCa cells cultured in either lipid-free or regular medium
a-e. LipidSpot staining and quantification of lipid droplets in control (sgNC) or HOXB13 KD (sgHOXB13) LNCaP (a-c) and PC-3M (d-f) cultured in lipid-free or regular medium (10% FBS). WB (a,d) validating FASN up-regulation in HOXB13-KD cells cultured in lipid-free medium, confirming de novo lipogenesis. Data (b,e) shown are representative images of LipidSpot staining with a scale bar of 20 μm. LipidSpot staining intensity was quantified and calculated as fold change of LipidSpot staining in each condition normalized to sgNC non-target control under lipid-free medium (c,f). Each data point represents an average of 6 (n=6) fields per independent experiment by image J. Data are the mean ±s.d. Unpaired two-sided t-test were performed between indicated groups as show in figure. g. Quantification of lipid accumulation of PDXs in Fig.4i. Six (n=6) representative areas per PDX were quantified using Image J. Data are shown as mean±s.d. Unpaired one-sided t-test was performed between indicated groups as show in figure.
Extended Data Fig. 6
Extended Data Fig. 6. HOXB13 is hypermethylated and down-regulated in CRPC
a. HOXB13 gene methylation levels in a variety of cancer types and corresponding benign (normal) samples using TCGA methylation data. Blue arrow indicates PCa (PRAD). *marks tumor types of significant differences compared with matched benign samples by Wilcoxon rank sum test. The sample sizes were included in Supplemental Table 7. b. Average methylation levels of Illumina Infinium probes targeting different regions of the HOXB13 gene (chr17:46,802,127–46,806,111. hg19) based on TCGA methylation data. Probes in green fonts target CpG islands. *probes with significantly differential methylation between normal and prostate tumor samples (Wilcoxon rank sum test with adjusted p-value < 0.05). c-d. Genome browser view of RNA-seq data (c) of HOXB13 (chr17:48,724,763–48,728,750, hg38) and average methylation levels (d) of 3 CpG islands within the HOXB13 gene loci (chr17:44,157,125–44,161,110. hg18) in LNCaP, 22Rv1, PC-3, DU145, and RWPE-1 cells. e. Expression of HOXB13 in Log2(FKPM) in LuCaP PDXs based on RNA-seq data. Blue indicates high- and red for low-HOXB13 samples. f. IGV track showing methylation at HOXB13 gene (chr17:46,802,127–46,806,111. hg19) in LuCaP PDX tumors with high or low HOXB13 as indicated in e. HOXB13 gene methylation in LuCaP PDX tumors was analyzed using MeDIP-seq data. g-h. RT-qPCR and WB analyses of PC-3M cells subjected to EZH2 or GFP-DNMT3A overexpression. PCR data shown are mean ±s.e.m. of technical replicates from one of three (n=3) independent experiments and analyzed by unpaired two-sided t-test. i. WB analyses of LNCaP cells treated with dCas9-SunTag-DNMT3A system with gRNAs targeting the 4 CpGs within the HOXB13 gene loci. The gRNAs were cloned into the pLKO5.sgRNA.EFS.tRFP657 vector and an sgRNA (NC) that had no cognate target in the human genome was used as a negative control. WB was performed 7 days after co-infection of indicated constructs.
Extended Data Fig. 7
Extended Data Fig. 7. HOXB13 loss induces PCa cell motility in vitro and tumor metastasis in vivo
a. Colony formation assays were performed in LNCaP, C4–2B and PC-3 cells with HOXB13 de-regulation or indicated treatment. The data showed that androgen-dependent LNCaP cell growth was abolished by HOXB13 KD, which could be restored by re-expression of either WT or G84E HOXB13, suggesting an AR-dependent effect. By contrast, C4–2B is only partially sensitive to HOXB13 KD, whereas the growth of C4–2B cells pre-treated by enzalutamide (ENZ) and the AR-negative PC-3 cells is unaffected by HOXB13 KD. b. Cell invasion assays of control or HOXB13-KD PC-3M cells cultured in lipid-free or regular medium. Representative images are shown (left panels), and the number of invaded cells are quantified (right panel). Scale bar: 50 μm. Quantified data shown are mean ±s.d. of three representative fields from one of three (n=3) independent experiments. P values were calculated by unpaired two-sided t-test. c. Cell migration assays of PC-3 cells with control or shHOXB13. Images shown were taken at 0 and 48 hours after a scratch was created on the cell monolayer. d. Tumor volume was measured by IVIS after two weeks of intra-prostate inoculation of PC-3M cells. Y-axis shows the normalized luciferase intensity. Statistical significance was evaluated by one-way ANOVA test (P=0.836). e. HOXB13 de-regulation did not affect PC-3M xenograft tumor growth. Tumor volume was measured every week by IVIS live mice imaging. Y-axis shows the normalized luciferase intensity. Data shown in each time point are mean ± s.d. Statistical significance was evaluated by one-way ANOVA test (P=0.365).
Extended Data Fig. 8
Extended Data Fig. 8. Effect of various lipogenic inhibitors on PCa cells
a. FASN mRNA levels in publically available PCa gene expression profiling datasets. Data shown (Y-axis) are log2-transformed microarray expression values for GSE6919 and GSE35988 and FPKM values for TCGA-dbGaP dataset, which combines prostate samples from dbGaP datasets with accession#: phs000178(TCGA), phs000443, phs000915, and phs000909. P values between primary and metastatic PCa were calculated using unpaired two-sided t-test. Boxplots represent the median and bottom and upper quartiles; Whisker edges indicate minimum and maximum values. b. Cell invasion of control or HOXB13-KD cells treated with various lipid inhibitors. PC-3M cells were treated with 5μM TVB-2640, 5μM TOFA, 2μM Fatostatin or 2μM Simvastatin for 3 days. C4–2B cells were treated with 1μM of indicated inhibitors for 3 days. Representative images are shown for C4–2B with a Scale bar of 50 μm and PC-3M with a Scale bar of 30 μm. c. Quantification of cell invasion shown in b. Data shown are the mean ±s.d of three representative fields from one of two (n=2) independent experiments. P values were calculated by unpaired two-sided t-test comparing inhibitor groups with DMSO in control or shHOXB13 cells. d-e. Representative images of Oil Red O staining (d) and quantification (e) of lipid accumulation in HOXB13-KD PC-3M cells treated with DMSO or 5μM TVB-2640 for 3 days. Scale bar: 30 μm. Data shown are the mean ± s.d of triplicate wells from one of two (n=2) independent experiments. Unpaired two-sided t test was performed between indicated groups as shown in figures.
Extended Data Fig. 9
Extended Data Fig. 9. Therapeutic targeting of HOXB13-low tumors with FASN inhibitors in an orthotopic xenograft model
a. Graph showing tumor volumes after intraprostatic inoculation of PC-3M cells. Tumor formation was confirmed by IVIS one week after inoculation. Then the mice were randomized to receive vehicle (30% PEG400) or TVB-2640 (100mg/Kg) every day for 30 days. Tumor volumes were measured twice per week by IVIS after two weeks of inoculation. Y-axis shows the normalized luciferase intensity. Data in each time point are mean ±s.d. Statistical significance was evaluated by one-way ANOVA (P=0.0007) and comparisons between indicated groups by post hoc Tukey test. PC-3M xenograft tumor growth was not affected by HOXB13 KD (p=0.3212). Importantly, primary tumor growth in both control (pGIPZ, p=0.0171) and HOXB13-KD (shHOXB13, p=0.0082) mice was significantly inhibited by TVB-2640. b-c. Representative ex vivo IVIS images (b) and quantifications (c) of PC-3M tumor metastasis to the liver and lung (n=6 mice per group). Heatmap shows IVIS signal intensity color scale. Indicated p-values were shown by unpaired two-sided t-test. HOXB13 KD significantly promoted PCa metastases, which was abolished by TVB-2640. d. Validation of PC-3M tumor metastasis to the liver by H&E and IHC. Luciferase and Pan-keratin IHC were used to identify metastasized PC-3M cells in mouse liver. Representative images of H&E, Luciferase and Pan-keratin staining in indicated group (n=3 mice in each group) are shown. Scale bar: 30 μm. “T” indicates tumor and “n” for normal liver. e. Kaplan-Meier analyses of overall survival of pGIPZ and HOXB13 KD mice treated with vehicle or TVB-2640 (n=6 mice per group). P values were determined by the log-rank test. TVB-2640 treatment prolonged the overall survival of mice in both control (p= 0.017) and HOXB13-KD (p= 0.005) groups.
Extended Data Fig. 10
Extended Data Fig. 10. Therapeutic targeting of HOXB13-low tumors with FASN inhibitors in an intravenous xenograft model
a. Body weight analysis in mice inoculated by control or HOXB13-KD PC-3M cells and treated with vehicle or TVB-2640. Data in each time point are mean ±s.d. Y-axis shows the percentage of body weight change. b-c. Representative ex vivo IVIS images (b) of PC-3M tumor metastasis to lung, hind leg, liver, and rib and quantification (c) of metastasis to liver, hind leg, and rib (n=4 mice for pGIPZ vehicle group; n=5 mice for the rest groups). At the endpoint, lung, hind leg, liver, and rib were collected and analyzed using ex vivo IVIS. Heatmap in b shows IVIS signal intensity color scale. Y-axis in c shows the normalized luciferase intensity. Indicated p values were by unpaired two-sided t test.
Fig. 1.
Fig. 1.. HOXB13 WT, but not G84E mutant, inhibits lipogenic programs in PCa.
a. Heatmap showing HOXB13-repressed gene expression in PCa cells with HOXB13 KD (shHOXB13) and/or rescue by WT or G84E HOXB13. HOXB13-repressed genes were derived by comparing shHOXB13 with pGIPZ cells using FDR <0.05 and fold-change ≥2.5. The red bracket indicates HOXB13-repressed genes that are rescued by WT, but not G84E, HOXB13. The complete gene lists are included in Supplemental Table 3. b. GO analysis of HOXB13-repressed genes identified in (a). Top enriched molecular concepts are shown on y-axis, while x-axis indicates enrichment significance. One-sided Fisher’s exact test was performed, and −log10 P values are shown. c. RT-qPCR validation of key lipogenic gene regulation by HOXB13 in LNCaP cells. Data were normalized to GAPDH and shown as technical replicates from one of three (n = 3) biological replicates. Data shown are mean ±s.e.m. P values by unpaired two-sided t-test. d. WB of key lipogenic gene regulation by HOXB13 KD and rescue in LNCaP cells. *uncleaved and cleaved forms of SREBF2. e. WB analysis of FASN regulation by HOXB13 in multiple PCa cell lines with HOXB13 KD and/or WT/G84E rescue. f. WB analysis of FASN regulation by HOXB13 in LNCaP cells with KD of AR (siAR) and/or HOXB13. g. HOXB13 ChIP-seq data were integrated with RNA-seq of control and HOXB13-KD LNCaP cells using BETA software to predict activating/repressive functions of HOXB13. Genes are cumulated by rank on the basis of the regulatory potential score from high to low. The dashed line indicates the non-differentially expressed genes as background. The red and purple lines represent the upregulated and downregulated genes, respectively, and their P values were calculated relative to the background group by the Kolmogorov-Smirnov test. h. Heatmap showing HOXB13 ChIP-seq intensity in HOXB13-KD and rescue LNCaP cells. i. Venn Diagram comparing HOXB13 cistromes between LNCaP and human PCa tissues.
Fig. 2.
Fig. 2.. HOXB13 interacts with HDAC3 protein through its MEIS domain.
a. Co-IP of HDAC1 and HDAC3 shows interaction with HOXB13. Whole-cell lysates from LNCaP cells stably expressing Flag-tagged HDAC1 or HDAC3 were subjected to co-IP using anti-Flag antibody. The eluted co-IP complex was analyzed by WB, along with input controls. * indicates non-specific bands detected by anti-Flag antibody. b. Cell lysates from LNCaP stably expressing HA-HOXB13 WT or G84E mutant were subjected to co-IP using an anti-HA antibody and then WB, along with input controls. c. HOXB13 interaction with HDAC3 is not dependent on AR. Whole-cell lysates from LNCaP with control (siCtrl) or AR knockdown (siAR) were subjected to co-IP using an anti-HOXB13 antibody and then WB, along with input controls. d. AR-negative PC-3 cells were subjected to co-IP using anti-HOXB13 or IgG control antibodies and then WB, along with input controls. e-f. Co-IP of HA-HDAC3 FL or deletion constructs (e) transfected into 293T cells with coexpression of HOXB13 (f). g-h. Co-IP of Flag-HOXB13 FL or deletion constructs (g) transfected into 293T cells with HDAC1 and HDAC3 co-expression (h). i. A model depicting the interactions between HOXB13 and HDAC3/NCoR complex. CTD: C-terminal domain of HDAC3; MEIS: the MEIS domain of HOXB13; and DAD: the DAD domain of SMRT/NCoR.
Fig. 3.
Fig. 3.. HOXB13 recruits HDAC3 to catalyze histone deacetylation.
a. Venn diagram showing overlap of HOXB13, AR, and HDAC3 binding sites in LNCaP cells. b. Heatmap showing signals of HOXB13, HDAC3, AR, and H3K27ac ChIP-seq and ATAC-seq in LNCaP cells with control or HOXB13 KD, centered (± 2 kb) on selected genomic regions defined in a. HH sites: HOXB13/HDAC3 co-occupied sites. The color bar on the right shows the scale of enrichment intensity. c. Heatmap showing H3K27ac ChIP-seq signal in a set of 12 clinical PCa samples (GSE130408) centered on selected genomic regions as in b. d. Average H3K27ac signal centered (± 5 kb) on HDAC3 and HOXB13 co-occupied sites (HH sites). H3K27ac ChIP-seq was performed in LNCaP infected with pGIPZ control, shHOXB13 (KD), or KD with co-infection of WT or G84E HOXB13. e. Genome browser view of H3K27ac ChIP-seq signal around representative lipogenic genes (FASN, chr17:80,036,214–80,056,106 and SREBF2, chr22:42,229,106–42,302,375, hg19). The red and green arrows at the bottom indicate the primers used for the ChIP-qPCR assay. f-g. HDAC3 (f) and H3K27ac (g) ChIP-qPCR validation of lipogenic gene enhancers (enh) in LNCaP with HOXB13 KD and/or rescue. Primers for FASN and SREBF2 are depicted in e. Data were normalized to 2% of input DNA. Shown are the mean ±s.e.m. of technical replicates from one of three (n = 3) independent experiments. P values were calculated by unpaired two-sided t-test.
Fig. 4.
Fig. 4.. HDAC3 is required for HOXB13-mediated suppression of de novo lipogenesis.
a. HOXB13- and HDAC1/3-regulated genes in LNCaP. Differentially regulated genes were identified by fold-change ≥2 and FDR <0.05. b. GSEA showing enrichment of HDAC1/3-repressed genes in shHOXB13 LNCaP cells as compared to control pGIPZ. Shown at the bottom are heatmap of leading-edge gene expression in corresponding samples. c. Heatmaps shown on the left indicate HOXB13 regulation of its induced (top) and repressed (bottom) genes in shCtrl or shHDAC3 LNCaP cells. Heatmap on the right show HDAC3 regulation of its induced (top) and repressed (bottom) genes in LNCaP cells with control or HOXB13 OE. d-e. RT-qPCR and WB analysis of FASN and PSA expression in LNCaP cells with KD of HOXB13, HDAC3, or both. Data were normalized to GAPDH. Shown are the mean ±s.e.m. of technical replicates from one of three (n = 3) independent experiments. P values were calculated by unpaired two-sided t-test. f-g. Representative images of Oil Red O staining (left) and quantification (right) of neutral lipids in LNCaP with (f) shHOXB13 and rescue by WT or G84E HOXB13 and (g) with control, HOXB13 OE and/or HDAC3 KD. Scale bar: 30 μm. Quantification data are the mean ±s.d. of technical replicates from one of two (n = 2) independent experiments. P values were calculated by unpaired two-sided t-test. h. HOXB13 or HDAC3 regulation of KEGG lipid metabolism-related pathways. For each gene set, differentially regulated genes (FDR <0.05, fold >2) by HOXB13 were selected, and the Z-score for each gene was normalized across all 6 samples. Heatmap shows the average Z-score of each gene set (row) in each sample (column). The red bar on the left indicates lipid metabolism pathways that are repressed by HOXB13 OE. Concepts that were rescued by shHDAC3 are shown in bold (right). i. Representative images of Oil Red O staining of neutral lipids in HOXB13low (bottom) or HOXB13high (top) LuCaP PDXs. Scale bar: 30 μm.
Fig. 5.
Fig. 5.. HOXB13 is hypermethylated and down-regulated in CRPC.
a. HOXB13 expression levels in benign prostate tissues (Normal), primary PCa, and metastatic CRPC in publically available PCa datasets. Data shown (y-axis) are Z-scores of microarray expression values for GSE6919 and GSE35988 and FPKM values for the TCGA-dbGaP dataset, which combines prostate samples from dbGaP datasets with accession#: phs000178(TCGA), phs000443, phs000915, and phs000909. P values between primary and metastatic PCa were calculated using unpaired two-sided t-tests. Boxplots represent the median and bottom and upper quartiles; Whisker edges indicate the minimum and maximum values. b. Representative images of HOXB13 staining in primary tumors (top panels) and metastatic CRPC (bottom panels) are shown in low- (40×) and high-magnification (200×). c. Quantification of HOXB13 IHC staining intensities in human PCa and CRPC. y-axis shows the percentage of tumors with none, weak, moderate, and intense IHC staining. d. Correlation between HOXB13 gene methylation (x-axis) and expression at mRNA level across PCa samples available at TCGA database. The linear regression line (red) with its 95% confidence interval (gray) is shown. e. Methylation of the HOXB13 gene (chr17:48,724,763–48,728,750. hg38) from the transcription start site (TSS) to transcription termination site (TES) in bottom 18 HOXB13low and top 18 HOXB13high out of all 98 CRPC tumors, relative to five primary PCa. y-axis shows the percentage of methylation. f. Correlation between methylation rate (0–1) of two CpG islands (named CpG21, CpG29) within the HOXB13 gene, as depicted in Figure 5e, with HOXB13 mRNA levels (FPKM) across all 98 mCRPC samples. Two-sided P values for the T-distribution are shown. g-h. RT-qPCR and WB analyses of LNCaP cells subjected to EZH2 or GFP-DNMT3A overexpression. Data shown are mean ±s.e.m. of technical replicates from one of three (n = 3) independent experiments and analyzed by unpaired two-sided t-test.
Fig. 6.
Fig. 6.. HOXB13 loss promotes cell motility and PCa metastasis.
a. Cell invasion assays of C4–2B cells with shHOXB13 and/or rescue by HOXB13 WT or G84E mutant. Representative images are shown (left panels), and the number of invaded cells is quantified (right panel). Scale bar: 50 μm. b. Cell invasion assays of PC-3 cells with shHOXB13 and/or rescue by HOXB13 WT or G84E mutant. Representative images are shown (left panels), and the number of invaded cells is quantified (right panel). Scale bar: 30 μm. c. IVIS live mouse imaging of orthotopic PC-3M xenograft tumors at three weeks after intraprostate inoculation. Red arrows indicate local metastasis. Heatmap shows the scale of IVIS signal intensity. d. ex vivo IVIS imaging of tumor cells metastasized to the liver. At the endpoint, mice were euthanized, livers were collected, and IVIS was performed ex vivo. Data shown are representative ex vivo IVIS images of the liver obtained from one mouse of each experiment group. The heatmap on the left indicates the intensity of the IVIS signal. e-f. Genomic DNA was isolated from mouse bone (e) and liver (f) (n = 5 mice for pGIPZ and shHOXB13+WT, n = 6 mice for shHOXB13 and shHOXB13+G84E group) and analyzed for metastasized PC-3M xenograft tumor cells by quantifying human Alu sequence by PCR. y-axis shows the human Alu signal detected by qPCR. Unpaired one-sided t-tests were performed between indicated groups. g. PC-3M xenograft prostate tumors from three mice per group were collected and subjected to WB analysis. h. Oil Red O staining of lipids in representative PC-3M xenograft prostate tumors. Scale bar: 20 μm. Quantification data in a-b are the mean ±s.d. of three representative fields from one of three (n = 3) independent experiments. P values were calculated by unpaired two-sided t-test.
Fig. 7.
Fig. 7.. Therapeutic targeting of HOXB13-low tumors with a FASN inhibitor.
a. IHC staining of FASN in human primary PCa and CRPC. Representative images of FASN staining in primary tumors (top panels) and metastatic CRPC (bottom panels) are shown in low- (40×) and high-magnification (200×). b. Quantification of FASN staining intensities in human PCa. y-axis shows the percentage of tumors with none, weak, moderate, and intense IHC staining. c. Pearson correlation between FASN and HOXB13 IHC scores in 72 sites from 25 CRPC patients. A two-sided P value for the T-distribution was shown. d. IVIS imaging of intravenous PC-3M xenograft tumors at week 0 (left) and 5 (right) after inoculation. Heatmap shows IVIS signal intensity color scale. e. Kaplan-Meier analyses of metastasis-free survival of pGIPZ and HOXB13 KD mice (n = 4 mice for pGIPZ vehicle group, n = 5 mice for the rest groups) treated with vehicle or TVB-2640. Metastasis was defined as a whole-mouse IVIS signal higher than 1 × 10⁵ photons/s after three weeks of inoculation. P values were determined by a log-rank test. f. ex vivo IVIS analysis and quantification of PC-3M tumor metastasis to the lung. The number of mice in each group is the same as in e. y-axis shows the normalized luciferase intensity. Indicated P values were shown by an unpaired two-sided t-test. g. Luciferase and Pan-keratin IHC were used to identify metastasized PC-3M cells in the lungs of the mice. Representative images of H&E, Luciferase, and pan-keratin IHC staining in the indicated groups (3 mice in each group) are shown. Scale bar: 30 μm. Insets are shown at higher magnification. Red arrows indicate metastases in mouse lungs. h. Tumors in the lung were identified by GFP (Green) by IF (bottom row), and an adjacent section was used for Oil Red O staining (top). The IF images (bottom) have a Scale bar of 30 μm, and the Oil Red O staining images (top) have a Scale bar of 20 μm.

Comment in

  • Uro-Science.
    Atala A. Atala A. J Urol. 2022 Dec;208(6):1340-1342. doi: 10.1097/JU.0000000000002980. Epub 2022 Sep 26. J Urol. 2022. PMID: 36154669 No abstract available.

References

    1. Zadra G et al. Inhibition of de novo lipogenesis targets androgen receptor signaling in castration-resistant prostate cancer. Proc Natl Acad Sci U S A 116, 631–640 (2019). - PMC - PubMed
    1. Poulose N et al. Genetics of lipid metabolism in prostate cancer. Nat Genet 50, 169–171 (2018). - PubMed
    1. Butler LM, Centenera MM & Swinnen JV Androgen control of lipid metabolism in prostate cancer: novel insights and future applications. Endocr Relat Cancer 23, R219–27 (2016). - PubMed
    1. Swinnen JV, Esquenet M, Goossens K, Heyns W & Verhoeven G Androgens stimulate fatty acid synthase in the human prostate cancer cell line LNCaP. Cancer Res 57, 1086–90 (1997). - PubMed
    1. Swinnen JV, Ulrix W, Heyns W & Verhoeven G Coordinate regulation of lipogenic gene expression by androgens: evidence for a cascade mechanism involving sterol regulatory element binding proteins. Proc Natl Acad Sci U S A 94, 12975–80 (1997). - PMC - PubMed

Publication types